Modeling Stem Cell Differentiation Pathways Using a Minimum Spanning Tree
Stem cells are cells that are capable of giving rise to an indefinite number of cells of the same type by undergoing a differentiation process. For example, muscle stem cells (MuSC) become myocytes, which develop into myoblasts. These myoblasts can then fuse to form multi-nucleated myotubes, many of which come together to form muscle fibers. Complex gene-regulation and expression profiles (relative expression levels of characteristic genes) define cellular processes along this pathway such as proliferation and differentiation. In the past, changes in expression profiles were monitored by monitoring gene expression at select time intervals after collecting a pool of MuSCs. However, recent studies carried out at single-cell resolution “revealed high cell-to-cell variation in the expression of most genes.” In other words, taking the average measurements for gene expression by pooling MuSCs and collecting samples could lead to statistical complications when analyzing the data, such as Simpson’s paradox.
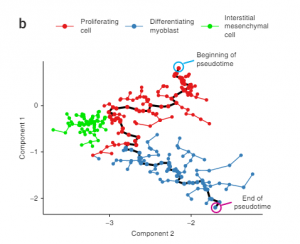
In this paper, the authors developed an algorithm called Monocle that uses expression data to order the cells by their progress through differentiation rather than by the time they were collected. This maximizes the transcriptional similarity between successive pairings of cells. First, the algorithm models the expression profile of each cell as a point in high Euclidean space with one dimension for each gene observed. Second, independent component analysis is used to reduce the dimensionality of this space while preserving essential relationships between cell populations. This is necessary because it is very difficult to visualize and interpret data at high dimensionality. Third, the algorithm constructs a minimum spanning tree (MST) (a tree that connects all the cells using the shortest total length of edges) on the cells. Fourth, the algorithm finds the longest path through the MST, corresponding to the longest sequence of transcriptionally similar cells (this path is referred to as the “backbone” of the tree). Finally, Monocle uses this sequence to produce a differentiation model of an individual cell. In much simpler terms, the algorithm relates cells, represented as points in a Euclidean space, to each other by connecting cells with highly similar transcriptional activity and representing this connection with an edge with units of pseudo-time (greater pseudo-time implies the cells are less transcriptionally related). This is similar to creating a network and characterizing each edge as a strong tie or weak tie. However, the main difference for this algorithm, is that rather than referring to each edge as strong or weak, the algorithm quantifies the strength of each edge. An example of a graph created by Monocle is displayed below:
This study is important particularly because it allows us to understand which genes are most important for different time points in this pseudo-time for the differentiation process.
http://www.nature.com/nbt/journal/v32/n4/full/nbt.2859.html

