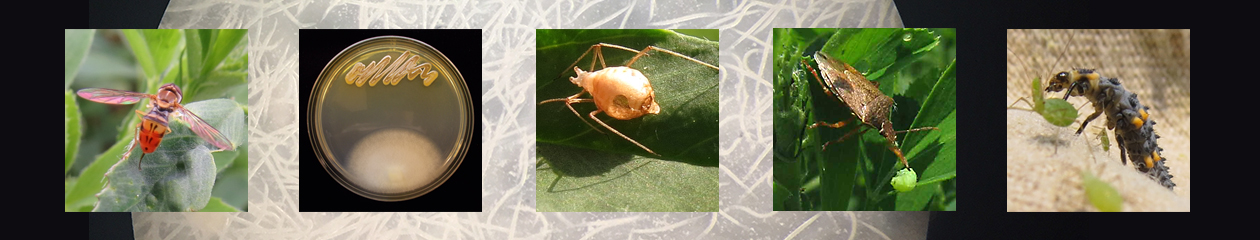
Many crops (and plenty of non-crop plants) rely on pollinators. Let’s protect them!
As I’ve discussed before, the natural enemies that provide biological control of pests include both larger creatures (like insects, mites, and nematodes) and microorganisms (fungi, bacteria, and viruses) that combat pests in a variety of ways. Microorganism natural enemies are regulated as pesticides (one type of biopesticide), while the larger natural enemies are not. Growers who are successfully using biocontrol insects, mites, and nematodes usually recognize that they need to apply pesticides in such a way that they are compatible with the biocontrol organisms they use. Take a look at my April post for a summary of online resources that can help you check compatibility of pesticides (including biopesticides) with natural enemies.
Some of these compatibility resources include information on the effects of pesticides (and biopesticides) on bees. Pollinators (including honey bees, lots of other bees, and some non-bees) are very important beneficial insects. You may have noticed that they have found their way into several of my blog posts. So, I wanted to let you know about a brand new resource (hot off the digital presses) to help you protect pollinators.
“A Pesticide Decision-Making Guide to Protect Pollinators in Tree Fruit Orchards” is a terrific resource to help you choose pesticides (and pesticide combinations) that are least-toxic to bees.
“A Pesticide Decision-Making Guide to Protect Pollinators in Tree Fruit Orchards” was written by Maria van Dyke, Emma Mullen, Dan Wixted, and Scott McArt. Although it’s focus is tree fruit orchards (and therefore the pesticides used in them), it should be useful for growers of other crops who want to choose pesticides that are least toxic to bees. A few highlights:
It includes information not only on pesticides used alone, but (when available) on synergistic effects when multiple pesticide active ingredients are used together. When you combine some chemicals (either in the tank or in the environment) the mixture is more toxic than both chemicals alone.
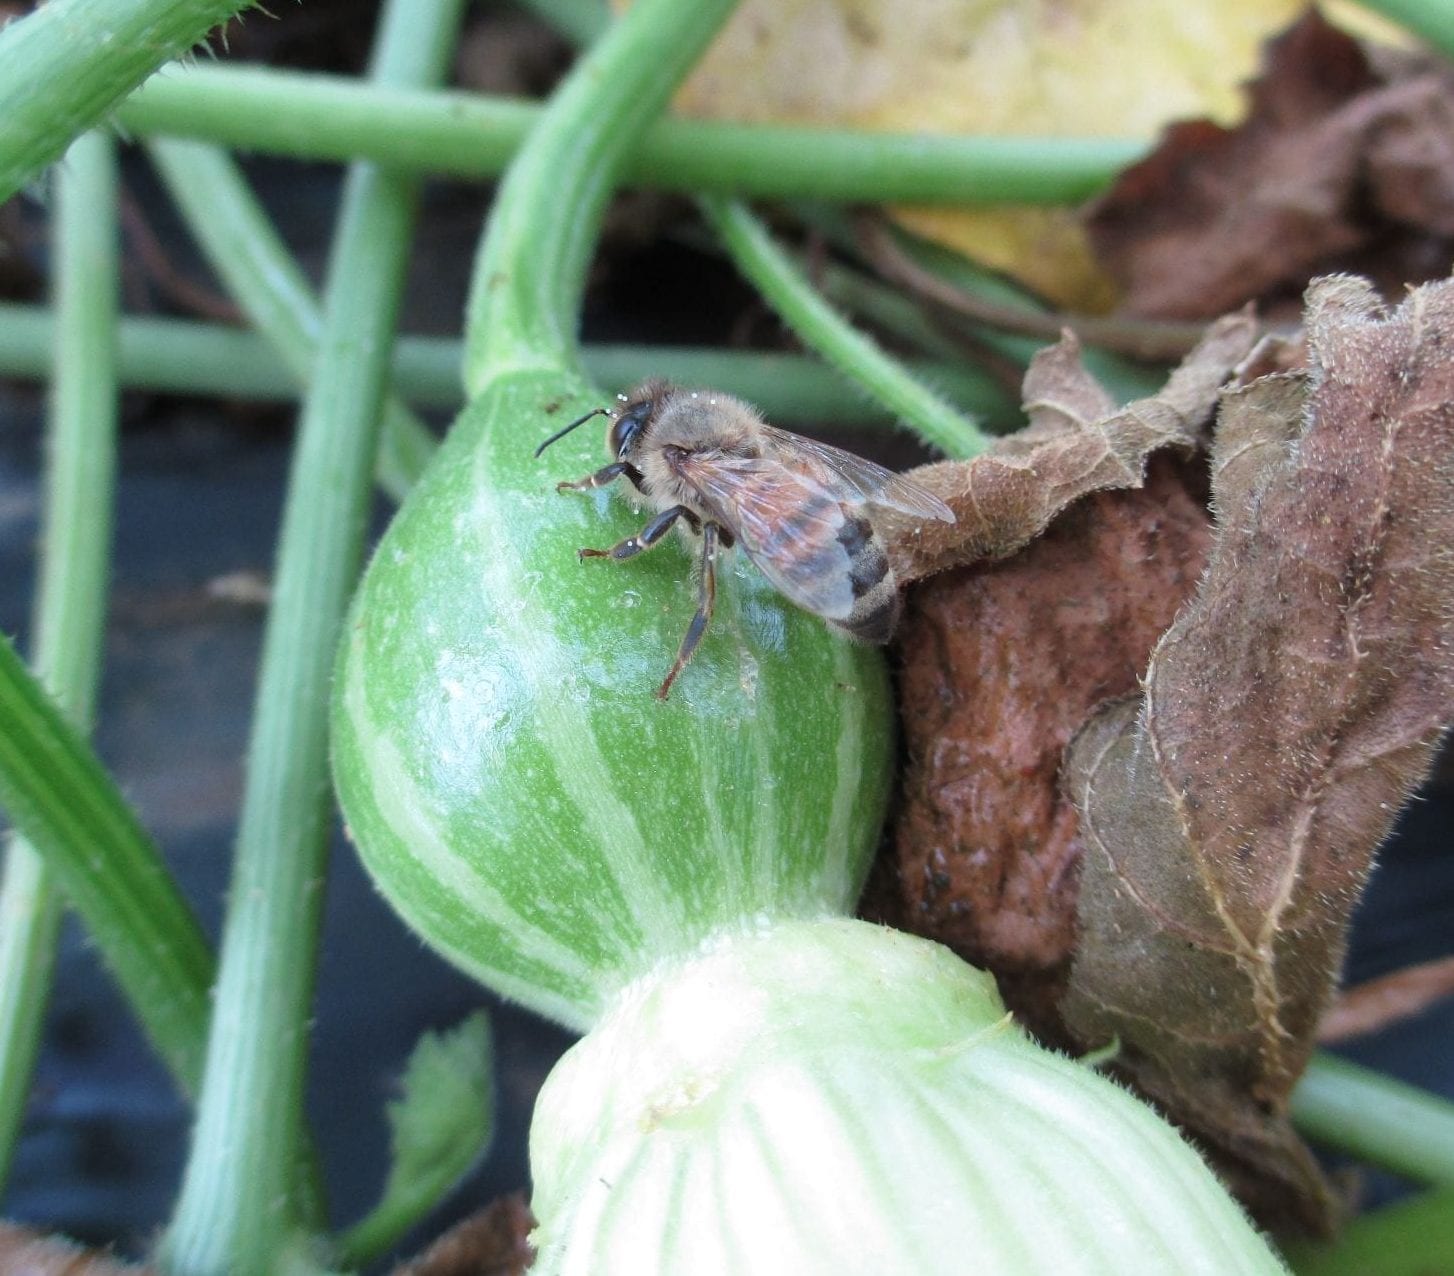
Where available, it summarizes pesticide toxicity to other bees besides just honey bees (e.g., bumble bees and solitary bees). You can read more about why this is important in this recent article.
It describes what we know about sub-lethal (in other words, negative effects on the bees that are less serious than death) effects of pesticides on bees.
It includes about half a dozen biopesticide active ingredients.
Pollination is being done by more than just honey bees! This bumble bee (plus many more bee species) are important pollinators in NY.
Guides for other crops and other resources for growers wanting to protect pollinators can be found here.
You might be asking: If a chemical on this table is toxic to bees, will it also be toxic to the insect and mite natural enemies I am releasing or conserving on my farm or in my garden? I wish I had a definitive answer to that. As you can see from the nearly three pages of Literature Cited at the end of this document, collecting these data is a time-consuming process. For now, stick with the compatibility resources that are already available, and ask the companies you buy from (pesticides or natural enemies) about compatibility.
In closing, a huge amount of work went into this resource to summarize so much useful and current (as of October 2018) information in an easy-to-read table. Bravo to the authors! The Pollinator Network @ Cornell has other helpful resources for growers on protecting pollinators. Winter is a great time to make plans for using IPM and protecting the pollinators and natural enemies that are so good for the crops we grow!
Fair warning, this is going to be a longer post. But partly that’s because there are so many pictures. I will start with the overview, then go a bit deeper into the weeds (literally and figuratively). To help you navigate more quickly, here’s a sort of table of contents that will quickly take you to the information you may be most interested to read:
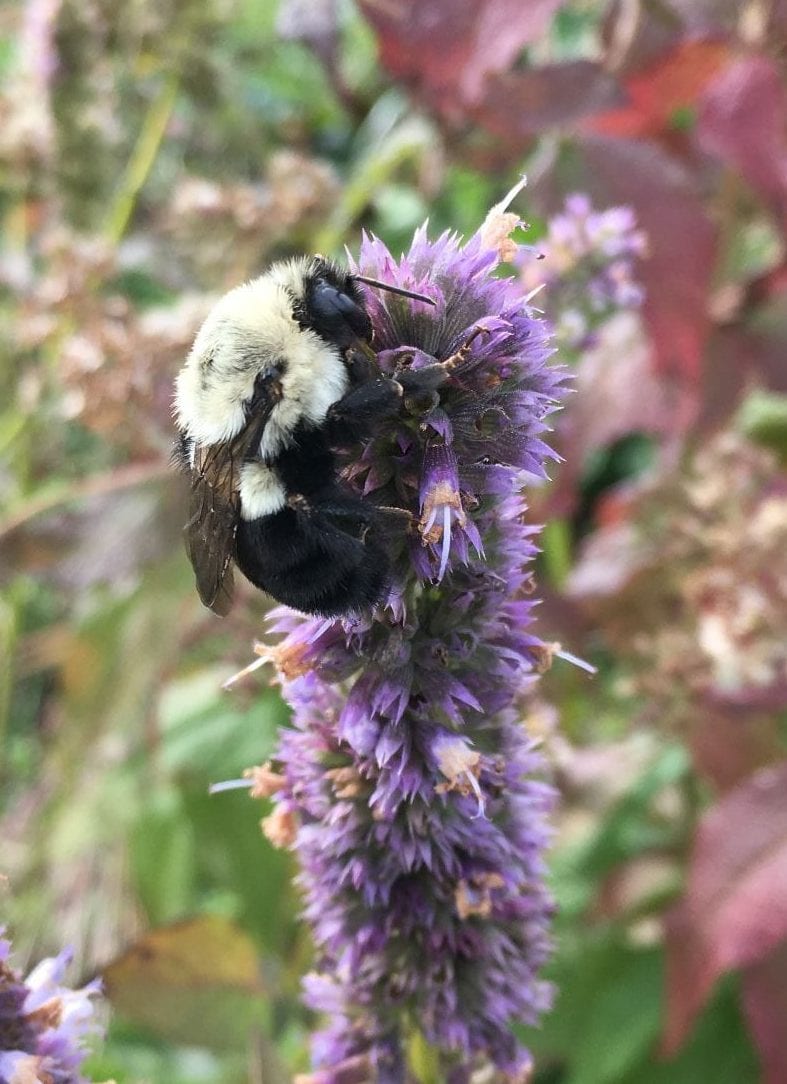
Some of our beneficial insect habitat plots looked really beautiful this fall! Others are still works in progress.
Overview
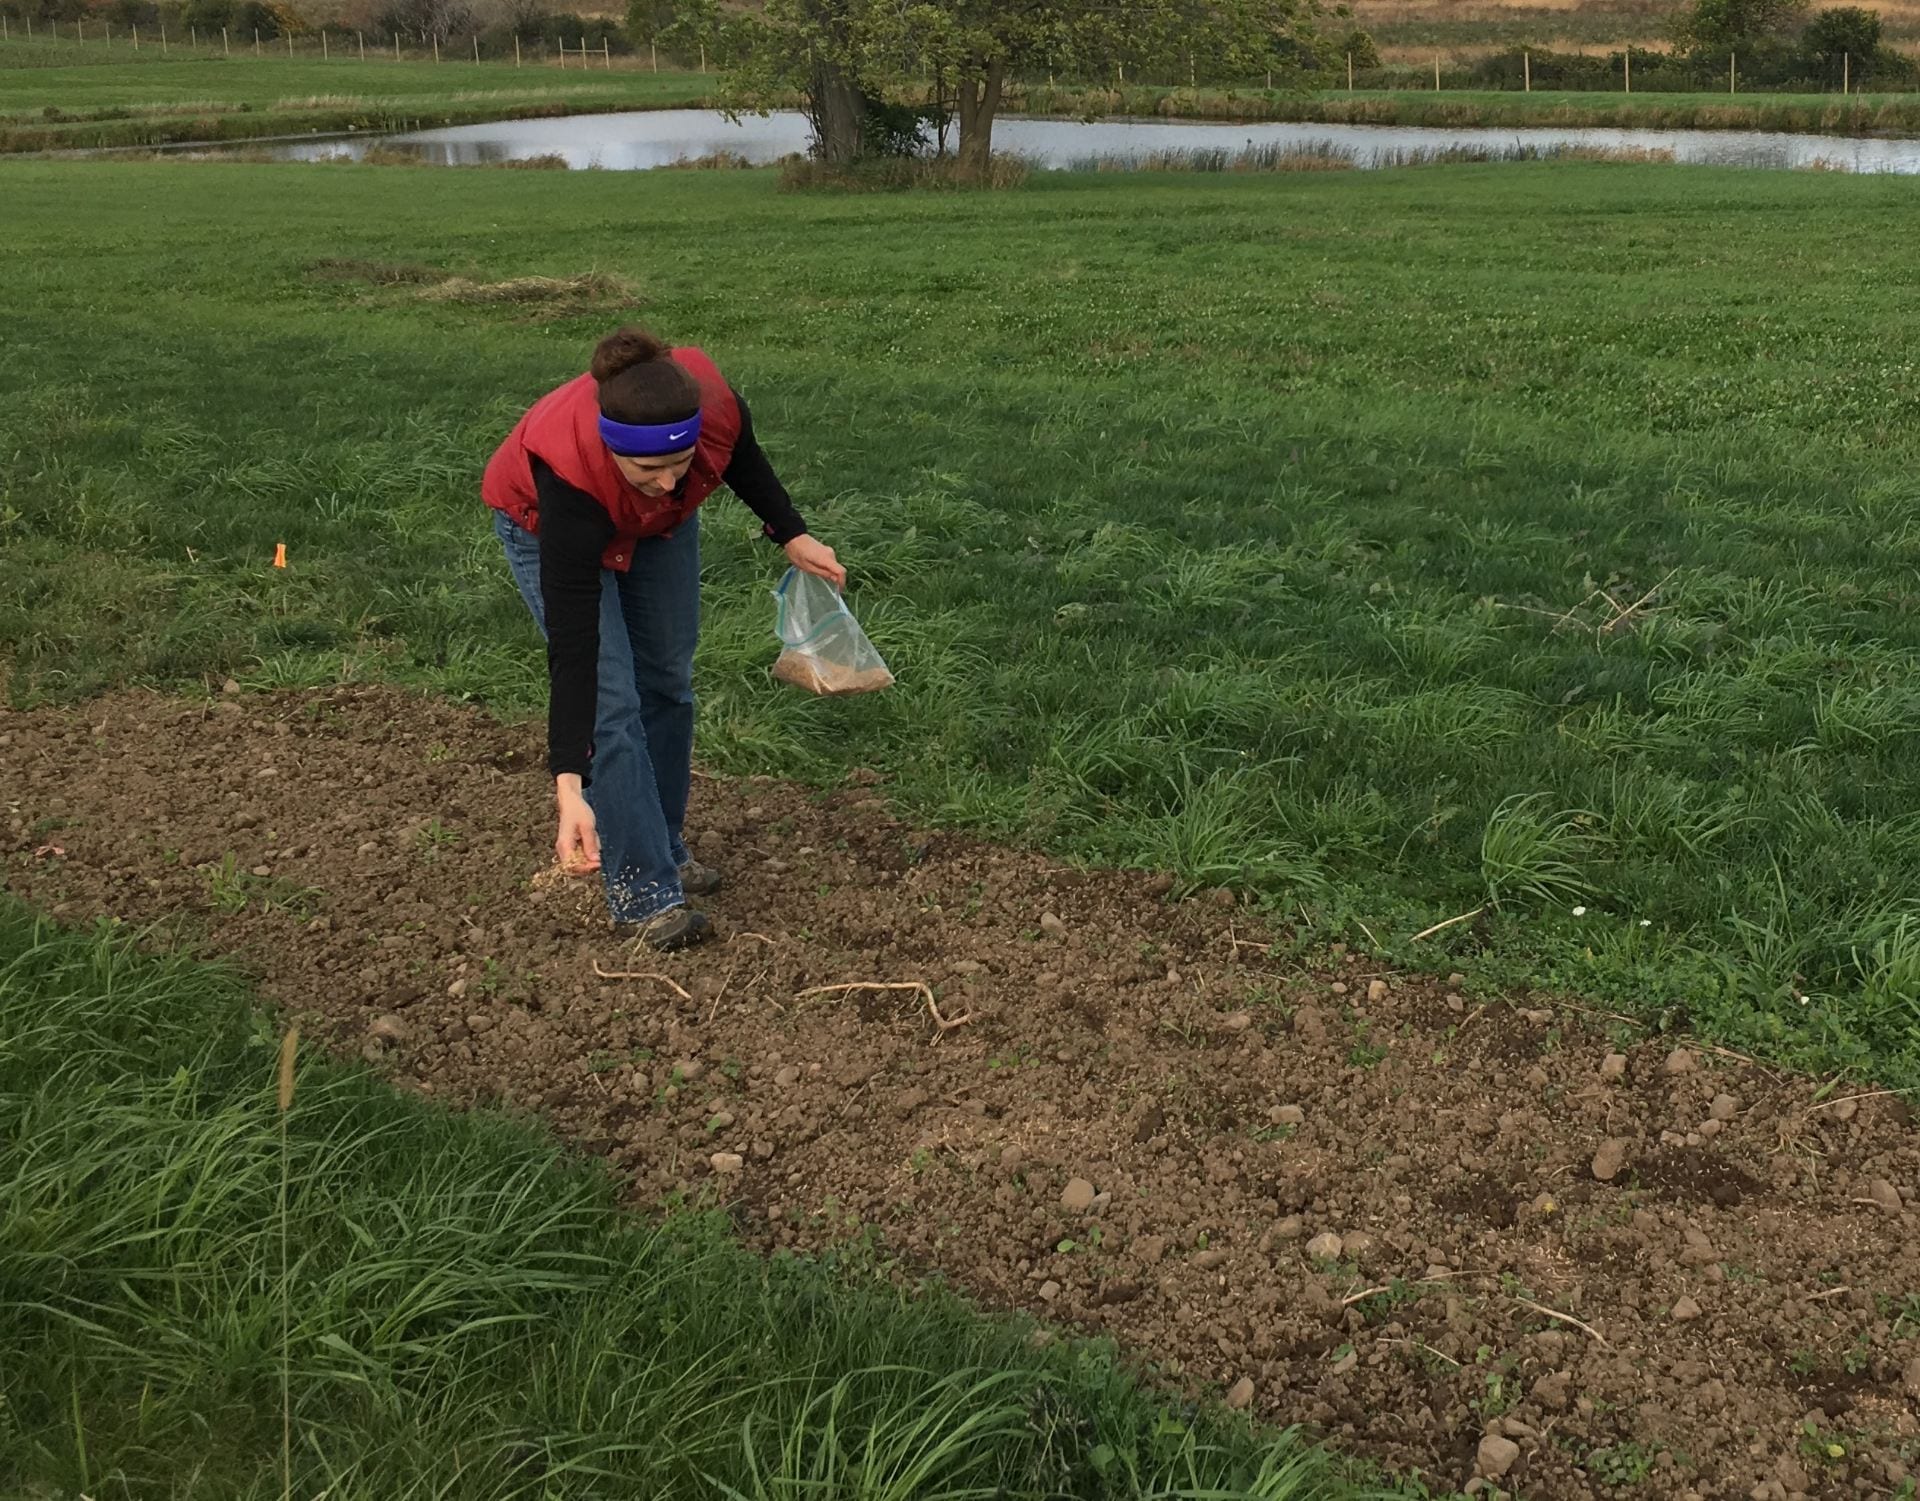
Remember back in June when I told you about the different techniques we were comparing for establishing habitat for beneficial insects? Time for an update! Here’s a brief, two-page summary of the first year of this project. For all the juicy details (and lots of pictures), keep reading!
First, remember that when I say “beneficial insects”, I mean both pollinators and natural enemies of pests. (Technically, arthropod would be a better term than insect, because spiders and predatory mites are some of the beneficial creatures we’d like to attract.) Fortunately, the same type of plants provide food and shelter for both pollinators and natural enemies on your farm or in your garden.
We used six different techniques to establish this habitat during Spring, Summer, and Fall of 2018. Treatment E was our control, where we did nothing but mow (after initial herbicide applications).
Treatment
Fall 2017
Spring 2018
Summer 2018
Fall 2018
A
Herbicide
Herbicide, transplant
Weed 2x
Replace dead plants
B
Herbicide
Till, transplant, mulch
Weed 2x
Replace dead plants
C
Herbicide
Till, direct seed
Mow 3x
Mow 1x
D
Herbicide
Till, plant buckwheat
Mow 1x, till, plant buckwheat
Mow 1x, transplant
E – control
Herbicide
Herbicide
Mow 3x
Mow 1x
F
Herbicide
Till, lay plastic
Continue solarization
Remove plastic, direct seed
G
Herbicide
Herbicide/till
Herbicide 2x, till 1x
Till 1x, direct seed
We transplanted the following species in treatments A, B, and D:
Common name
Scientific name
Number of plants in each 5 x 23 ft plot
Anise hyssop
Agastache foeniculum
2
Common milkweed
Asclepias syriaca
3
Blue false indigo
Baptisia australis
2
Lanced-leaved coreopsis
Coreopsis lanceolata
3
Purple coneflower
Echinacea purpurea
2
Boneset
Eupatorium perfoliatum
3
Wild bergamot
Monarda fistulosa
2
Catmint
Nepeta faassinii
2
Tall white beard tongue
Penstemon digitalis
3
Black-eyed Susan
Rudbeckia fulgida va. Fulgida
1
Little bluestem (grass)
Schizachyrium scoparium
11
Showy goldenrod
Solidago speciosa
1
New England aster
Symphyotrichum novae- angliae
3
Ohio spiderwort
Tradescantia ohiensis
2
NY ironweed
Vernonia noveboracensis
2
Golden alexanders
Zizia aurea
3
We planted seeds in treatments C, F, and G. The seed mixture we used was the Showy Northeast Native Wildflower & Grass Mix from Ernst Seeds, which included a more diverse species mix. This mix changes a bit from year to year. If you’re interested, you can learn about the details of the specific mix we used here.
Labor and costs
Not surprisingly, there were big differences in how much time and money we spent on different treatments this first year. The costs and hours below are for a total area of 460 ft2 (0.01 A) per treatment. Most of the cost differences are due to the huge difference in seed versus transplant expenses. We paid about $2 per plant and needed 180 plants for each treatment. In contrast, we spent about $12.50 on seed for each treatment. You can find itemized lists of cost and time inputs for each treatment here.
Treatment
Supply costs
Time (person hrs)
A – spring transplant
$417.12
13.2
B – spring transplant & mulch
$539.29
20.4
C – spring seed
$17.75
4.4
D – buckwheat & fall seed
$390.55
10.3
E – control
$2.32
2.6
F – solarize & fall seed
$148.02
10.2
G – herbicide/tillage & fall seed
$22.04
6.3
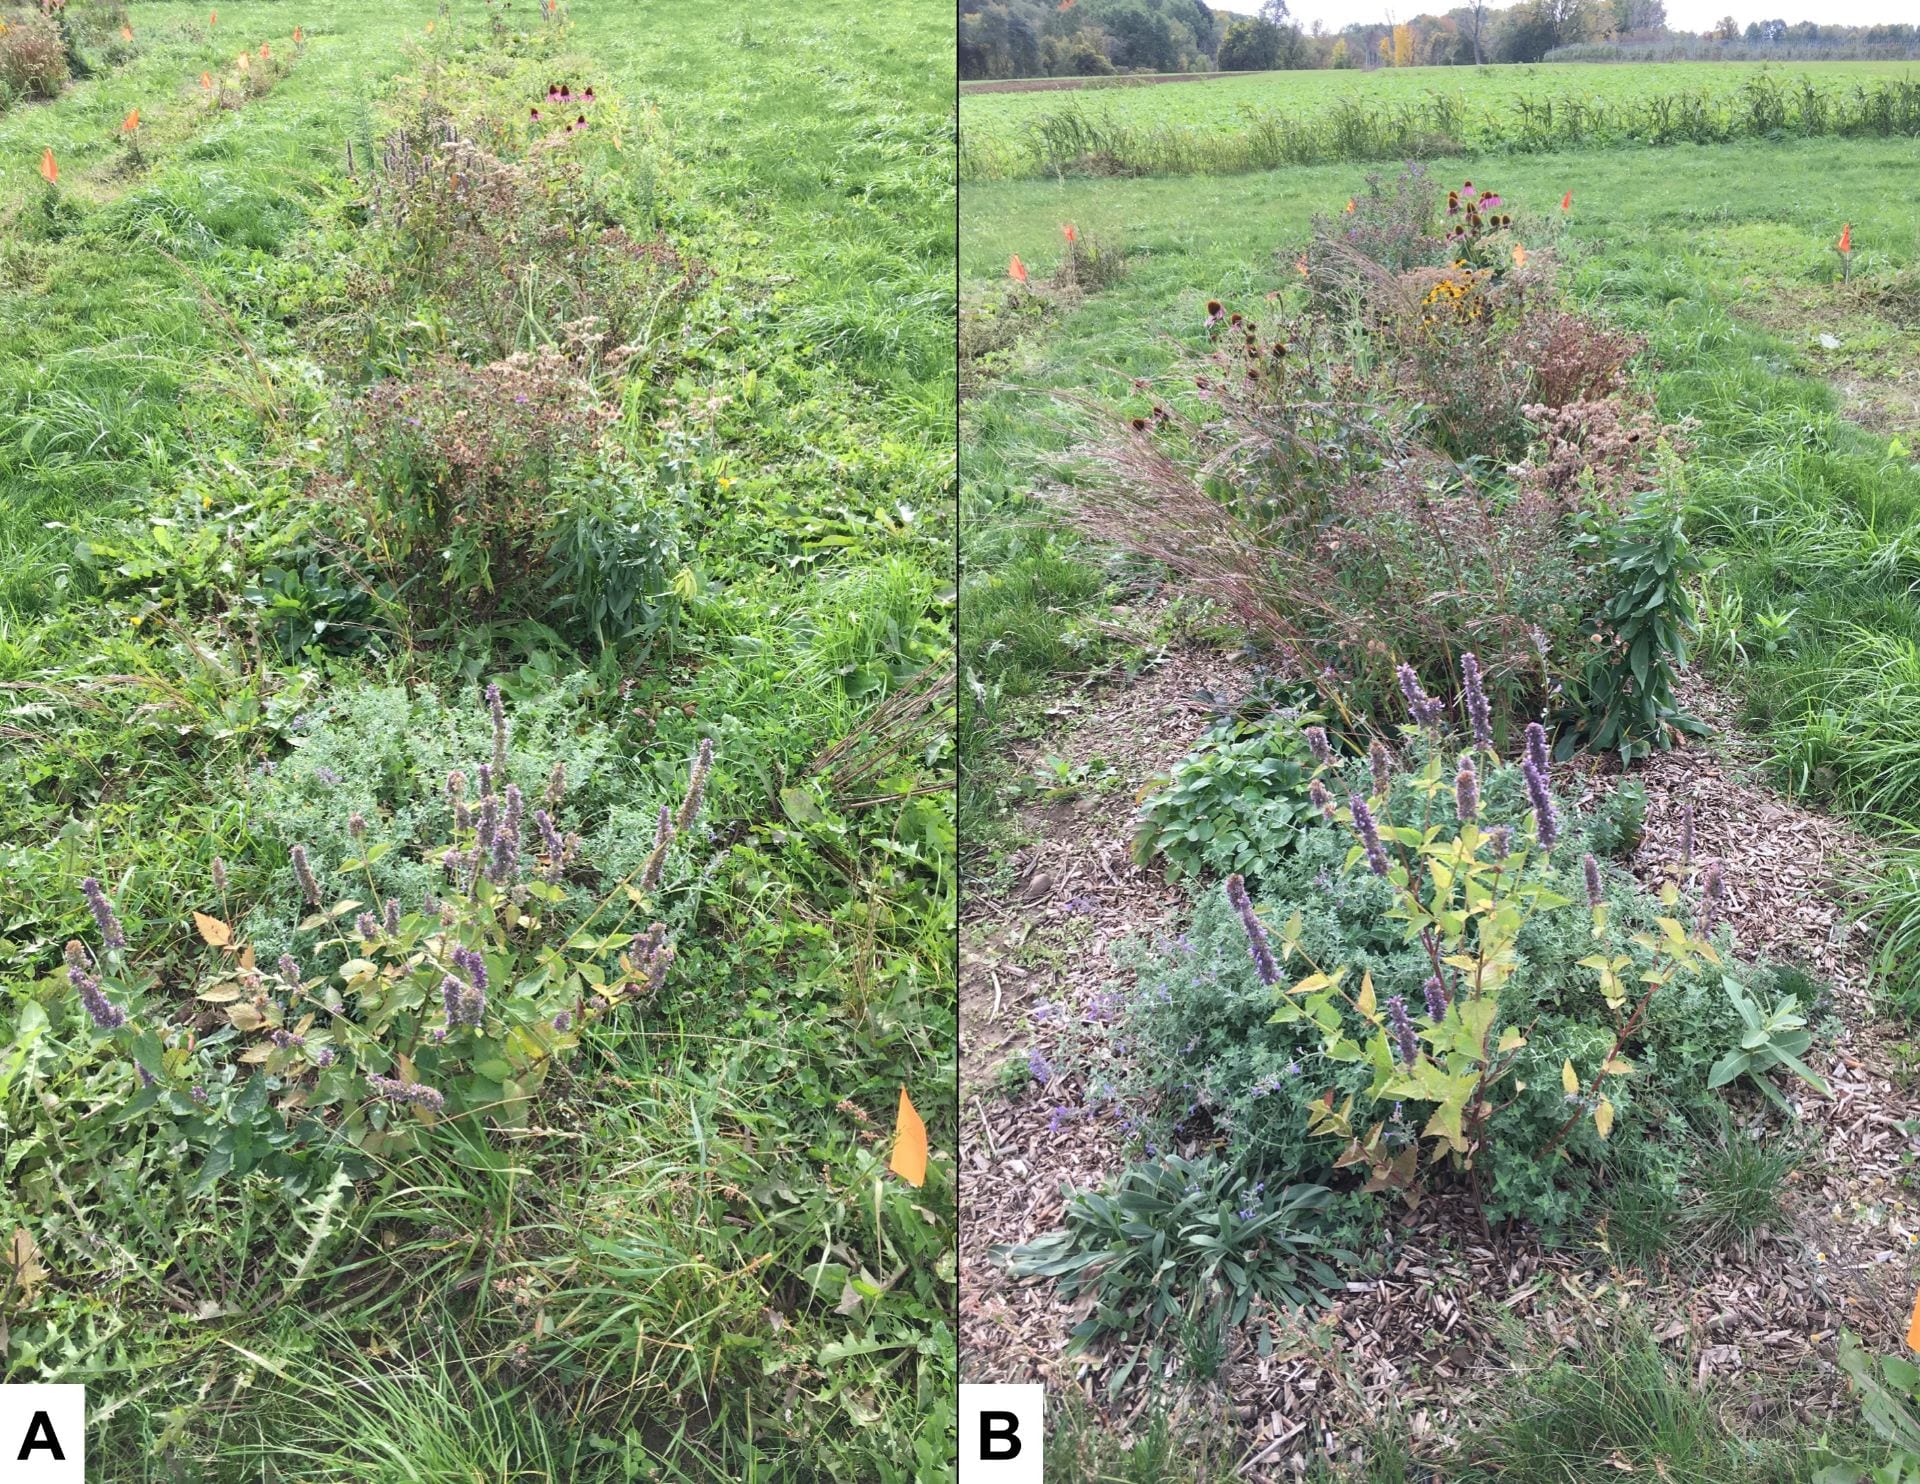
But, there were also big differences in how quickly the plants established. By September, both treatments (A and B) that had been transplanted in the spring looked like well-established gardens, with large, blooming wildflowers.
Four and a half months after transplanting, the beneficial habitat plants in treatments A (left) and B (right) were mostly growing well. But there was a big difference in weed control, in spite of similar amounts of time spent weeding each treatment.
We were generally pleased by how well most of the spring transplants survived. Although all the transplants came in 50-cell flats, some were larger than others, and the larger transplants survived better. We were fortunate to be able to plant into nice moist ground, so except for a little water on the day of transplanting, we didn’t irrigate. Survival might not have been as good if we’d had different planting conditions.
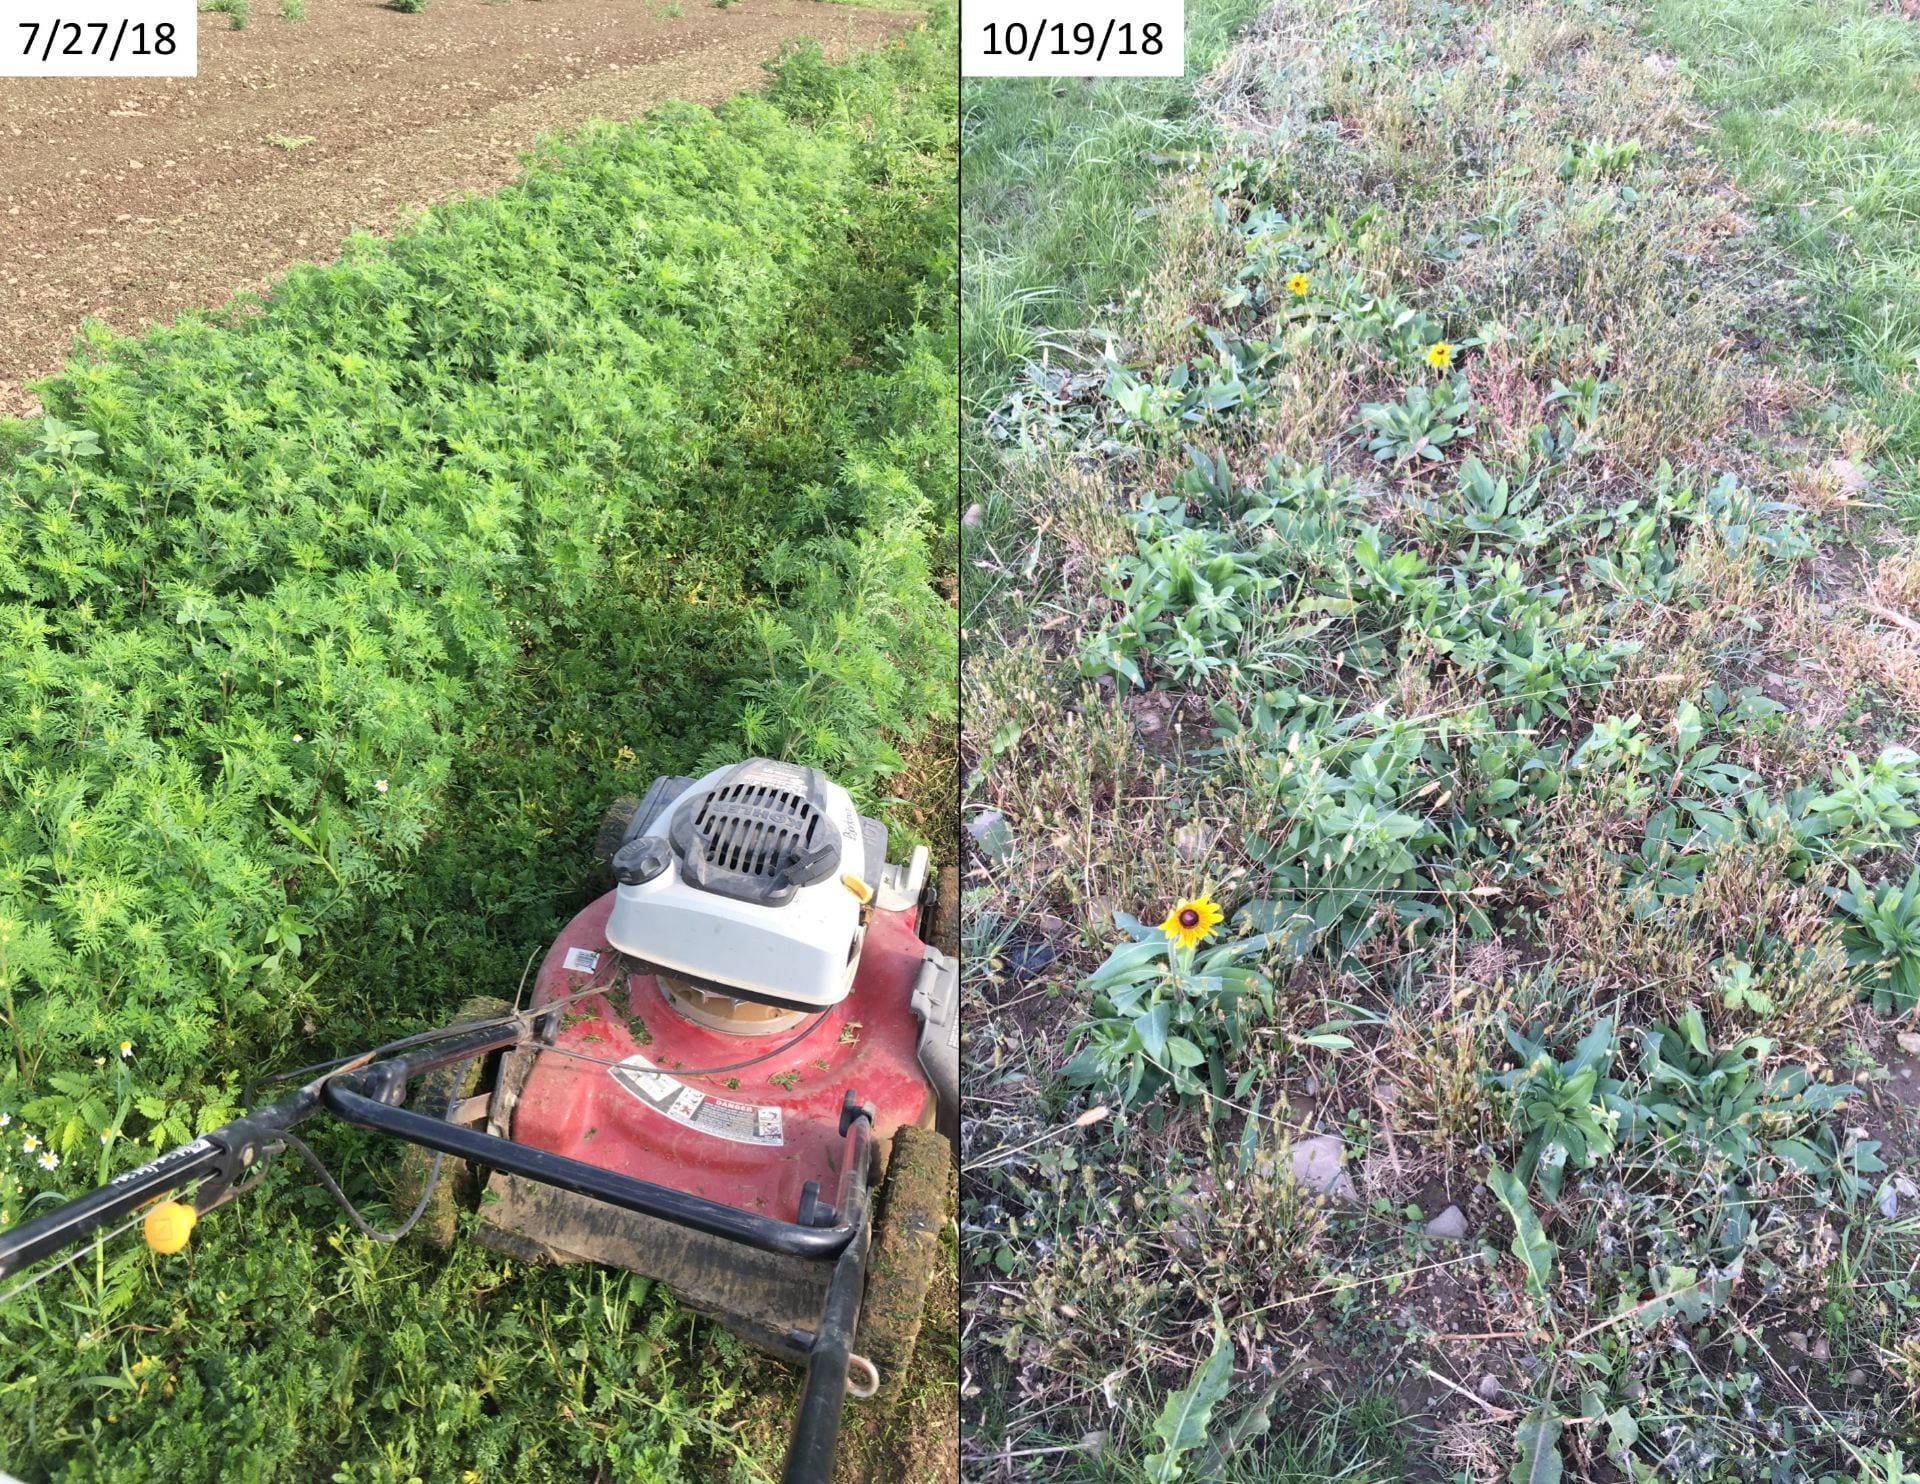
In contrast, the much less expensive treatment C was not looking too impressive even by October. A few partridge peas and blackeyed Susans bloomed this year, but otherwise it didn’t look much different from the control plots. In mid-summer, it looked like we were growing more ragweed than wildflowers.
In late July, it looked like we were growing mostly ragweed in treatment C (left). But after mowing four times during the summer and fall, you could definitely see the blackeyed Susans establishing (right).
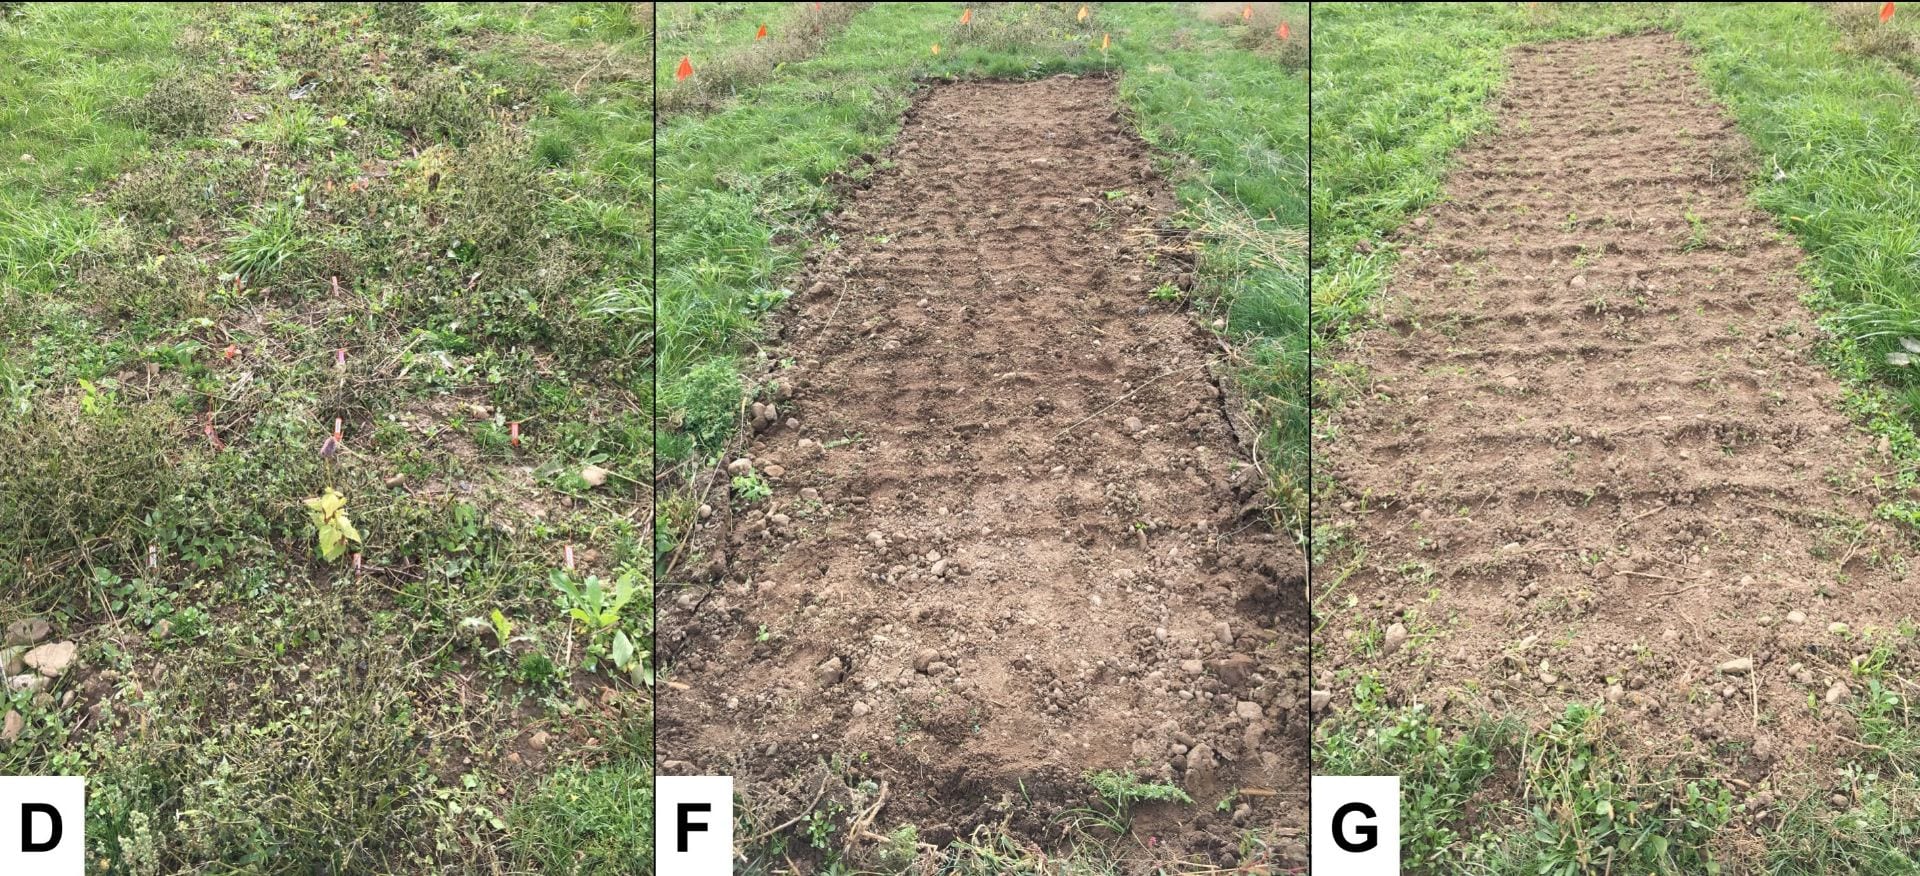
Two of the treatments (F and G) were planted with seeds this fall, and one treatment (D) was transplanted this fall. So it’s really too early to tell how successful those treatments were. Stay tuned for more updates!
Fall transplanted (D) or direct seeded treatments (F and G) did not look very impressive by October 19, 2018. I’m curious to see what they look like next spring, summer, and fall!
Details on weed control
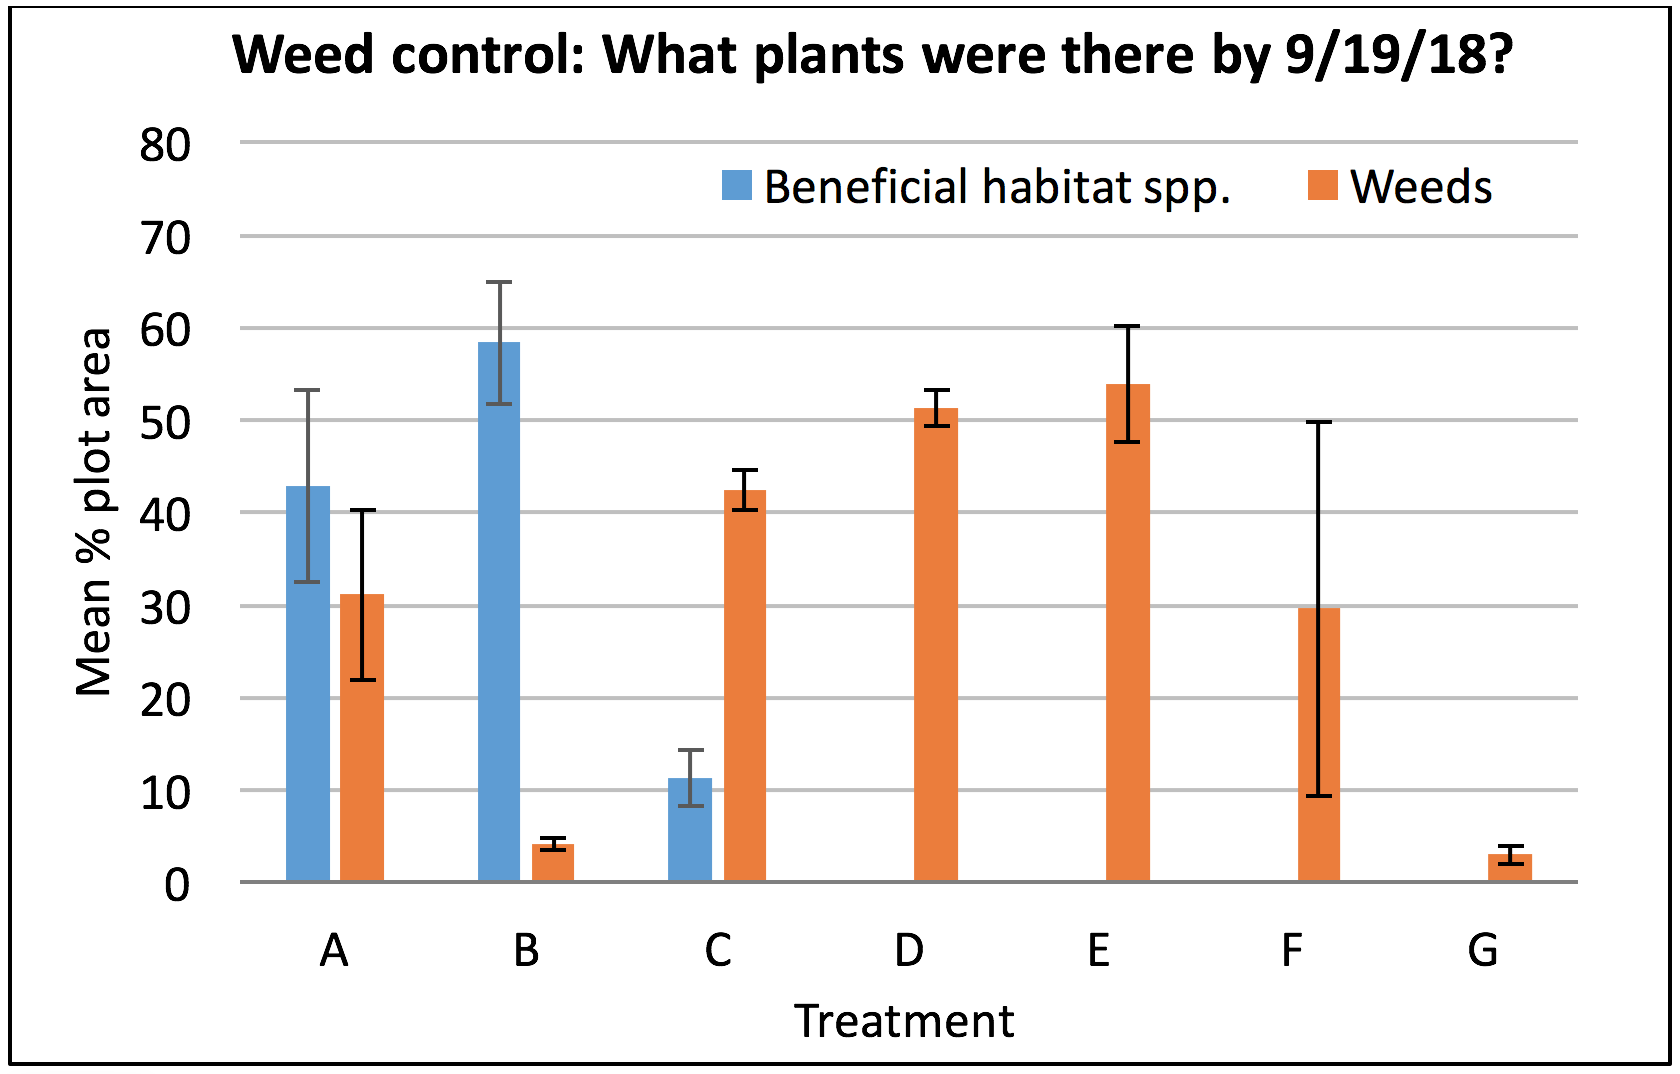
What about weeds? The graph below shows the average percent of the surface area of each plot that was covered with weeds versus planted beneficial habitat species on September 19, 2018. (Thank you, Bryan Brown, NYS IPM Integrated Weed Management Specialist for doing a weed assessment for us!) While we spent about the same amount of time weeding treatments A and B (the time difference is due to the time spent mulching treatment B), we achieved much better weed control with the mulch than without it!
Bryan Brown assessed the percent of each plot that was covered with either the beneficial habitat species we had planted (blue) or weeds (orange). Each bar represents the average of four plots for each treatment, and the error bars show the standard error.
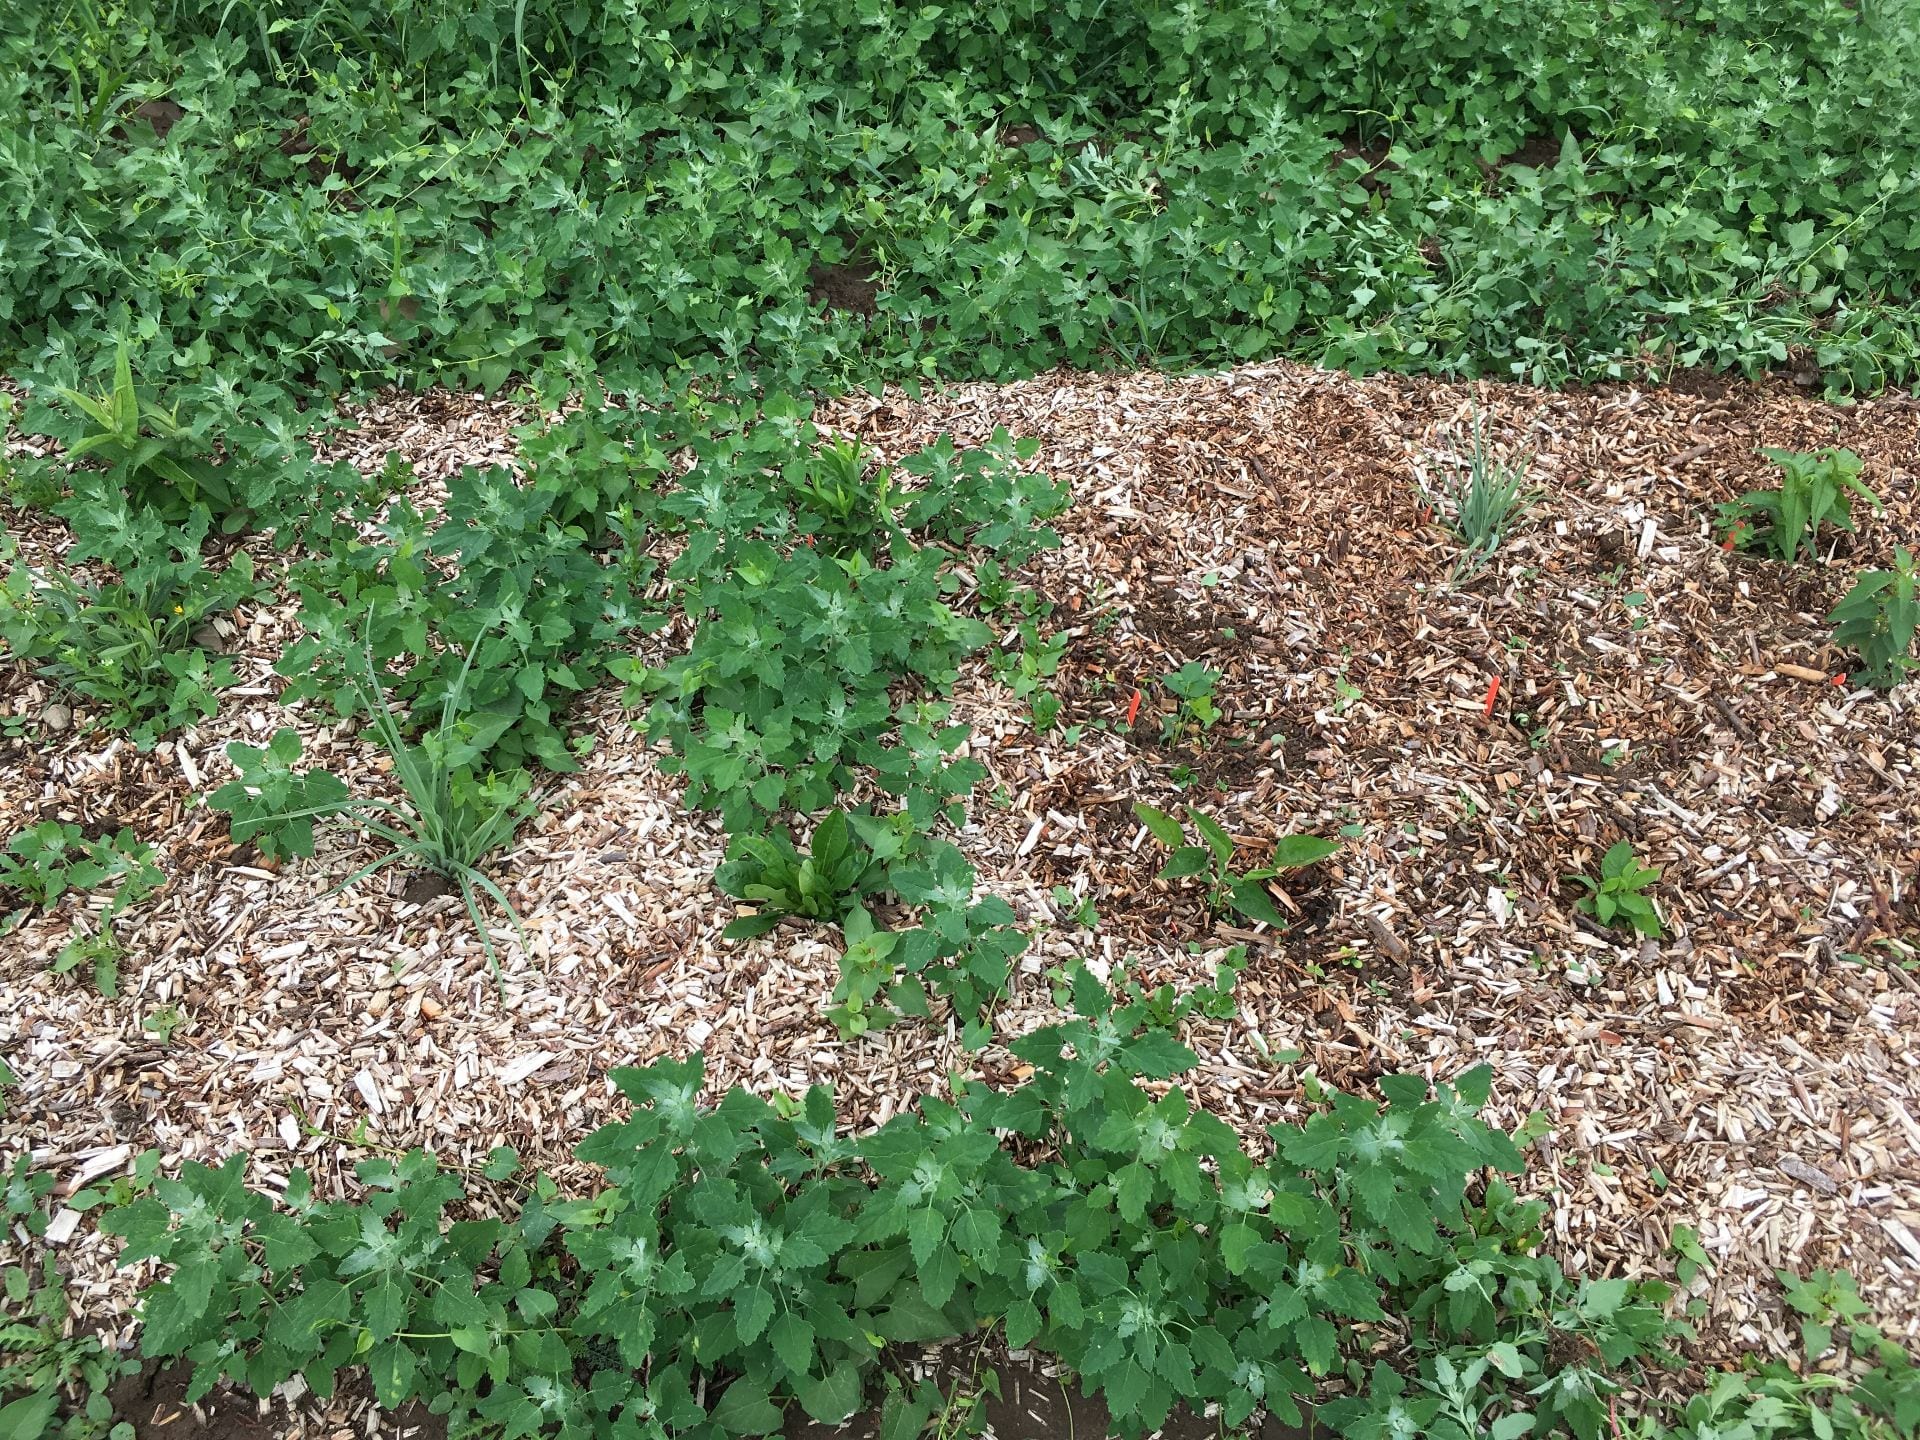
In treatment B, we spread chipped shrub willow mulch about 3 inches deep around the transplants. If I were to do this again, I would spread it thicker. I was disappointed with how many weeds were growing through the mulch just a month after transplanting.
The chipped shrub willow mulch we used was not as effective at suppressing weeds as I had hoped. On the left is part of the plot that had not been weeded yet. On the right is the part that was weeded on July 6. You can also see from this picture that there was a lot of lambsquarters in this field, and that we hadn’t been able to seed grass between the plots, yet.
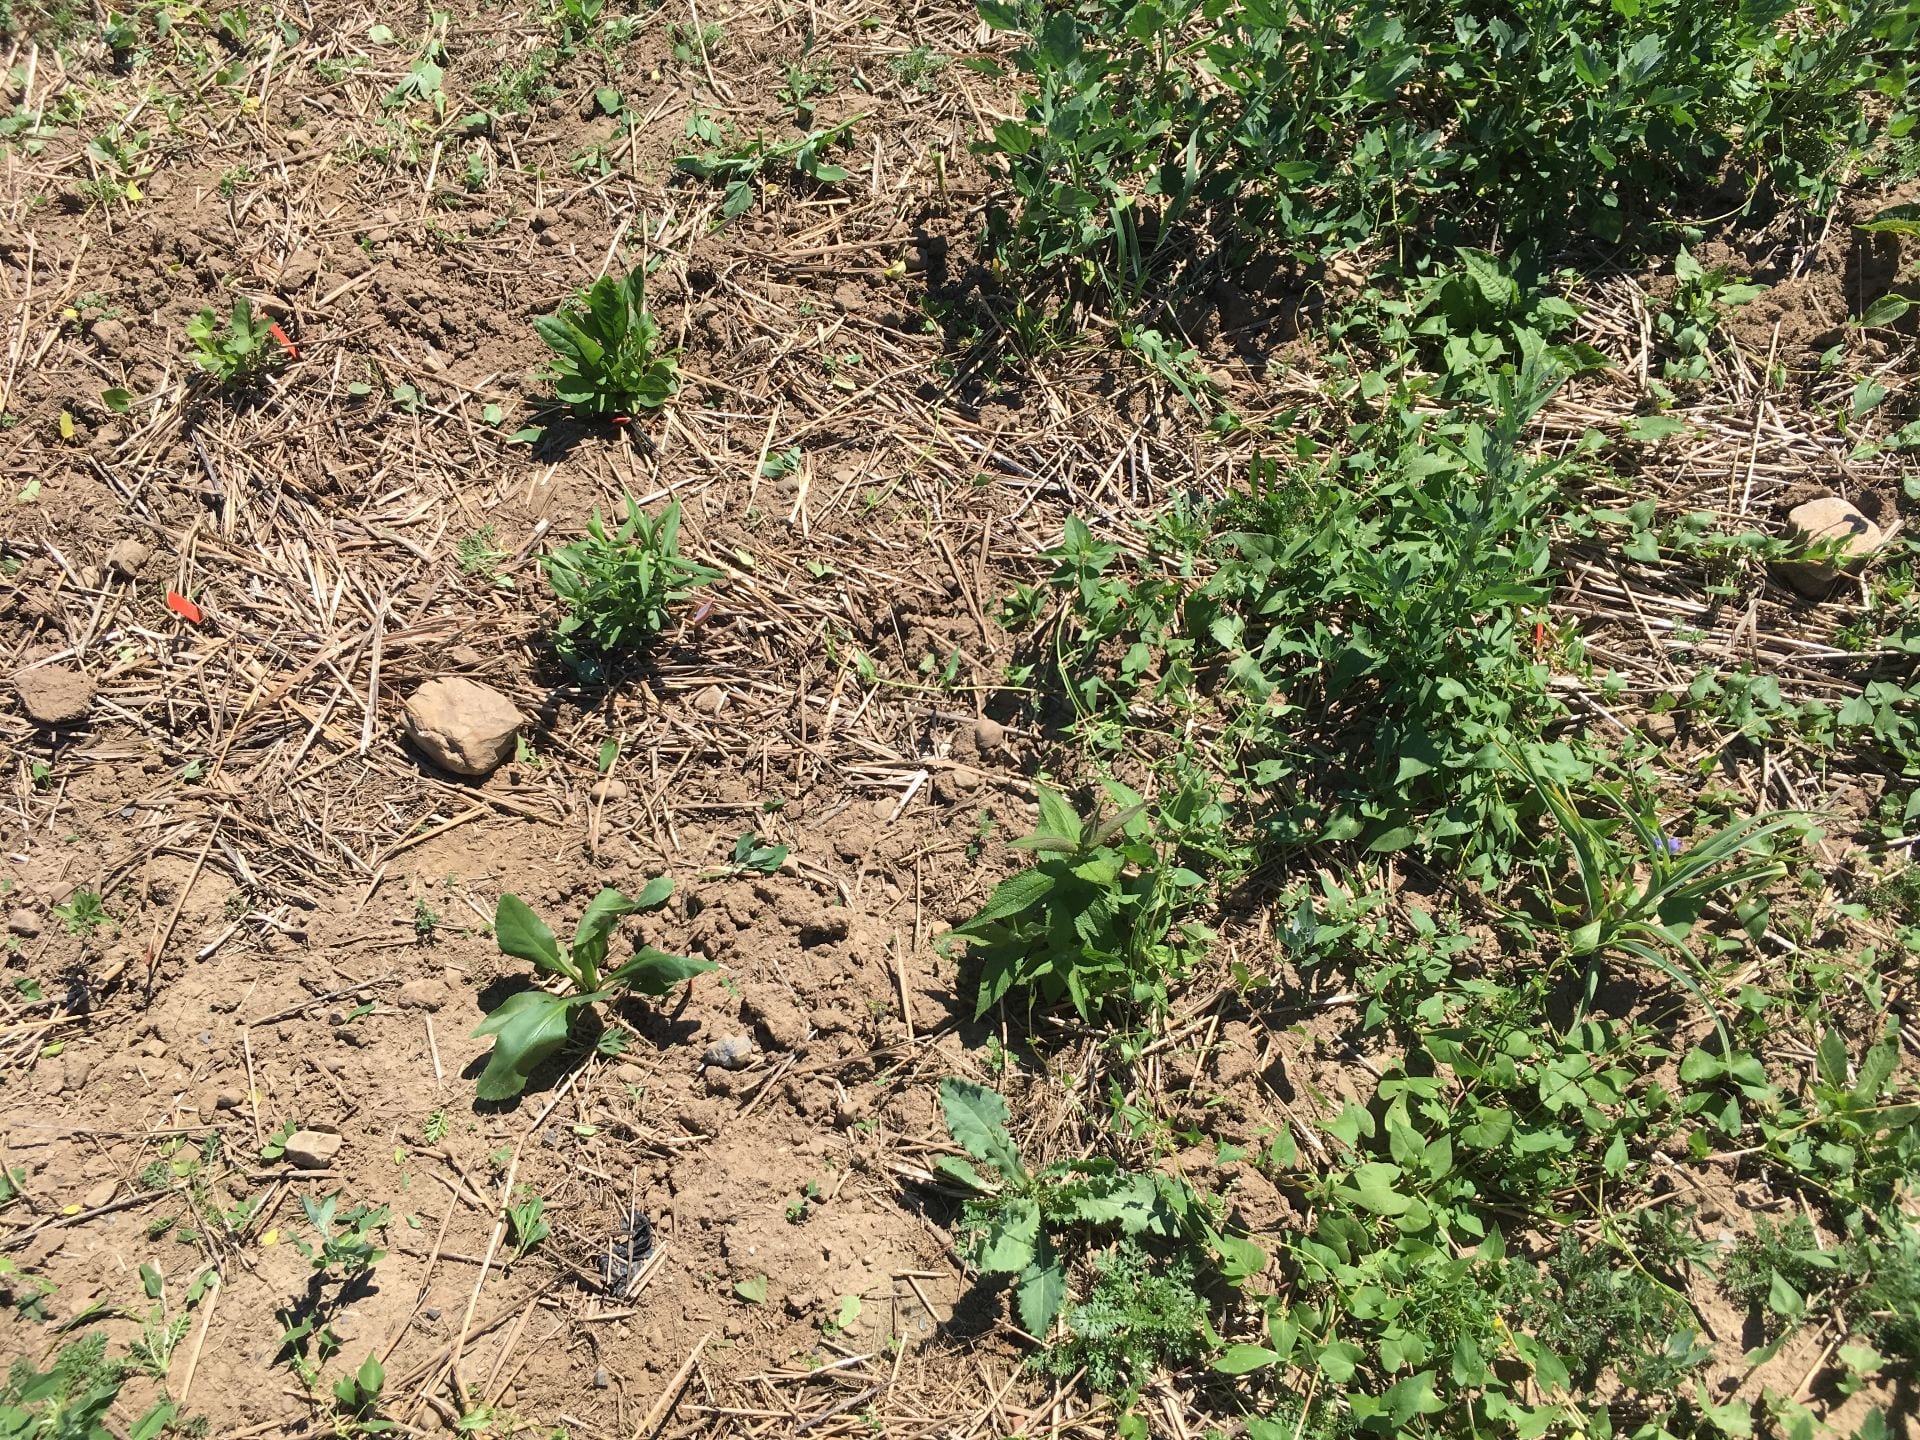
But weeding twice during the season pretty much took care of the weeds in treatment B. Treatment A was also weeded twice, but as you saw in the graph earlier, weed control by the end of the season was not as effective.
Treatment A (transplanted in the spring, with no additional weed control) before (right) and after (left) hand weeding on July 6.
I think we’ll have to wait until next year to really understand how weed control is working in treatment C. Remember, the strategy was to slowly deplete the annual weed seedbank by allowing weeds to germinate, but preventing them from producing more seed. This is not supposed to be a quick establishment method, and it wasn’t.
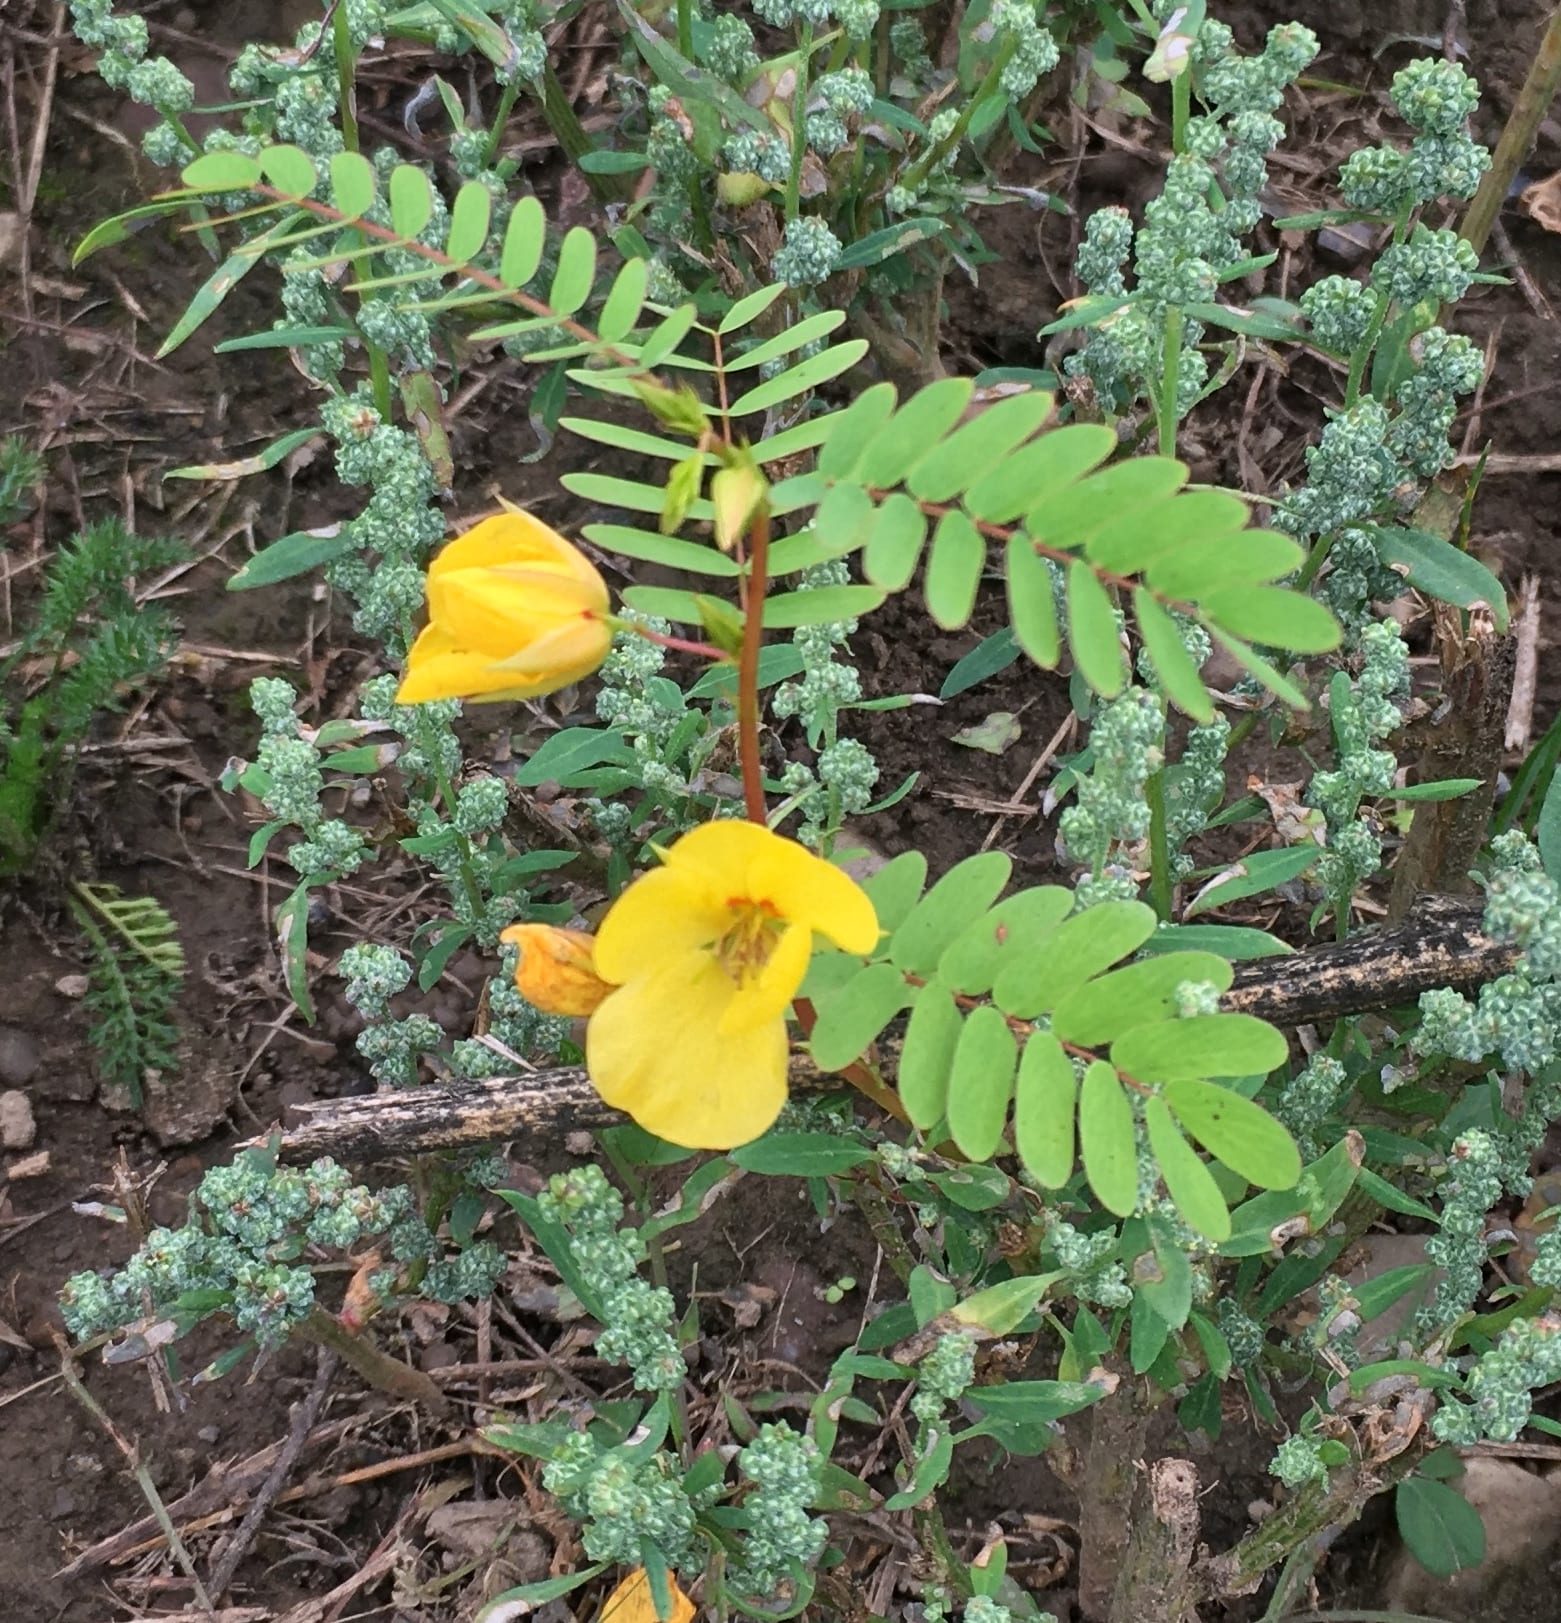
This is what partridge pea looks like. It was one of the few species from the native wildflower and grass mix seeded in the spring (treatment C) that bloomed during this first growing season.
Buckwheat as a weed-smothering cover crop
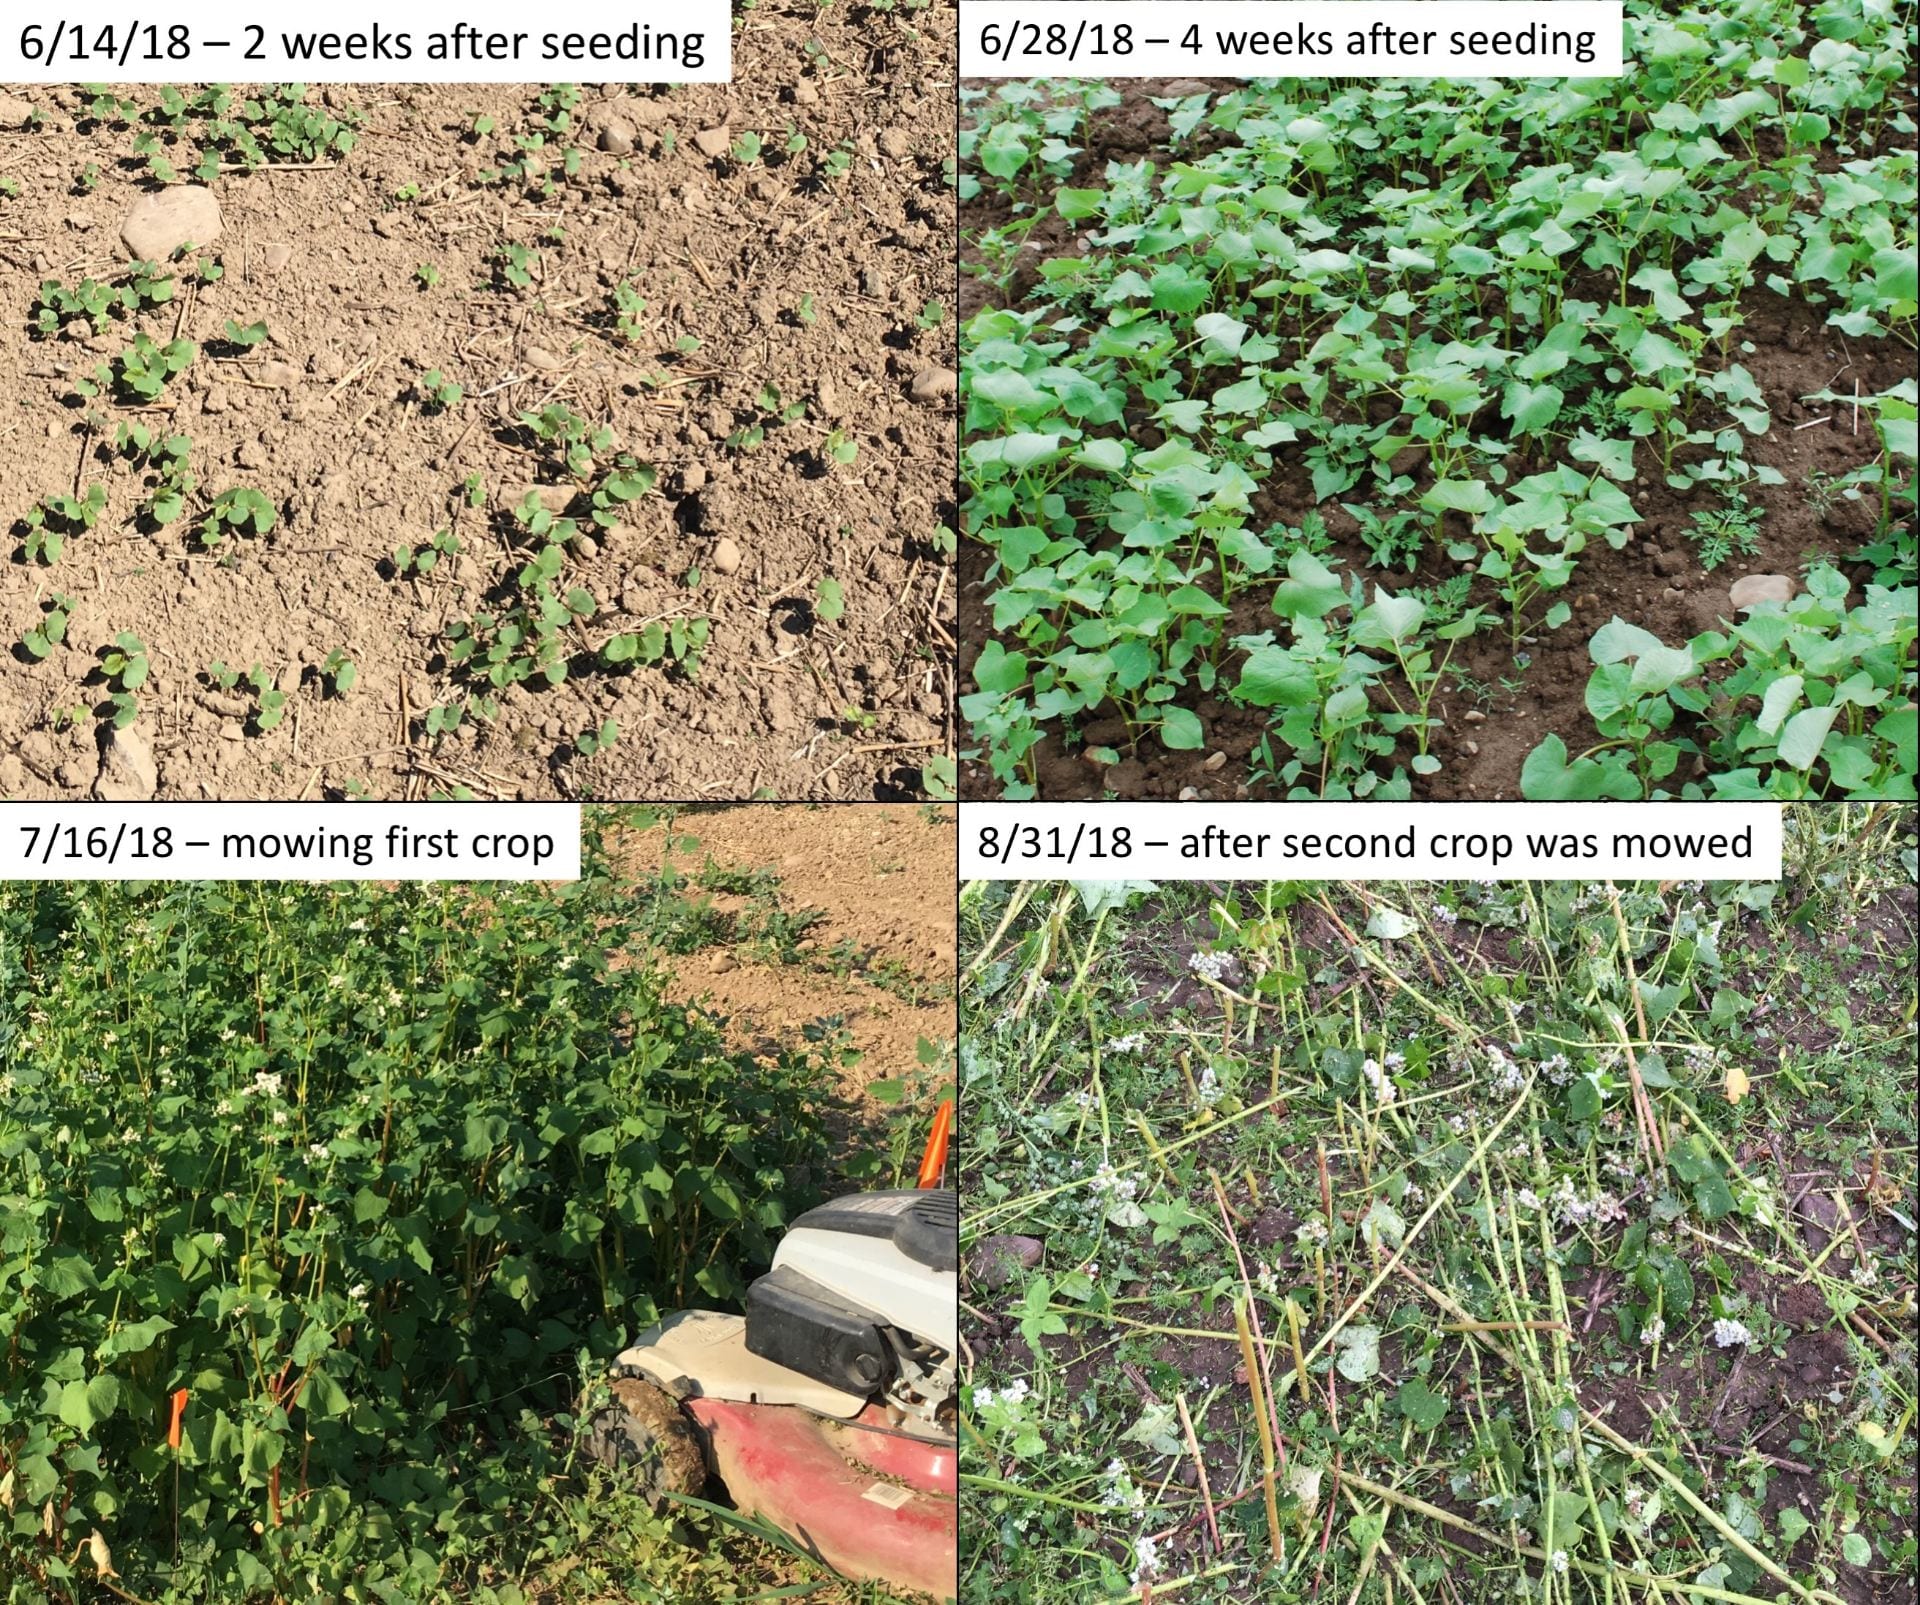
By the time Bryan did our weed assessment, it had been 3 weeks since we mowed the second planting of buckwheat. Ideally, we would have transplanted shortly after mowing the buckwheat. But, the second crop of buckwheat was starting to set seed by the end of August, and our transplants weren’t scheduled to arrive until the end of September. So we mowed the buckwheat early to prevent it from contributing its own seed to the weed seedbank. But this meant that a lot of weeds had time to germinate before we transplanted the habitat plants. The buckwheat certainly suppressed a lot of weeds during the growing season, and I hope that this will help reduce weeds next year.
The buckwheat established quickly and crowded out many weeds. We mowed the first crop in July and re-planted. We had to mow the second crop about 3 weeks before we transplanted habitat plants (not ideal).
Solarization
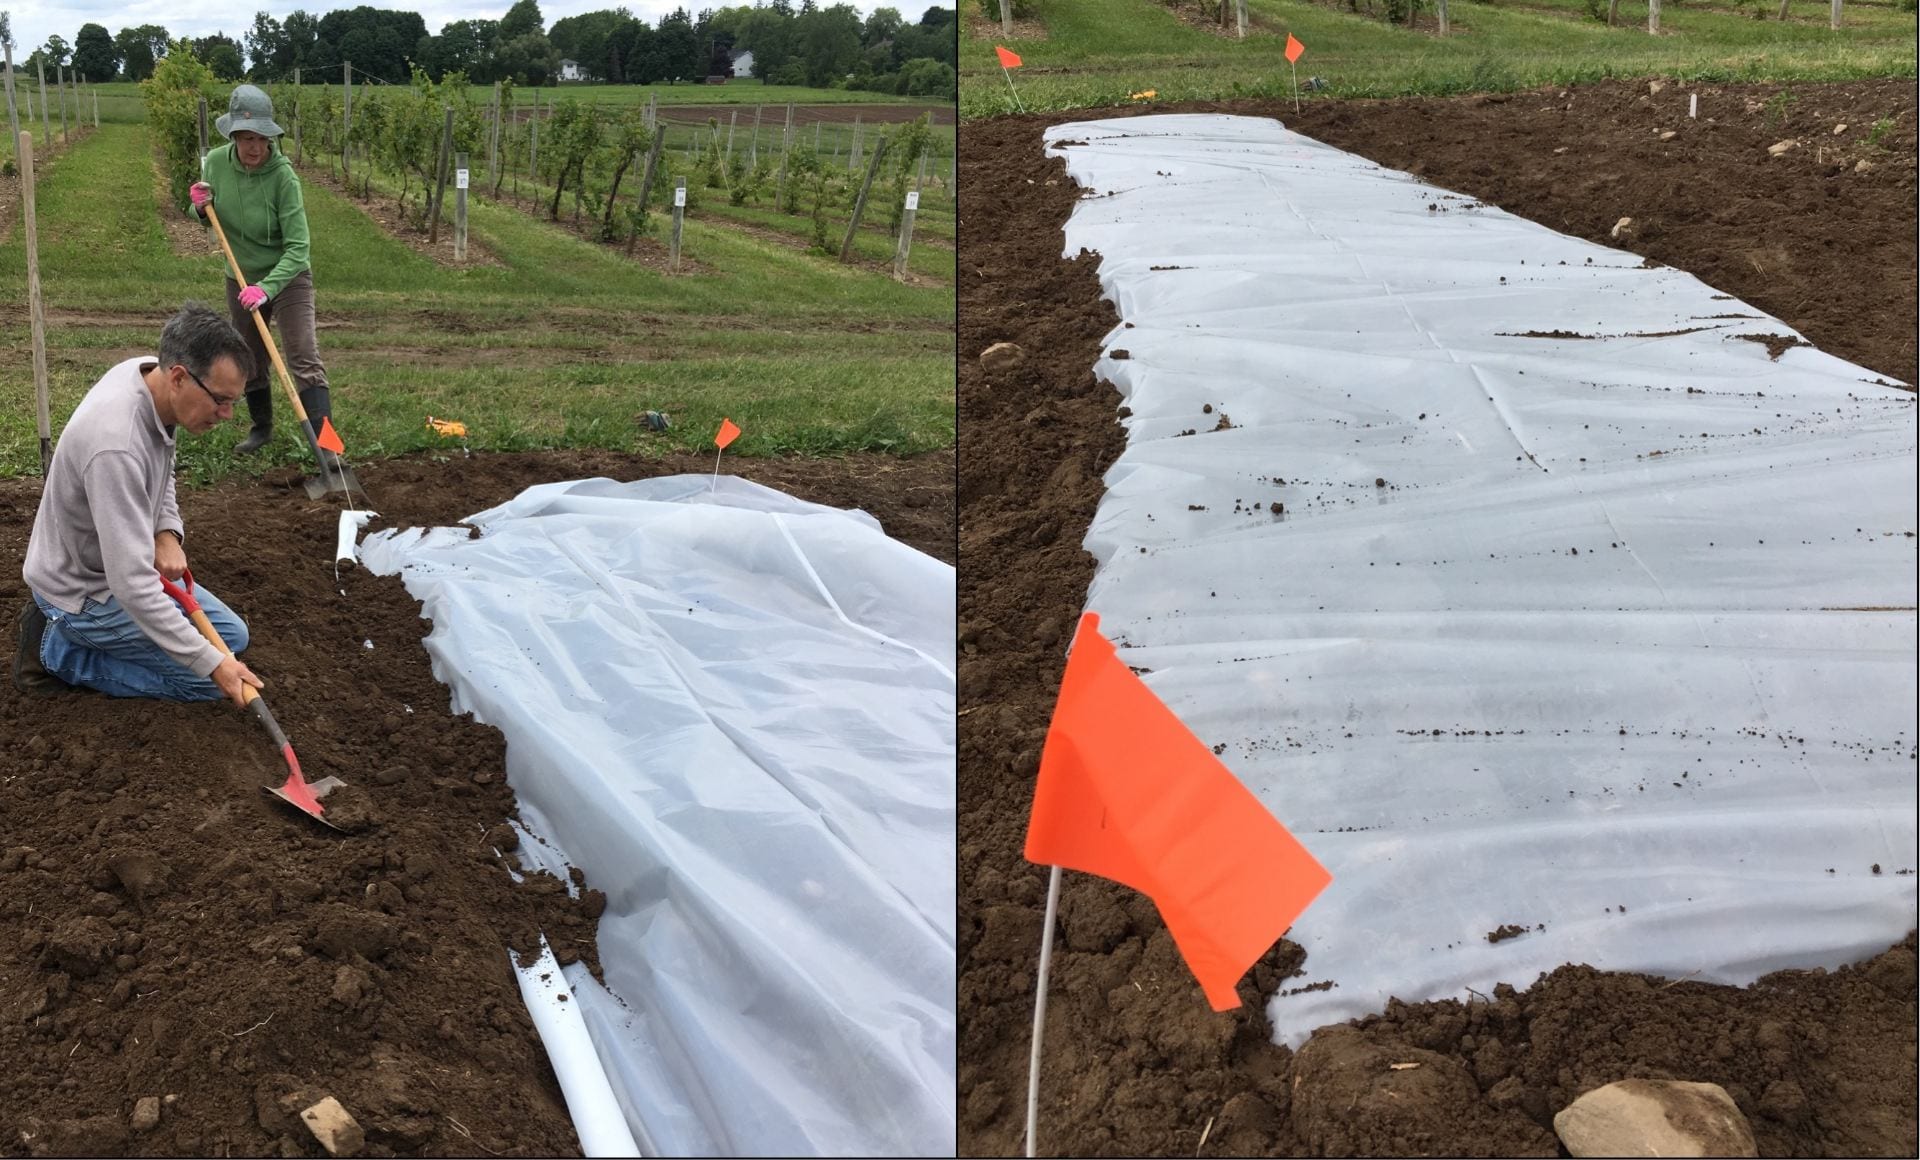
Overall, we were pleased with how the solarization worked. We laid down 6 mil clear plastic (leftover from a nearby high tunnel) in early June, and did a little weed control around the edges of the plastic just once during the summer to prevent more weed seed production and to prevent shading of the plots.
We laid 6 mil clear plastic over some plots on June 5, 2018 to solarize the soil underneath (and kill weeds).
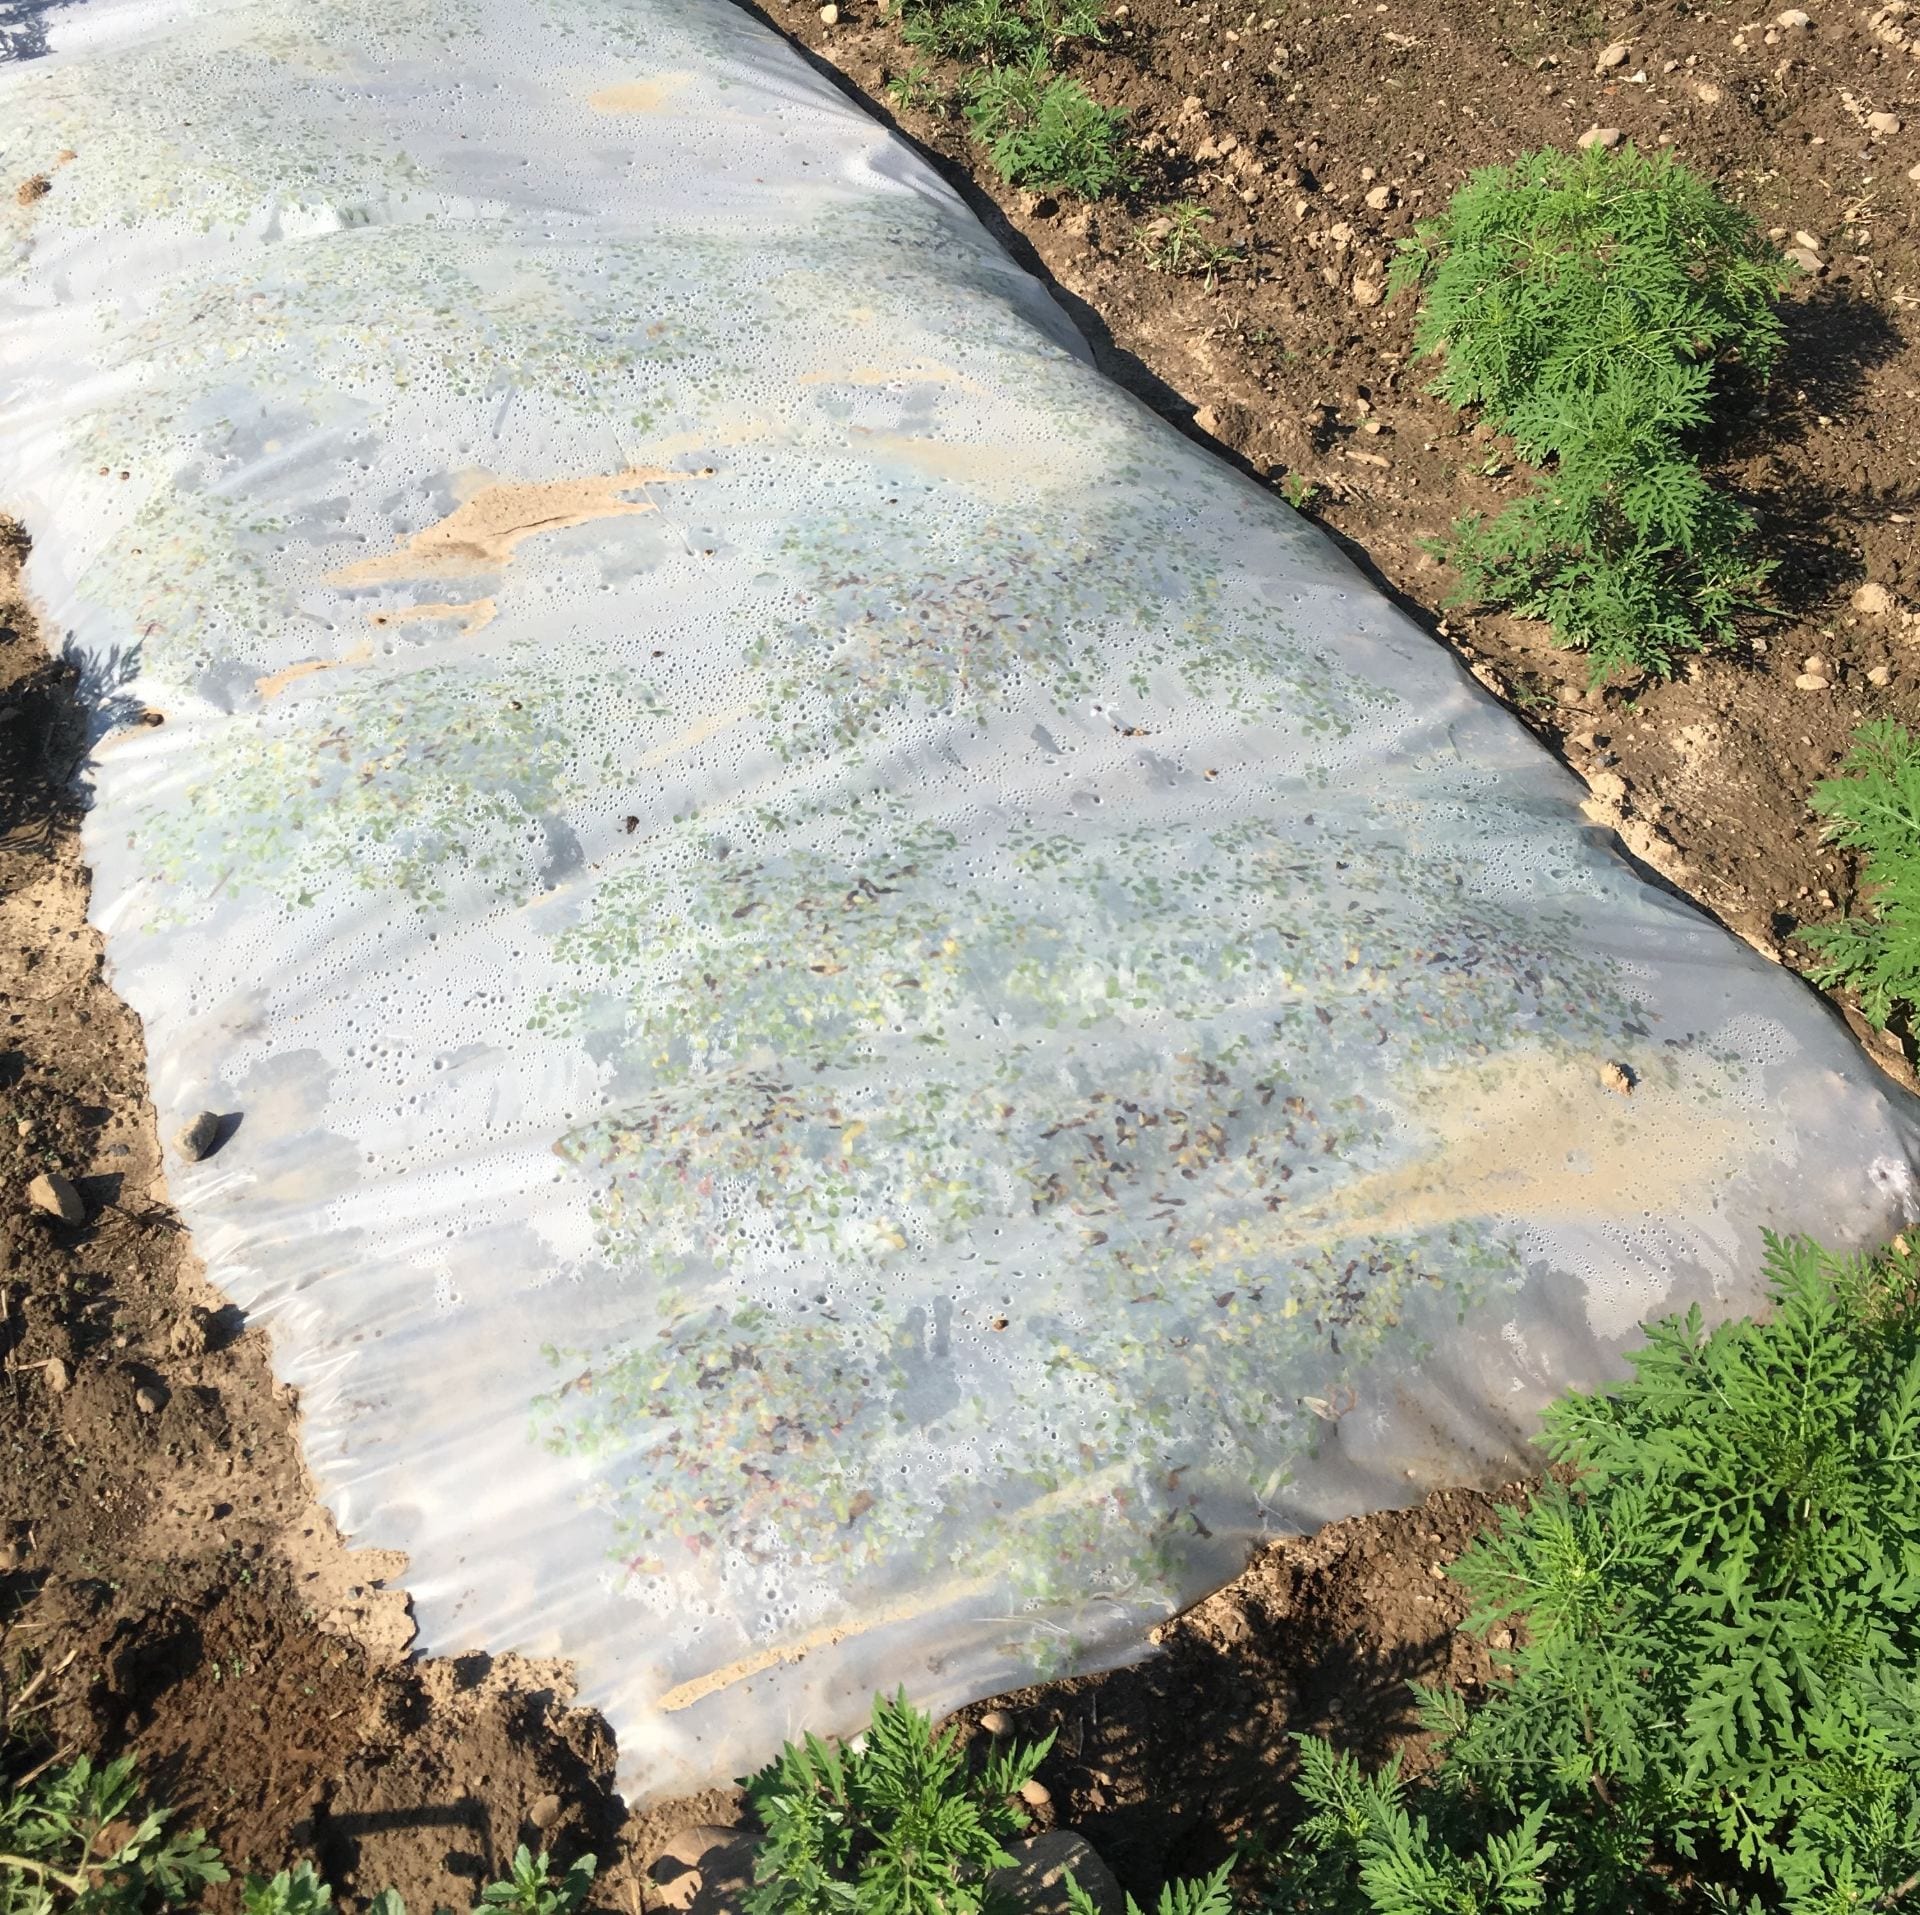
We also learned that solarization will not control purselane. In contrast, the purselane thrived only under our clear plastic, and nowhere else in the field. The plot that had the most purselane also had the most other (mostly grass) weeds. I think the purselane pushed the plastic away from the soil and reduced the temperature a bit, allowing other weeds to grow.
In some solarized plots, purselane grew happily under the plastic. Purselane was not a common weed anywhere else in the field during the season.
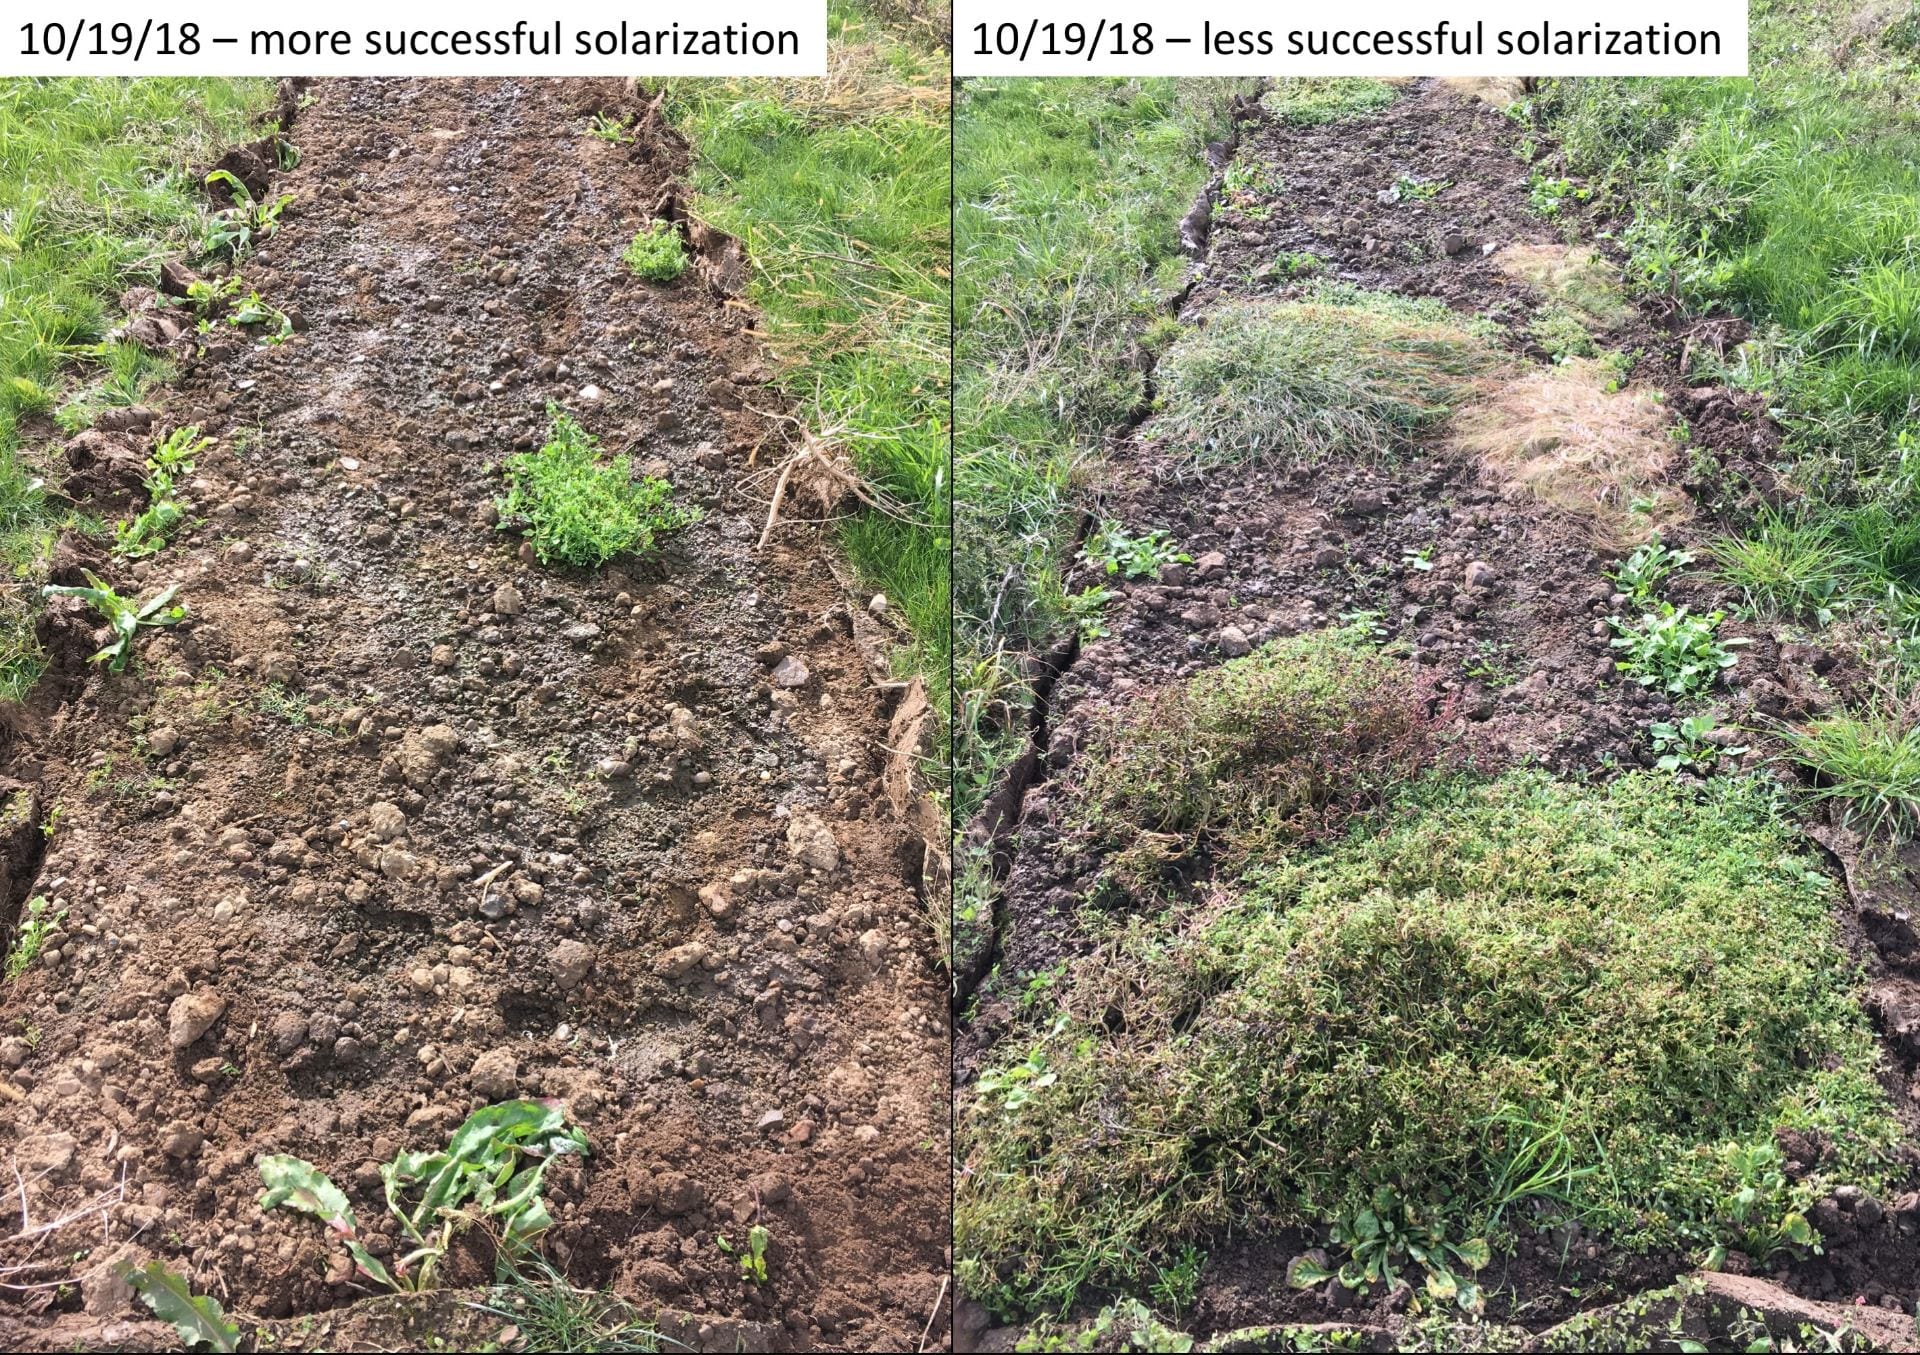
Some other plots were virtually weed-free when we pulled the plastic up in October. (Did you see how large the error bar was for weeds in treatment F in the weed graph above? This means there was a lot of variability between plots in this treatment.) Our soil temperature probe happened to be in the plot with the most purselane, and we still achieved maximum soil temperatures of 120 °F (at a depth of about 3 inches), compared to 90 °F in a nearby control (treatment E) plot.
Solarization results were pretty variable from plot to plot. In some plots, it worked great (left). In other plots more purselane germinated and it didn’t work as well (right). We cut all the weedy vegetation off at the ground before direct seeding the beneficial habitat plants.
Repeated herbicide and tillage
At the weed assessment in September, the plot that had been alternately treated with herbicide and tilled looked best in terms of weed control. Like treatment C and all the treatments planted (by seed or by transplant) in the fall, I think we’ll get a better idea next year of how effective this method was at suppressing weeds.
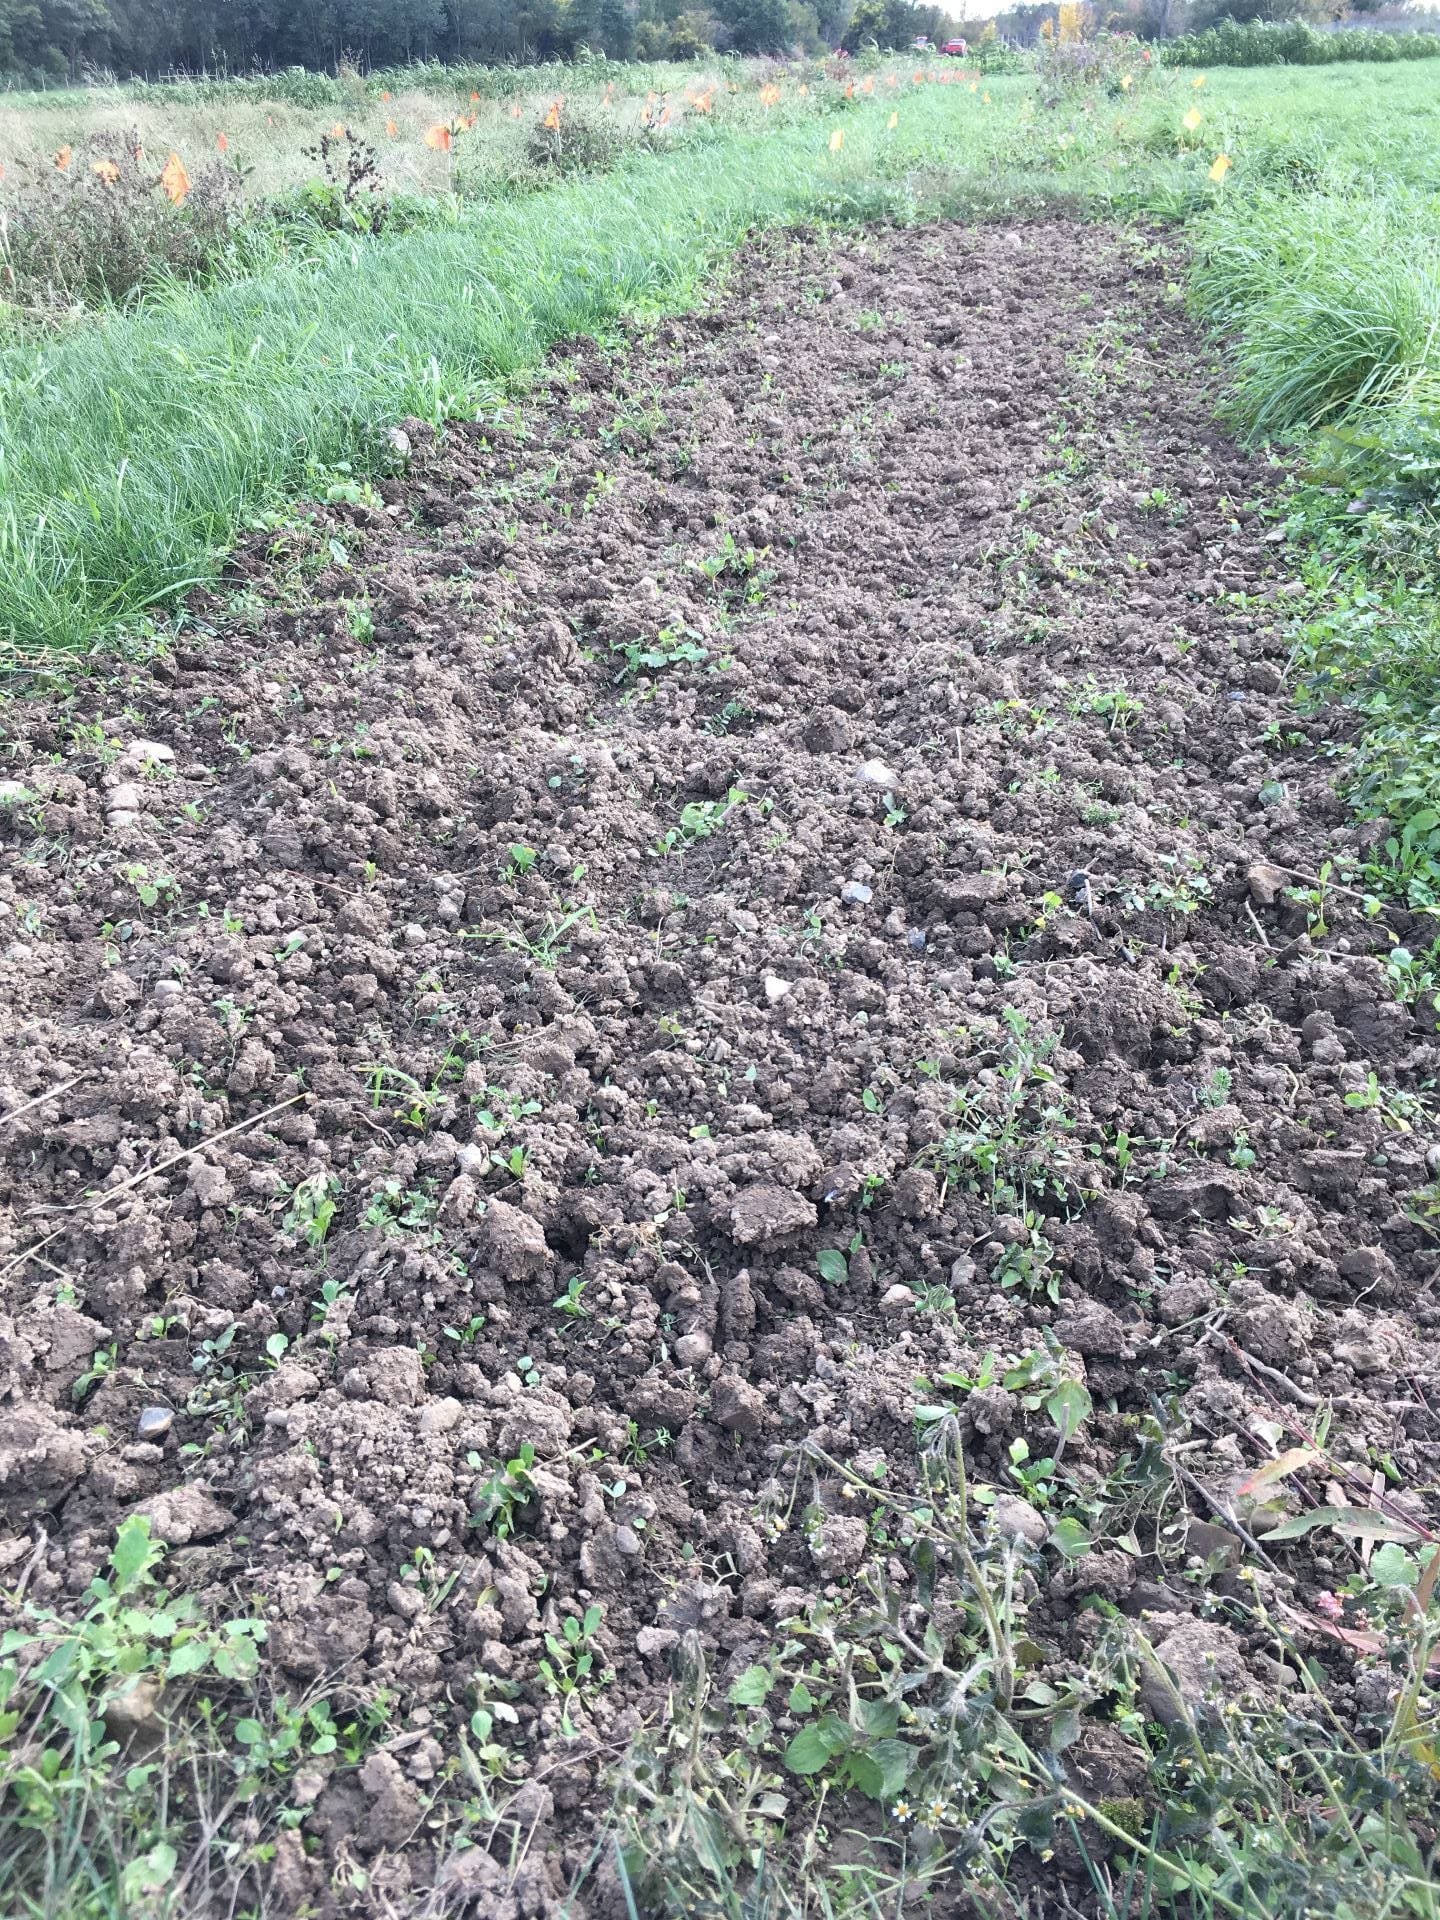
A few weeds were present a week after the last time the herbicide/tillage treatment (G) was rototilled. We broadcast, raked, and pressed beneficial habitat seed into these plots.
Timing of fall planting
One thing we struggled with this fall was deciding when to plant the wildflower and grass seed mixture. One source recommended the seeds be planted sometime between October and December. We were cautioned that if we planted the seed too early, some species (especially blackeyed Susans) might germinate this fall, and the young seedlings would be killed by an early frost before they established. But we were also afraid of waiting too long and not being able to till the soil (treatment G, only) if it got too wet. And we wanted a nice smooth seedbed. In treatment F, we suspected that leaving the clear plastic on into November would protect the weeds from the cooler weather. But we worried that taking it off too early would only allow more weed seeds to blow onto the bare ground.
We direct seeded October 18, 2018, after the weather cooled down a bit, and before the ground got too wet.
Finally, we compromised and planted the seeds on October 18 and 19, after our first hard frost, and once it looked like the nighttime temperatures would be in the 40’s (or below) for the next 10 days. It was only a week after the last tillage in treatment G, and the soil was still relatively dry. Those who live in the Finger Lakes know that late October and early November were pretty wet this year, so I’m glad we planted when we did. If you are trying to time fall seeding, I would recommend that you keep an eye on the 10 day forecast to see when temperatures are starting to cool. But if you get a dry sunny day to plant and it’s reasonably cool, I wouldn’t delay.
So if I want to plant habitat for pollinators and natural enemies next year, what should I do?
First, think about the time, money, and equipment you have available, as well as the area you’d like to plant. There probably isn’t a single right way to establish this habitat, but there may be a best way for you.
You can find more details on the techniques we used (and some links to other resources) here.
This post was written by Amara Dunn, Brian Eshenaur, and Betsy Lamb.
This work is supported by:
Crop Protection and Pest Management -Extension Implementation Program Area grant no. 2017-70006-27142/project accession no. 1014000, from the USDA National Institute of Food and Agriculture.
New York State Department of Agriculture and Markets
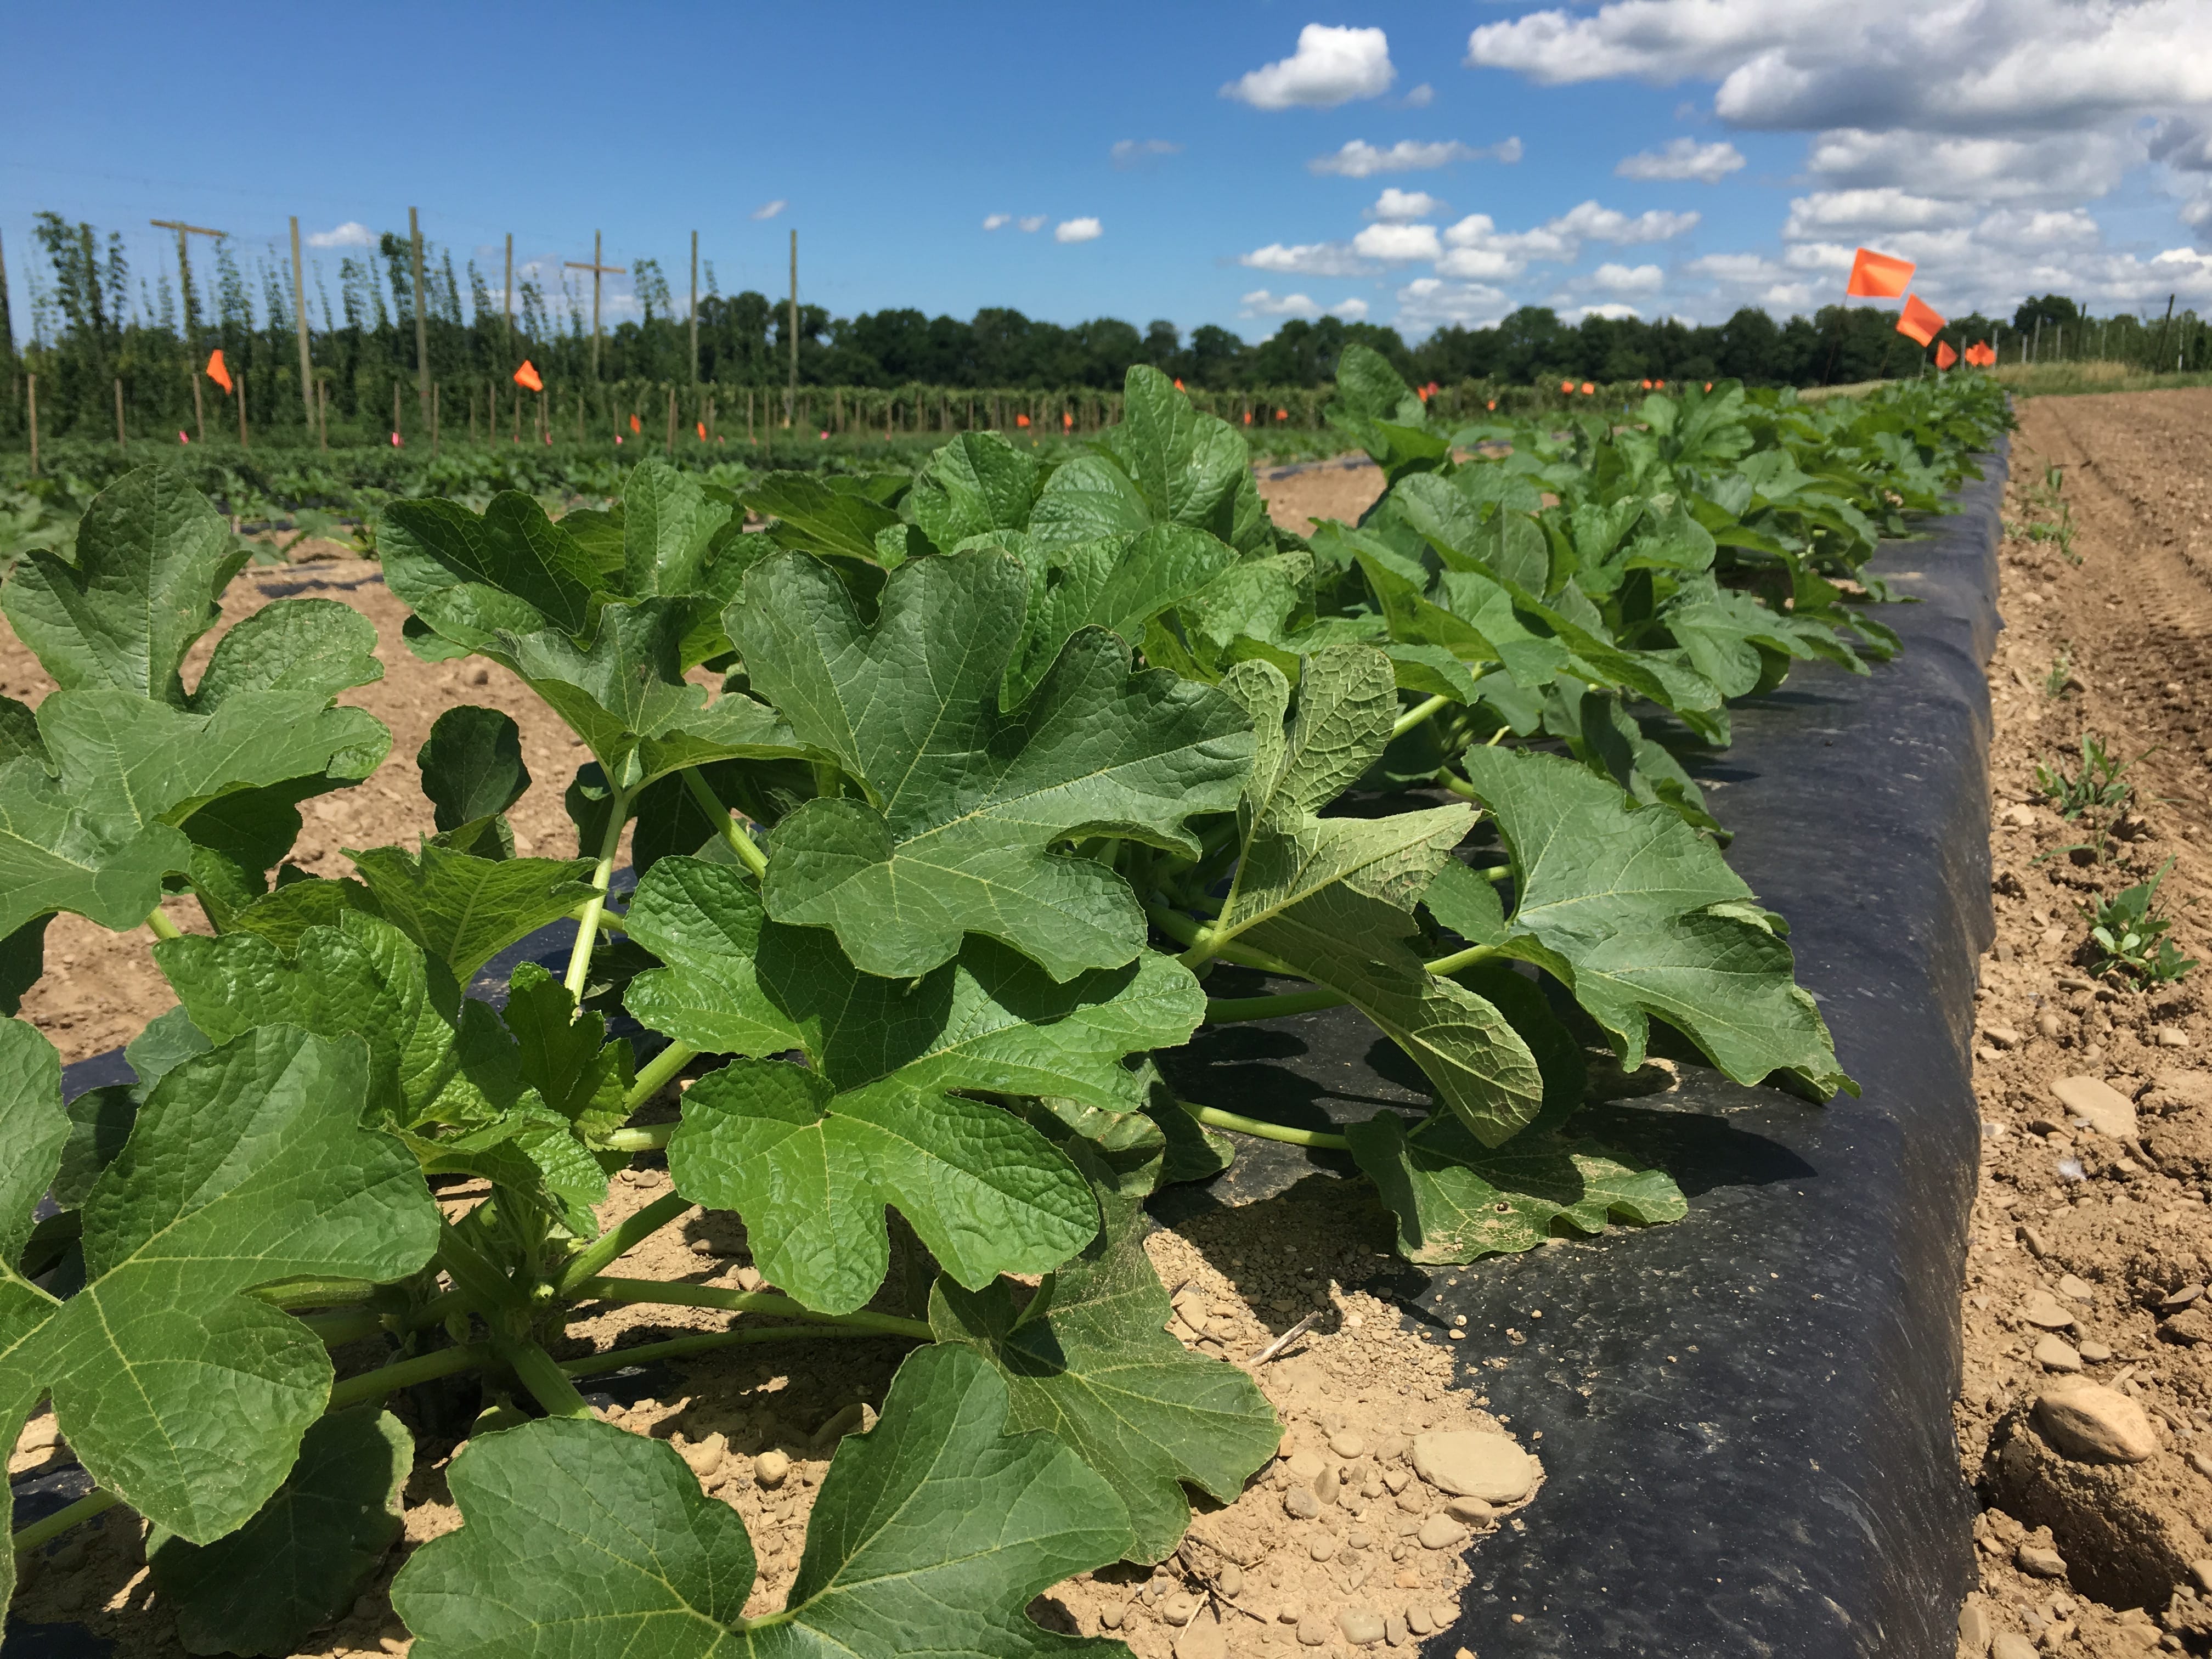
This summer we compared three biofungicides added to a conventional cucurbit powdery mildew management program in field trials conducted in western and eastern NY and on Long Island. Photo credit: Caitlin Vore, Cornell Vegetable Program
Quantify what biofungicides add to management of cucurbit powdery mildew and white mold in terms of…
– disease control
– yield
– plant health
– economic value (comparing yield gains to fungicide costs)
Evaluate the utility of NDVI (normalized difference vegetation index) as a measure of plant health and disease detection in fresh vegetables
Why this project?
For both diseases (cucurbit powdery mildew and white mold), we’re considering biofungicides used with other pest management – other biofungicides, conventional chemical fungicides, and/or cultural practices. Biofungicides are not expected to be silver bullets, and they work best when used in an IPM strategy. But when deciding whether or how to use them in your operation, it’s good to know what value you’re getting for the extra costs of purchasing and applying the products. This summer we ran trials in three major vegetable-producing regions of the state: western New York, eastern NY, and on Long Island.
Biofungicides for cucurbit powdery mildew
Cucurbit powdery mildew looks like a dusting of powdered sugar on the cucurbit leaf. These powdery spots start on the underside of the leaf, and then develop on the upper surface of the leaf, so excellent spray coverage is important. Photo credit: Amara Dunn, NYS IPM
For combatting cucurbit powdery mildew, we’re comparing three biofungicides: LifeGard (Bacillus mycoides isolate J), Regalia (extract from the giant knotweed plant Reynoutria sachalinensis), and Serifel (Bacillus amyloliquefaciens MBI 600). All three were applied weekly starting when the plants were small. Then, when the first signs of powdery mildew showed up, we started a rotation of conventional fungicides (Vivando, Quintec, and Luna Experience). These three treatments plus a rotation of all-organic fungicides (LifeGard, MilStop, Serifel, and a mineral oil) are being compared to two control treatments: the conventional fungicides alone, and plants that received no treatment for powdery mildew. We ran the trials on a variety of bushing acorn squash (‘Honey Bear’) that has intermediate resistance to powdery mildew.
Biofungicides for white mold
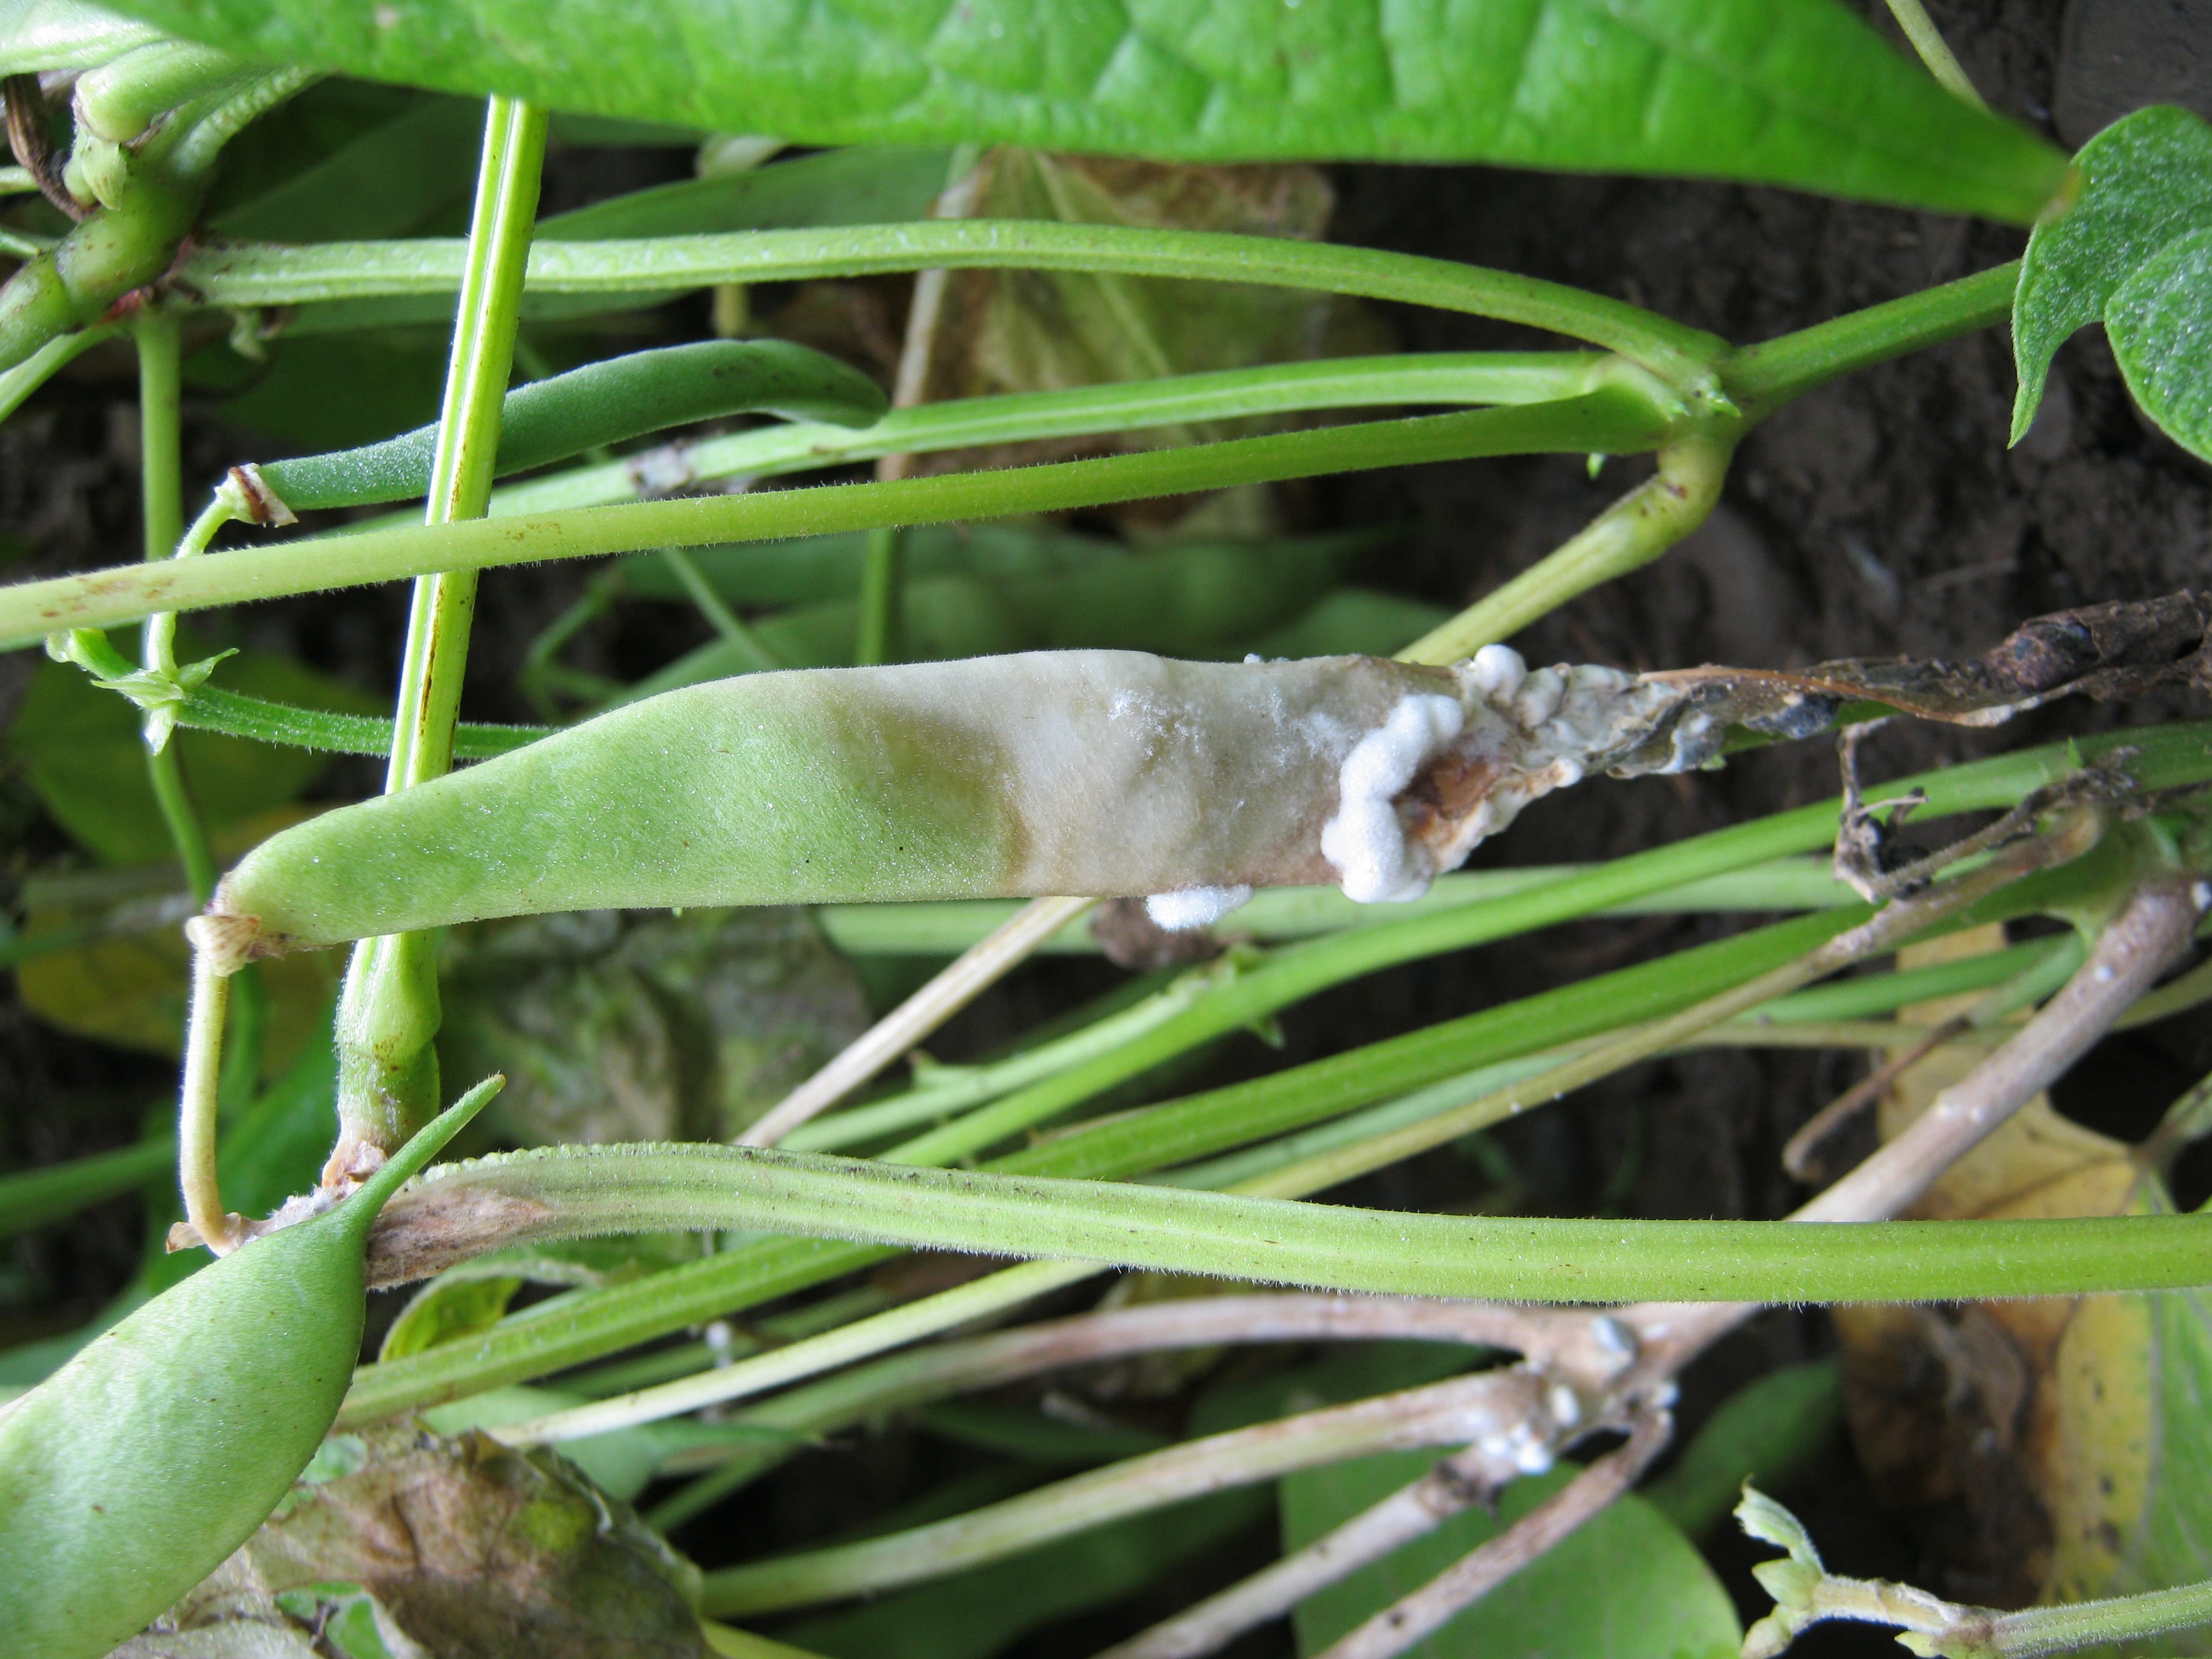
Most vegetable crops are susceptible to white mold, with legumes being among the most vulnerable. The name comes from the dense white “tufts” that the fungus forms. These develop into dark, hard sclerotia that can survive for years in the soil. Photo credit: Amara Dunn, NYS IPM
In the white mold trial, we’re looking at Double Nickel (Bacillus amyloliquefaciens strain D747) alone or in combination with Contans (Paraconiothyrium minitans strain CON/M/91-08; formerly Coniothyrium minitans). Next year we’ll look at these biofungicides in combination with reduced tillage at one site. Reduced tillage is another IPM strategy for white mold. The active ingredient in Contans is a fungus that eats the resting structures (sclerotia) of the fungus that causes the disease white mold. Because of this, it needs time to work, and is applied either in fall or spring. The goal is to reduce the number of sclerotia present in the next crop. Next year we’ll collect data on whether application of Contans reduced disease. In the meantime, during the 2018 growing season treatments we tested were Double Nickel, Cueva (an OMRI-approved copper) and no treatment for white mold on snap bean. Previous research by the EVADE Lab at Cornell AgriTech at The New York State Agricultural Experiment Station, Geneva, New York, has shown that Double Nickel is a promising biofungicide for white mold.
What is NDVI, anyway?
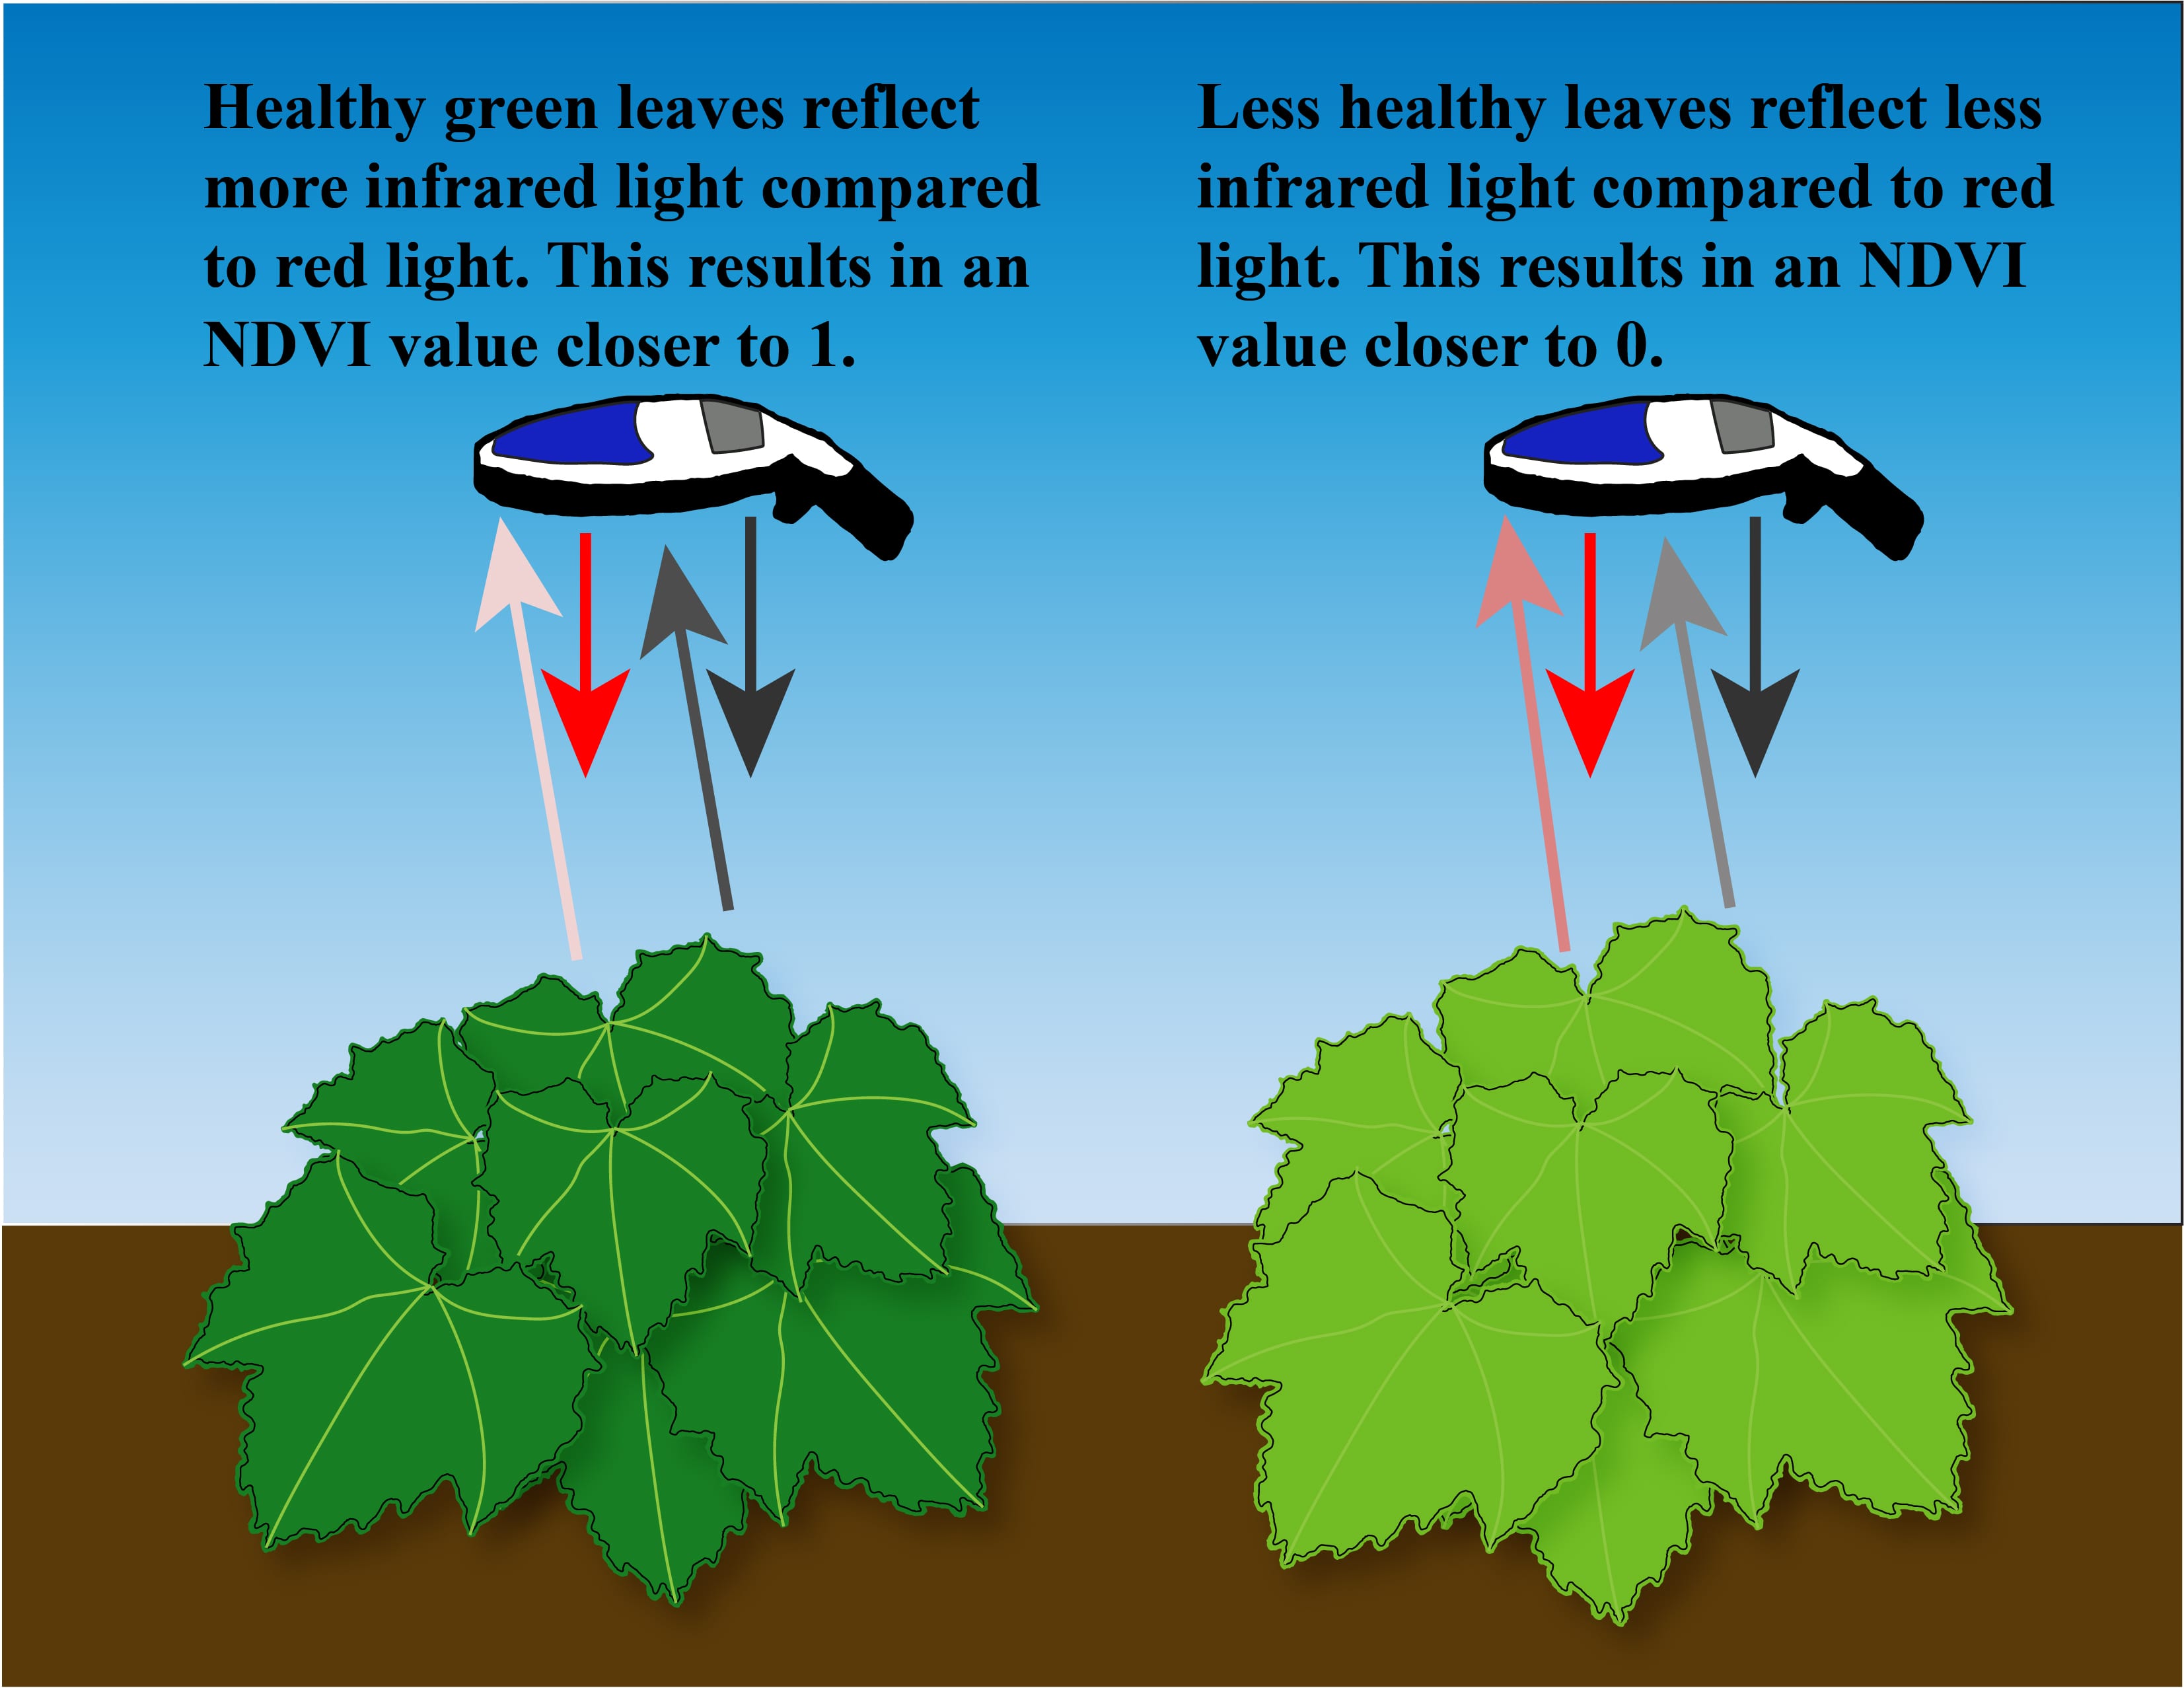
In a nutshell, the “normalized difference vegetation index” (NDVI) is a way to quantify how much healthy, green foliage is present. The device we used emits different types (wavelengths) of light (red and near infrared), and measures how much of each type of light is reflected back from the leaves of the plant. Leaves that are dark green and healthy reflect more infrared light and absorb a lot of red light. Less healthy leaves reflect less infrared light. A NDVI value closer to 1 indicates healthier plants. A NDVI value closer to 0 indicates less healthy plants (or more bare ground).
NDVI (normalized difference vegetation index) quantifies the amount of dark green foliage based on how much light of different wavelengths is reflected. It is used in some crops to decide when to apply fertilizer, or to help detect below-ground pests. Photo credit: Amara Dunn, NYS IPM
Help us quantify the health of plants. Even though NDVI is not a measure of disease, we would expect to see more healthy foliage if biofungicides are contributing to disease control.
Provide some preliminary data to help us determine whether NDVI measurements could be useful to NY fresh vegetable growers.
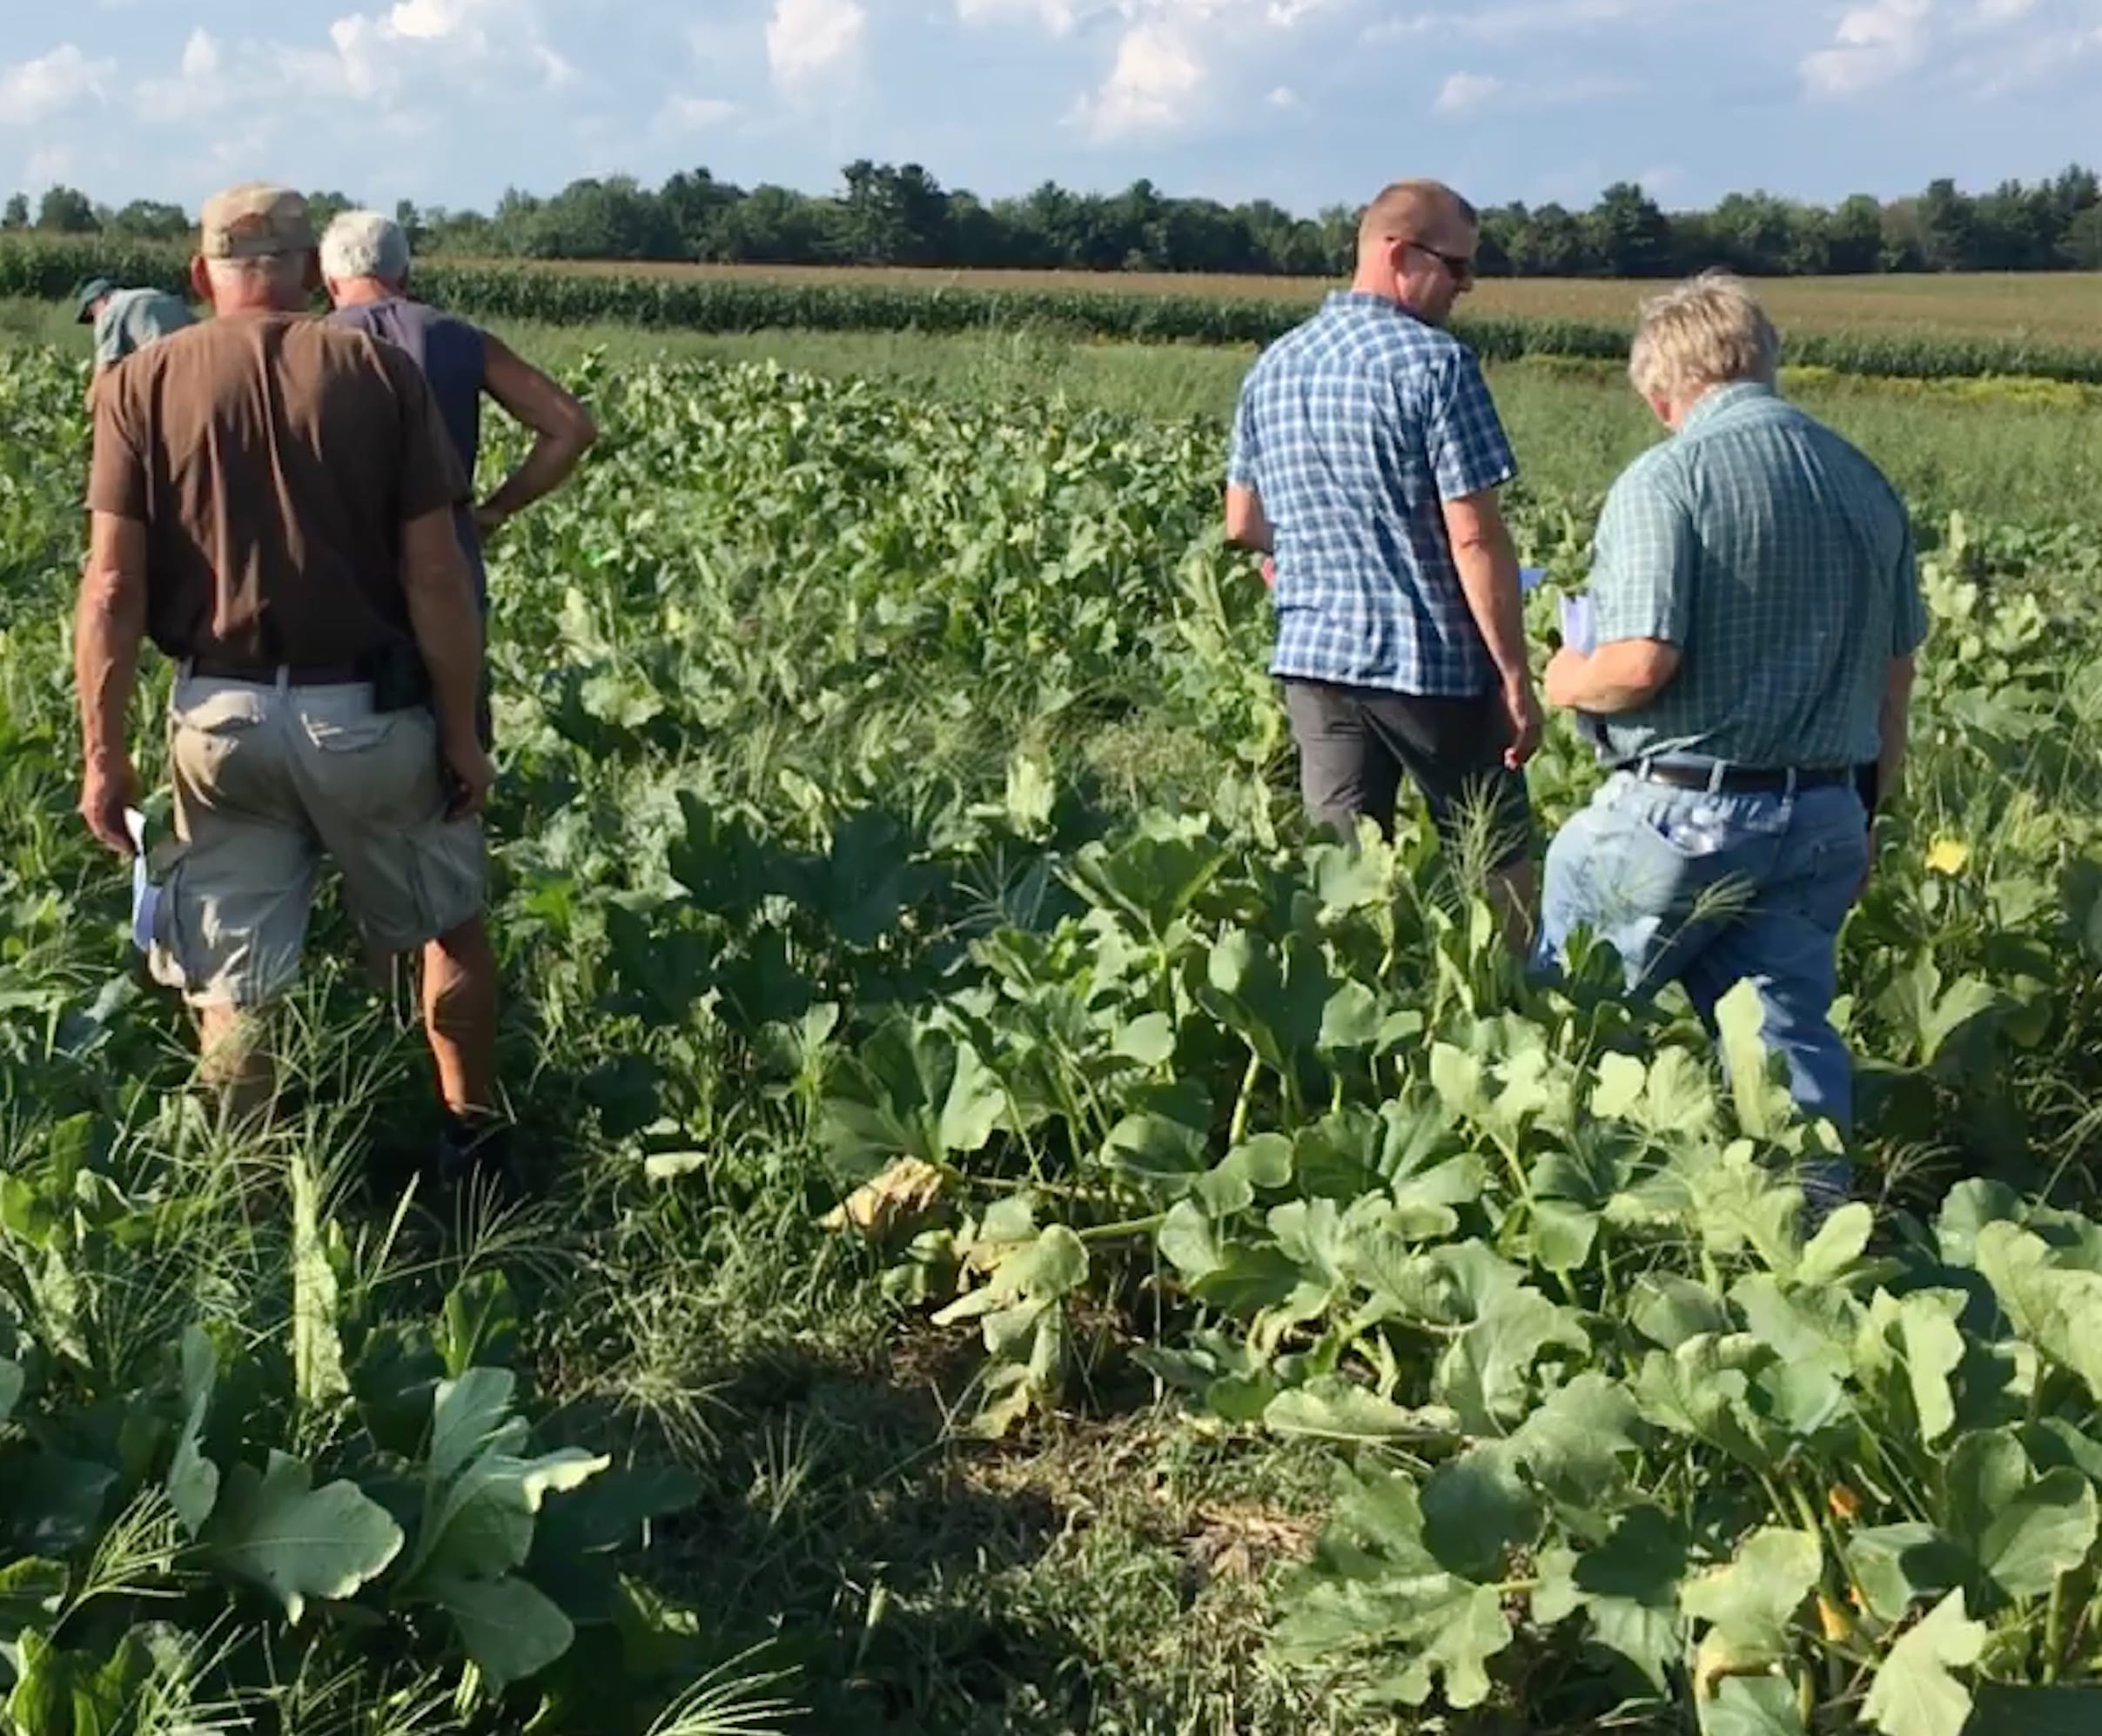
Growers and industry reps had a chance to visit the 2018 cucurbit powdery mildew field trials shortly before they were harvested. Photo credit: Amara Dunn, NYS IPM
Field meetings were held at each powdery mildew trial location so that local growers could see the trials and hear about the project. We’re currently wrapping up data analysis from the 2018 field season. You’ll be able to learn about results from the first year of this two-year project at winter meetings around NY, in extension newsletters, and here on this blog. Also, stay tuned for Part 2 of this post with details about how these biofungicides work (modes of action), and how to use them most effectively.
This post was written by Amara Dunn (NYS IPM), Sarah Pethybridge (Plant Pathology & Plant-Microbe Biology, School of Integrative Plant Science, Cornell University), and Darcy Telenko (Department of Botany & Plant Pathology, Purdue University).
A lot of great people are doing great work with biocontrols. So this month I’m featuring an update from an exciting project happening in Eastern NY testing a potential biocontrol solution to wireworms in sweet potatoes. Thank you to Teresa Rusinek (Cornell Cooperative Extension Eastern NY Commercial Horticulture Program) for writing this post! I will definitely be following this project as results from 2018 come in. Check back for future updates!
Sweet Potato with wireworm damage from EPN biocontrol trial (Photo credit: Teresa Rusinek)
Professor Elson Shields and Research Specialist Tony Testa of Cornell Dept. of Entomology, have been working with NY native entomopathogenic (insect attacking) nematodes (EPNs) for the past 20 years. Initially, the EPN biocontrol systems were developed to protect alfalfa crops from the destructive snout beetle. This system has been highly successful, over 150 alfalfa fields in NY alone have been inoculated. EPNs have been proven to persist in the soil years after application. They require 2-4 years for full effectiveness determined by the application method.
Cornell Cooperative Extension, Eastern NY Commercial Horticulture Educators Teresa Rusinek and Charles Bornt have been working with Shields and Testa on a multi-year research project at the HV Farm Hub to test the efficacy of NY Native EPNs in the suppression of wireworms which are increasingly damaging to various crops, especially roots crops, grown in the Hudson Valley.
Entomopathogenic nematodes are reared in wax worm hosts and strained into a solution that is applied to the soil. (Photo credit: Teresa Rusinek)
Our project began in May of 2017 at the Farm Hub, where we established research plots in a field where wireworms were found in large numbers. Four control plots had no EPNs applied, four plots were treated with both Steinernema carpocapsae (Sc) and Steinernema feltiae (Sf) nematodes, and the final four plots were treated with Sf and Heterohabditis bacteriophora (Hb) nematodes. Each EPN species occupies a different depth in the soil and has somewhat different modes of action. This research will determine which nematodes species are best adapted to establish in the field as well as which combination of nematodes is most effective at suppressing wireworms.
Results from our harvest evaluation from last year look very promising. 200 sweet potatoes were harvested from each plot on Sept. 26, 2017 and scored for wireworm damage. EPN treated plots overall had 36% less wireworm damage than the untreated control plots. In addition, soil core bioassays taken earlier this spring show that the EPNs, Sf in particular, have well-established and overwintered in the treated plots. We have not yet harvested and evaluated the sweet potatoes from this growing season.