Tag Archives: disease

Biopesticides for tomato bacterial diseases: On-farm demos

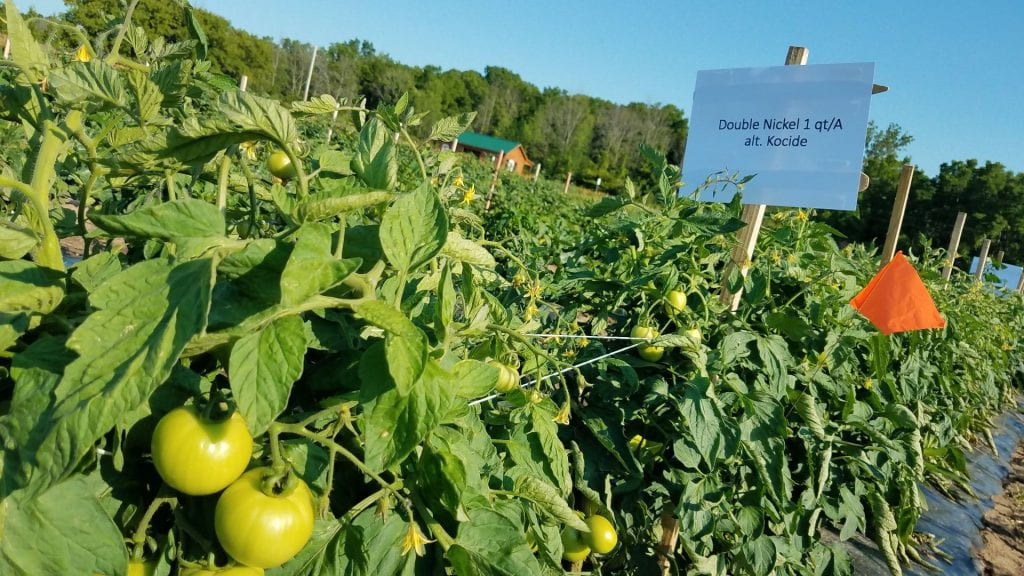
row of tomato plants with some green fruit and a sign that says Double Nickel 1 qt/A alt. Kocide
On-farm demonstration of reducing copper applications by alternating with biopesticides to protect against tomato bacterial diseases.

Last summer I wrote about integrated pest management strategies (IPM) for tomato bacterial diseases and how biopesticides fit into strategies for managing these diseases. You’ll recall that research trials conducted at Cornell in Chris Smart’s lab indicated that you could replace some copper sprays with the biopesticides Double Nickel or LifeGard and achieve the same level of control of tomato bacterial diseases. In 2023, we wanted to demonstrate what this might look like on vegetable farms around New York State – Long Island, eastern NY, and western NY. Here’s what we observed.


Results from On-Farm Demos

Biopesticides are not a panacea for tomato bacterial disease problems. When disease pressure is severe and weather is favorable, bacterial diseases can be difficult to manage, even with copper-based fungicides. Canker is especially difficult to manage because the bacteria that cause the disease move systemically within the plant. Successful management of bacterial diseases in tomatoes requires the use of multiple IPM tools, including starting with clean seed and healthy transplants, and using new (or effectively disinfected) tomato stakes.

On farms that experienced tomato bacterial disease outbreaks, adding Double Nickel did not satisfactorily control bacterial disease. These farms had very uneven distribution of tomato bacterial canker across the fields, complicating comparisons between the Double Nickel alt. copper treatments and the copper only treatments. Two farms (in western NY) saw slight to moderate increases in fruit quality when they added Double Nickel sprays in between copper applications compared to applying copper every 10-14 days. This resulted in estimated 2% and 37% increases in fruit value, corresponding to an extra $19 (from nine harvests) or $72 (from four harvests) from 100 row feet of tomatoes. However, the Double Nickel sprays were in addition to copper sprays, not replacing them. We don’t know if applying copper every 7-10 days would have resulted in better disease control. On the third farm, we saw no benefit of replacing half of the copper applications with Double Nickel.

The two cooperating Long Island farms saw no bacterial disease in 2023. But replacing half of the copper applications with either Double Nickel or LifeGard still seemed to have economic advantages. We estimate that the value of their crops increased by 7% and 59%, or $244 and $1,617 per 100 row feet of tomatoes harvested four times. Note that the price for fresh tomatoes on Long Island is high compared to some other markets in NY. We used $5-$6/lb in our Long Island estimates. Also, we don’t know what would have happened if there had been a bacterial disease outbreak on these farms.

On all cooperating farms, we collected data on very small sections of the field (10-40 row feet of tomatoes). Estimated potential impacts on yield over much larger areas should be taken with a grain of salt.
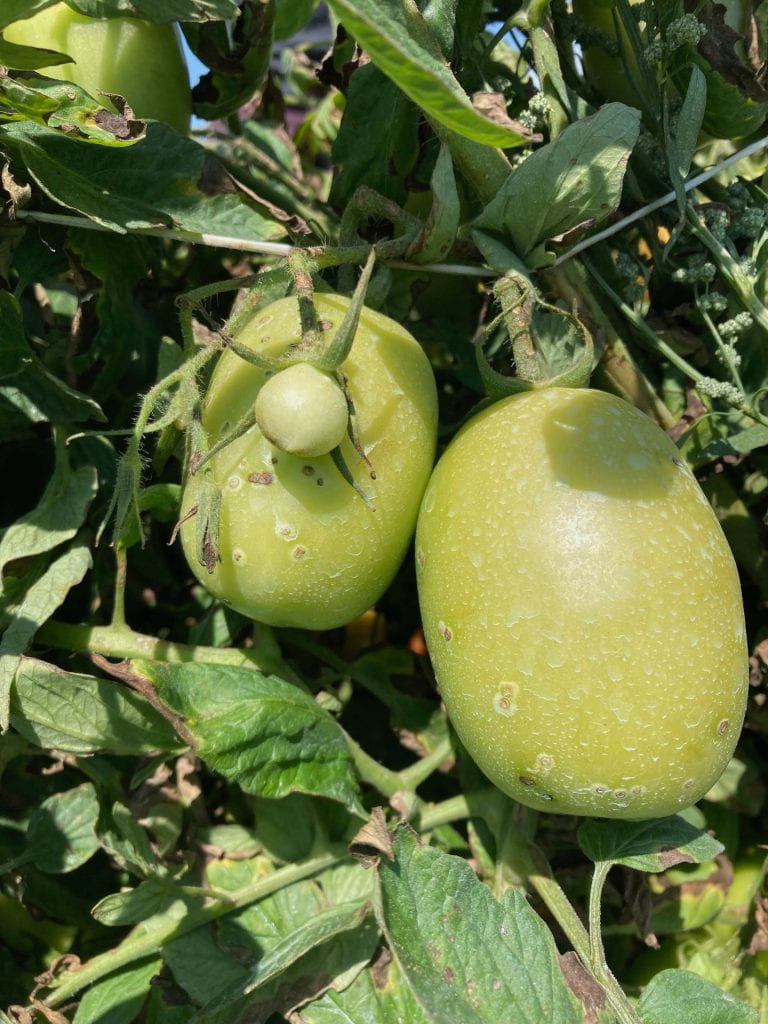
Green Roma tomato fruit with both white spray residue and classic fruit symptoms of tomato bacterial canker – brown spots with a white ring around them
Tomato bacterial canker is a difficult disease to manage, even with weekly copper applications. Use of multiple integrated pest management (IPM) tools yields the best results. Photo credit: Crystal Stewart-Courtens.


Economics

We researched some prices for pesticides from a few different suppliers. Below are the assumptions we made to calculate some price estimates and make comparisons among some biopesticides and copper pesticides. Prices for pesticides can vary across regions and time. If you think any of these numbers are far out of line, please let Amara know!

If you are applying… and a container costs you… and you apply at a rate of… Your cost per A per application is:
Actinovate AG $115/18 oz bag 7.5 oz/A (range on label is 3-12 oz) $48.00
Double Nickel LC $85.25/1 gal 1 qt/A (recommended for tomato bacterial diseases) $21.31
LifeGard WG $148/1 lb bag 4.5 oz/100 gal and 50 gal/A = 2.25 oz/A $20.80
copper (Kocide 3000-O or Badge X2) $102/10 lb bag 1.25 lb Kocide, 1.8 lb Badge X2 (highest rate on label) $15.00
copper (Badge SC) $150/2.5 gal 1.8 pt/A (highest rate on label) $13.58
Copper (Champ Formula 2 Flowable) $139.95/2.5 gal 1.33 pt/A $9.31
copper (Cueva) $114/2.5 gal 1 gal/A (label rate is 0.5-2 gal) $46.27

As you can see, the biopesticides in the table range from fairly similar in price (Double Nickel and LifeGard) to approximately 5 times the cost of the less expensive coppers (Actinovate). Each copper application replaced with either Double Nickel or LifeGard is estimated to increase the pesticide cost by $6-$12 per acre per application. If a grower makes eight applications in a season to protect tomatoes from bacterial diseases, this would be an increase of $24-$48 per acre for the season if half of the copper applications are replaced with Double Nickel or LifeGard. If a grower adds LifeGard or Double Nickel applications to a 14-day copper spray program, the cost increase is greater. Purchasing product for four additional applications costs an extra $84 per acre, not including other costs of making more applications, like fuel, labor, equipment depreciation, etc.


Protecting people and the environment

Replacing some copper sprays with biopesticides can have other benefits. For example, the following table compares restricted entry intervals (REIs), label signal words, and field use ecological Environmental Impact Quotient (EIQ) for several biopesticides and copper formulations. Shorter REIs indicate a pesticide has lower toxicity to agricultural workers. The signal word shows the relative acute toxicity of the pesticide to the pesticide applicator.


Product Active Ingredient (%) Rate REI Signal word Field Use Ecological EIQ1
Actinovate AG Streptomyces lydicus WYEC 108 (0.037%) 12 oz/A 4 hrs Caution NA
Double Nickel LC Bacillus amyloliquefaciens strain D747 (98.85%) 1 qt/A 4 hrs none on label NA
LifeGard WG Bacillus mycoides isolate J (40%) 4.5 oz/A 4 hrs Caution NA
Serenade Opti2 Bacillus subtilis QST 713 (26.2%) 20 oz/A 4 hrs Caution 7.2
Badge SC copper hydroxide (15.36%); copper oxychloride (16.81%)3 1.8 pt/A 48 hrs Caution 40.1
Champ Formula 2 Flowable copper hydroxide (37.5%) 1.33 pt/A 48 hrs Warning 34.5
Cueva copper octanoate (10%) 2 gal/A 4 hrs Caution NA
Kocide 3000-O copper hydroxide (46.1%) 1.25 lb/A 48 hrs Caution 38.2
MasterCop copper sulfate pentahydrate (21.46%) 2 pt/A 48 hrs Danger 66.4

1 The Environmental Impact Quotient (EIQ) seeks to quantify the environmental impacts of pesticides. Higher numbers indicate more negative impacts. The values reported here are “field use” values, calculated based on the rates listed in the table. These values vary depending on how much product you use per acre. The ecological component summarizes risk to fish, birds, bees, and beneficial insects.

2 The active ingredient in Serenade Opti is in the EIQ database, while the active ingredients of the other biopesticides in this table are not. The EIQ for Serenade Opti is expected to be similar to those of Double Nickel and LifeGard because they have similar active ingredients. It may also be similar to the EIQ for Actinovate.

3 Only copper hydroxide – not copper oxychloride – was in the EIQ database, so this ecological EIQ was calculated using 32.17% copper hydroxide (sum of the percentages of the two active ingredients).


Other benefits of reducing copper applications on a farm could include:

  • It reduces the risk of selecting for tomato bacterial pathogens that are resistant to copper.
  • Many copper fungicides leave a visible residue on fruit, which may impact marketability if applied close to harvest.


Update on labels

In last summer’s post we noted that neither Double Nickel nor LifeGard included tomato bacterial canker on their labels. In New York State, formulations of these biopesticides now have 2(ee) labels that include this disease on tomatoes. Make sure you have a copy of both the original label and the 2(ee) label in your possession if you are using these products for tomato bacterial canker in NY. If you are in NY, you can find these and other labels through NYSPAD.


The Bottom Line

  • It is very important to use all your IPM tools for tomato bacterial disease management, especially for canker. If you are bringing canker to your field in seedlings or on tomato stakes, it will be very difficult to catch up with the disease using any pesticide if weather conditions favor disease.
  • Some biopesticides are competitively priced (per bottle and per acre) with copper formulations. Replacing a few copper applications with these products will not cost you much more.
  • Replacing some copper applications with biopesticides offers some additional benefits, including copper resistance management, and potentially reduced risk to the environment and human health.


Changes in pesticide registrations occur constantly and human errors are possible. Read the label before applying any pesticide. The label is the law. No endorsement of companies is made or implied.


This post was written by Amara Dunn-Silver, Biocontrol Specialist with the NYSIPM program. Thanks to collaborators Chris Smart, Professor in the School of Integrative Plant Science, Plant Pathology and Plant-Microbe Biology Section at Cornell University, Crystal Stewart-Courtens, Extension Vegetable Specialist, Eastern NY Commercial Horticulture Program; Elizabeth Buck, Cornell Vegetable Program; Margaret McGrath, Retired Faculty, School of Integrative Plant Science, Plant Pathology and Plant-Microbe Biology Section at Cornell University, and Sandra Menasha, Cornell Cooperative Extension, Suffolk County. Support for this project was provided by the NY Farm Viability Institute.

Logo for the NY Farm Viability Institute

Managing tomato bacterial diseases? Biopesticides could help

Are you using copper to protect your tomatoes from bacterial diseases? Research from Cornell suggests that you could replace some of those copper applications with a biopesticide.

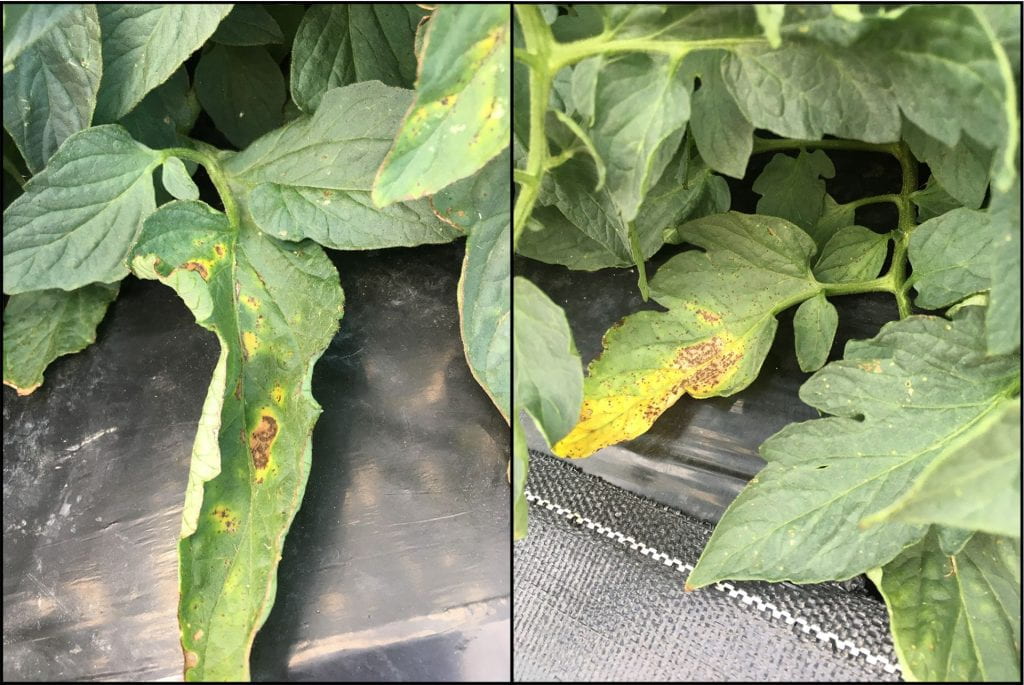
Two pictures of tomato leaves showing small brown specks, and larger specks or groups of specks surrounded by yellow margins
On tomatoes bacterial speck and spot both look like small black spots which may develop yellow halos around them as the lesions age.

Preventing bacterial diseases on your tomatoes starts with good integrated pest management practices.

  • > 3-year rotation out of tomatoes and peppers
  • Clean seed or disease-free transplants
  • Heat treat seed (unless it is pelleted or treated)
  • Good sanitation in transplant production facility (e.g., new flats or sanitize between uses, sanitize greenhouse after each season)
  • Inspect transplants and destroy any with symptoms of bacterial disease
  • Do not work in tomatoes (e.g., tie, prune) when leaves are wet
  • Either sanitize tomato stakes between growing seasons, or use new stakes each year (preferred)
  • If you have an outbreak, till in plant debris quickly.
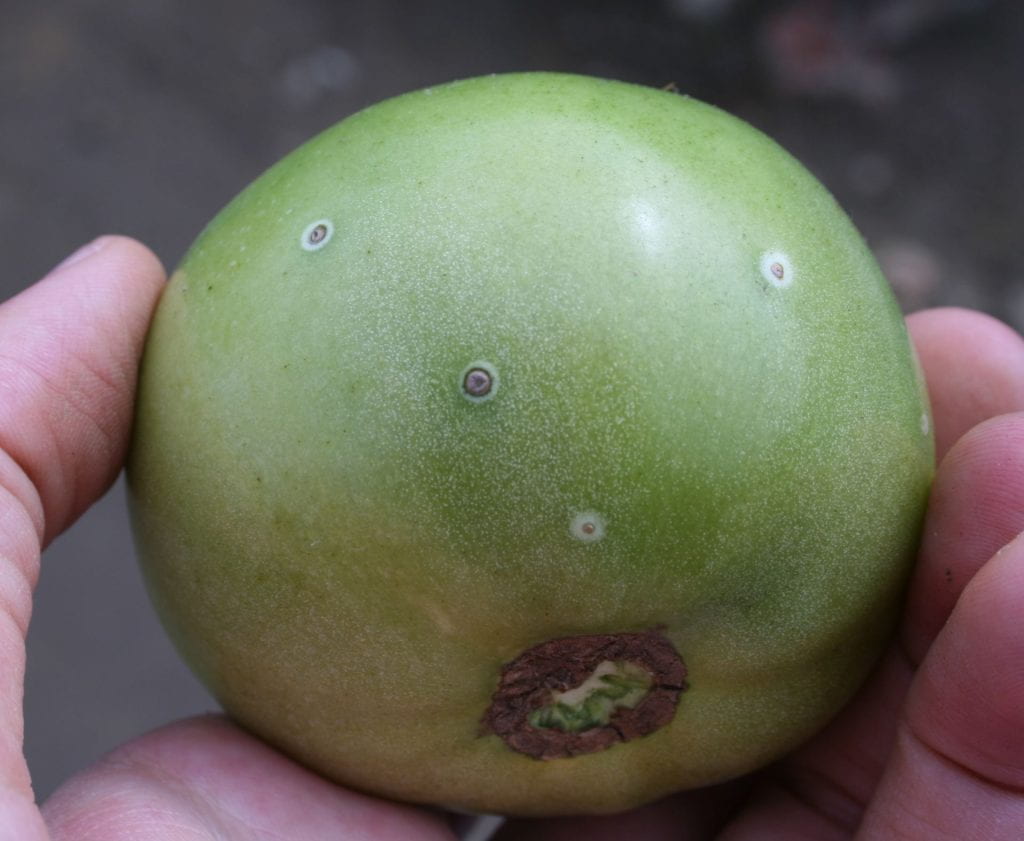
Green tomato fruit held in a white person’s hand with four black and brown spots, each surrounded by a white halo
Bacterial canker lesions on tomato fruit

If you are doing all of these things and still need some extra protection from bacterial diseases (e.g., in a wet growing season), pesticides might also be in your IPM toolbox.

In New York, we’re fortunate that so far few bacterial isolates have been found to be resistant to copper. Copper resistance is a major problem in the southern U.S. and we’d certainly like to preserve its efficacy here in NY. Some people are also understandably concerned about the environmental impacts of using a lot of copper on their farms.

Cornell vegetable research programs led by Chris Smart and Meg McGrath have been testing products against our three bacterial diseases – spot (Xanthomonas), speck (Pseudomonas) and canker (Clavibacter) for a number of years. So far, two products – Double Nickel LC (1 qt/A recommended) and LifeGard (4.5 oz/100 gal water) – have been rising to the top. When comparing these products alone to alternating either with copper, both worked better as replacements for some copper sprays than alone. Some research trials only included the biopesticide by itself, but the Double Nickel label states that it should be applied only tank mixed or rotated with copper-based fungicides.

Double Nickel alone (one year of data in Geneva) was as good as copper against bacterial spot. Double Nickel alone (two years of data in Geneva) and LifeGard alternated with copper (one year on Long Island) were as good as copper against bacterial speck. While neither product is registered (legal) for use against tomato canker, in research trials in Geneva, Double Nickel (one year) and LifeGard (two years) alternated with copper controlled canker as well as copper alone. So if you are replacing some copper sprays with either Double Nickel or LifeGard, you’ll likely notice some incidental bacterial canker protection, too.

New to using biopesticides? The New York State IPM Program has a new resource to help. Biopesticide profiles (scroll to bottom of page) for Double Nickel, LifeGard, and seven other products provide information on tank mix compatibility, shelf life, and other practical tips.

Screen shot of a website section entitled Biopesticide Profiles. PDFs of these profiles are available for Actinovate, Contans WG, Double Nickel, LifeGard, Regalia, Serifel, Stargus, Theia, and Timorex ACT
Follow the link in the text and scroll to the bottom of the page to find these biopesticide profiles from the NYSIPM program.

Changes in pesticide registrations occur constantly and human errors are possible. Read the label before applying any pesticide. The label is the law. No endorsement of companies is made or implied.


This post was written by Amara Dunn, Biocontrol Specialist with the NYSIPM program, and Chris Smart, Professor in the School of Integrative Plant Science, Plant Pathology and Plant-Microbe Biology Section at Cornell University. Support for this project was provided by the NY Farm Viability Institute.
Logo for the NY Farm Viability Institute

New from NYSIPM: Biopesticide Profiles

Screen shot of a website section entitled Biopesticide Profiles. PDFs of these profiles are available for Actinovate, Contans WG, Double Nickel, LifeGard, Regalia, Serifel, Stargus, Theia, and Timorex ACT
Follow the link in the text and scroll to the bottom of the page to find these biopesticide profiles from the NYSIPM program.

I’m excited to announce that the New York State IPM Program has a new resource – Biopesticide Profiles!

(Scroll down to the bottom of the page linked above, past the efficacy summaries, which are also cool.)

So far, we have profiles for nine biopesticides registered for use on various crops in NY (including one for use in home gardens) against plant diseases. I plan to add more profiles over time, and will definitely add some bioinsecticides in the future.

These profiles are not meant to replace pesticide labels; always read and follow the label and only use pesticides that are currently registered in your state or province. These profiles have practical details about how to use biopesticides most effectively, including information on mode of action, compatibility with other pesticides, best storage conditions, and shelf life. I’ve also included information on any known toxicity concerns for not just bees, but other beneficial insects like natural enemies of pests.

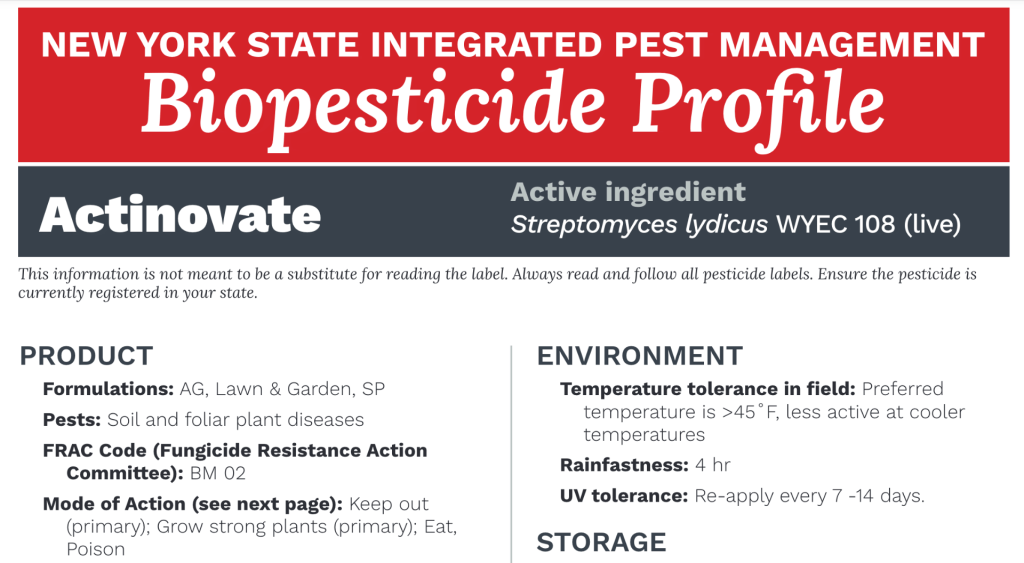
Screen shot of the NYSIPM Biopesticide Profile for Actinovate which contains the active ingredient Streptomyces lydicus WYEC 108 (alive). Other information includes the available formulations, types of pests targeted, the fungicide resistance action committee number, the mode of action, and the best environmental conditions under which to use it.
Just some of the practical information you can find on the NYSIPM biopesticide profiles.

I collected this information from pesticide labels, pesticide manufacturers, EPA registration documents, and peer-reviewed literature, to save you time when you’re considering using a biopesticide. But you should still always read the label.

Take a look and let me know what you think! Which biopesticides should be next on my list?


This post was written by Amara Dunn, Biocontrol Specialist with the NYSIPM program. Support for this project was provided by the NY Farm Viability Institute.
Logo for the NY Farm Viability Institute

Biopesticide modes of action

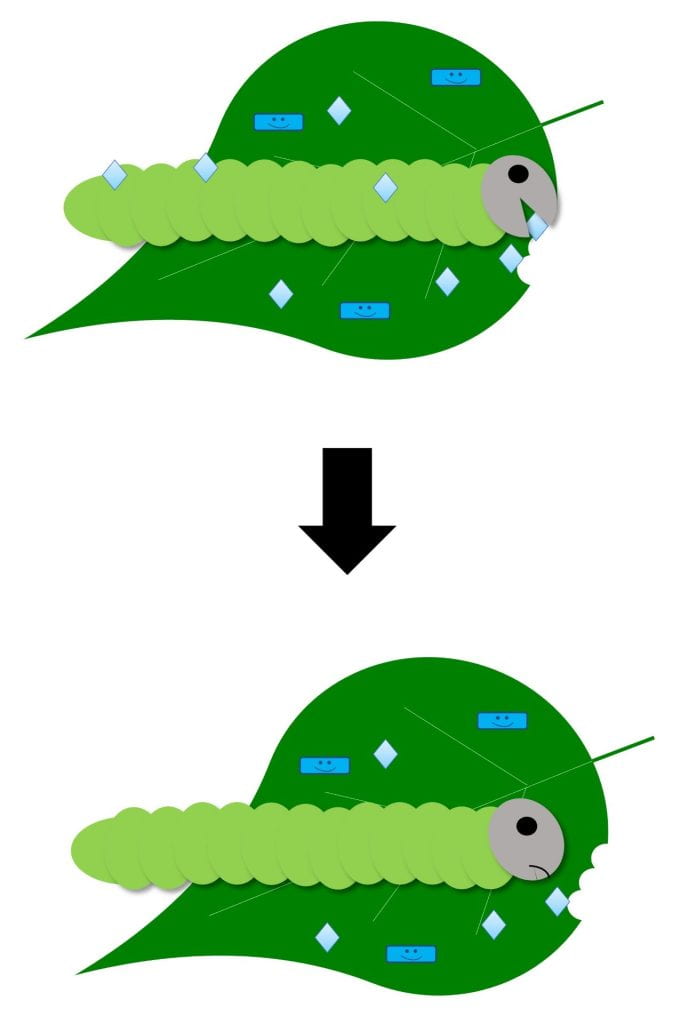
Diagram showing an unhappy-looking caterpillar that has stopped eating a leaf. Blue diamond shapes and pale blue rectangles with smiling faces are also on the leaf.
Biopesticides include microorganisms, plant extracts, and other naturally-derived compounds that control pests.

Biopesticides are one aspect of biological control. The active ingredients in biopesticides include microorganisms (microbes), plant extracts, and naturally-occurring chemicals (like potassium bicarbonate). As a result, some of the ways they control pests (their modes of action or MOAs) are different from conventional, synthetic chemical pesticides. Also, many of them have several MOAs, and not all MOAs apply to all pests listed on the label. If a biopesticide contains live microbes, and especially if its MOA requires the microbes to stay alive on the plant for some period of time after application, this also has important implications for how the product is stored and applied. Understanding the mode of action of a product will help you get the most out of it.

I like to break down biopesticide MOAs into the following categories:

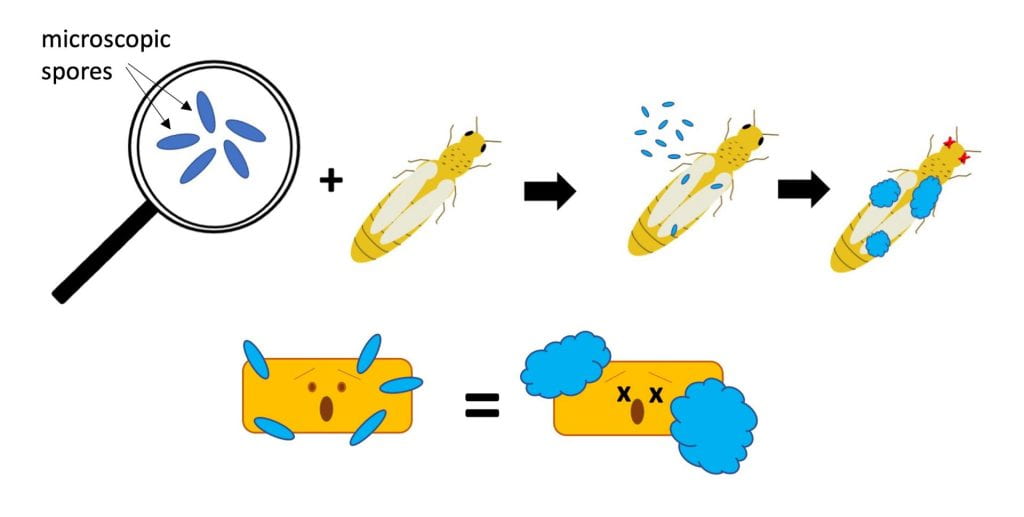
Diagrams - Tiny spores of insect-killing fungi land on the body of an insect, germinate, infect the insect, grow throughout its body, and eventually kill it. Below, a diagram shows blue spores contacting a yellow rectangle with a frightened face, representing a pathogen. The spores grow and kill the pathogen.
Eat – Some biopesticides contain living spores of a fungus (blue). These spores need to land on the insect pest or plant pathogen (yellow rectangle). Then they germinate (like a seed), invade and grow, eventually killing the pest. If the humidity is high enough, the fungus may even produce more spores and spread to other pests.

Eat live microbe grows on/in pest

Biopesticides with this MOA can work against insect pests (e.g., products that contain Beauveria bassiana) or plant diseases (e.g. Contans, which contains Paraconionthyrium minitans strain CON/M/91-08). Many biopesticides with this MOA contain fungal spores. These spores will germinate once they land on the insect or disease-causing pathogen, and may have temperature and/or humidity requirements for germination. Make sure you store the product correctly, confirm compatibility with other products before tank mixing or applying, and apply under recommended environmental conditions.


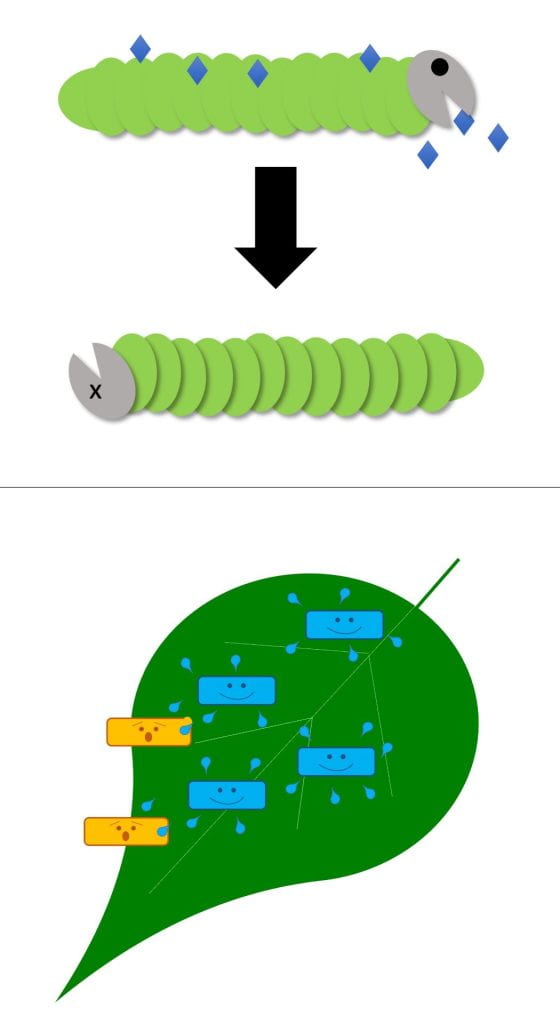
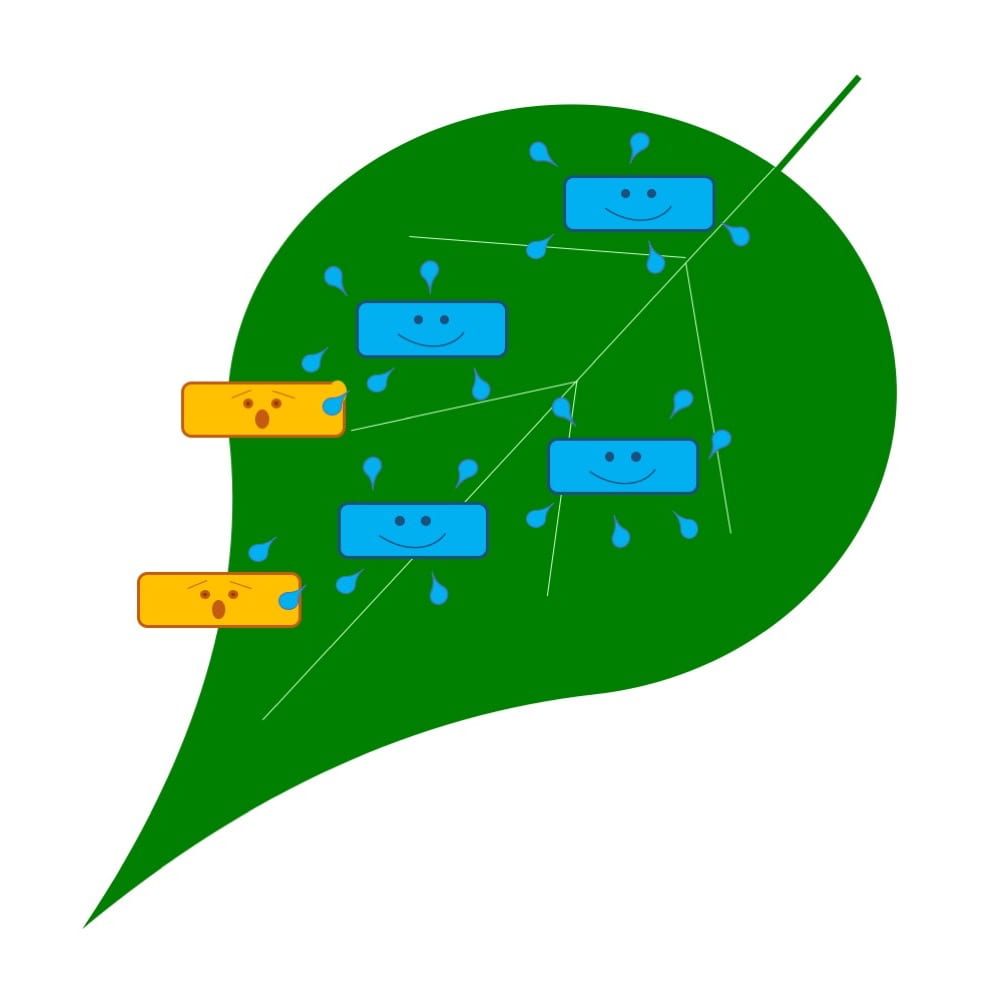
Diagram - A caterpillar eats and is sprayed with a bioinsecticide (blue diamonds), and then dies. Plant pathogens (yellow rectangles) are poisoned by biopesticide microbes (blue rectangles) and the antimicrobial compounds they produce (blue droplets).
Poison – Some biopesticides (blue diamonds or blue smiling rectangles with droplets) work much like conventional chemical pesticides. They directly kill or otherwise inhibit the insect pests (like this caterpillar) or plant pathogens (yellow rectangles with frightened faces) when they contact it or are eaten by it.

Poison – biopesticide (or its products) kills the pest directly

Biopesticides with this MOA can work against insect pests (like products containing Bacillus thuringiensis) or plant diseases (e.g., Double Nickel containing Bacillus amyloliquefacies strain D747, or products containing potassium bicarbonate). Obviously, potassium bicarbonate products do not contain live microbes. Some biopesticides that poison pests do have live microbes that continue to produce antimicrobial products after they are applied. Others work because of the compounds the microbes produced while the biopesticide was being made.


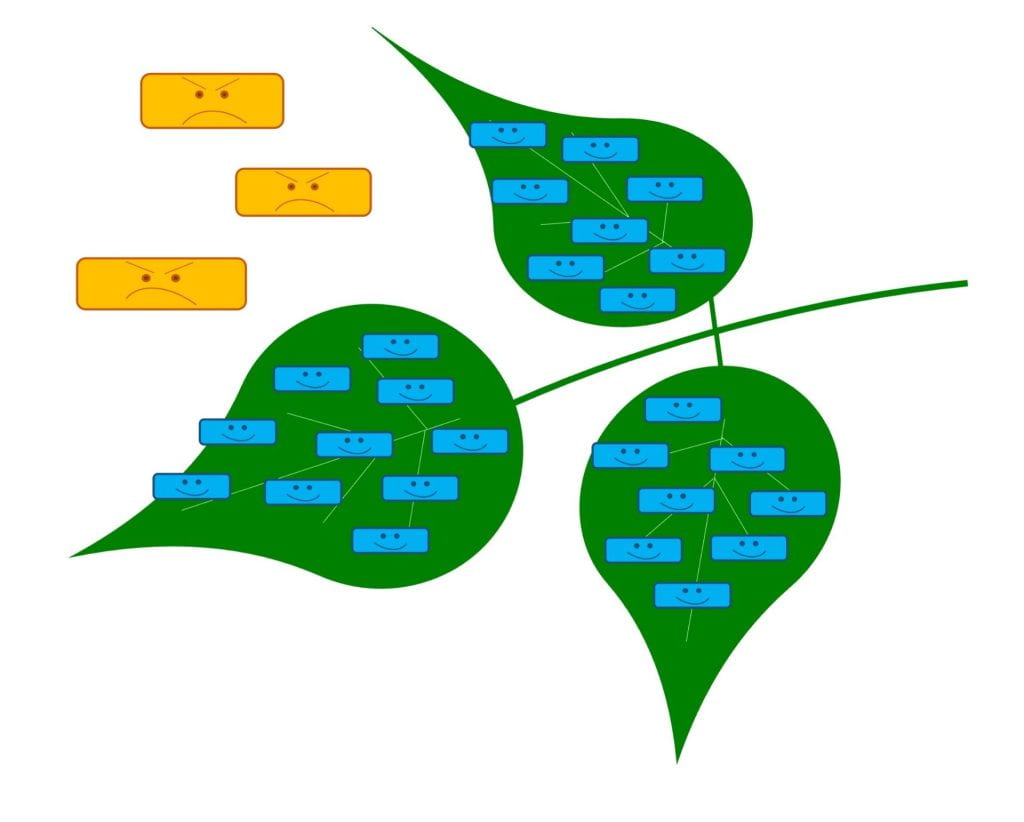
Green leaves covered with smiling blue rectangles. Yellow rectangles with angry faces are next to the leaves.
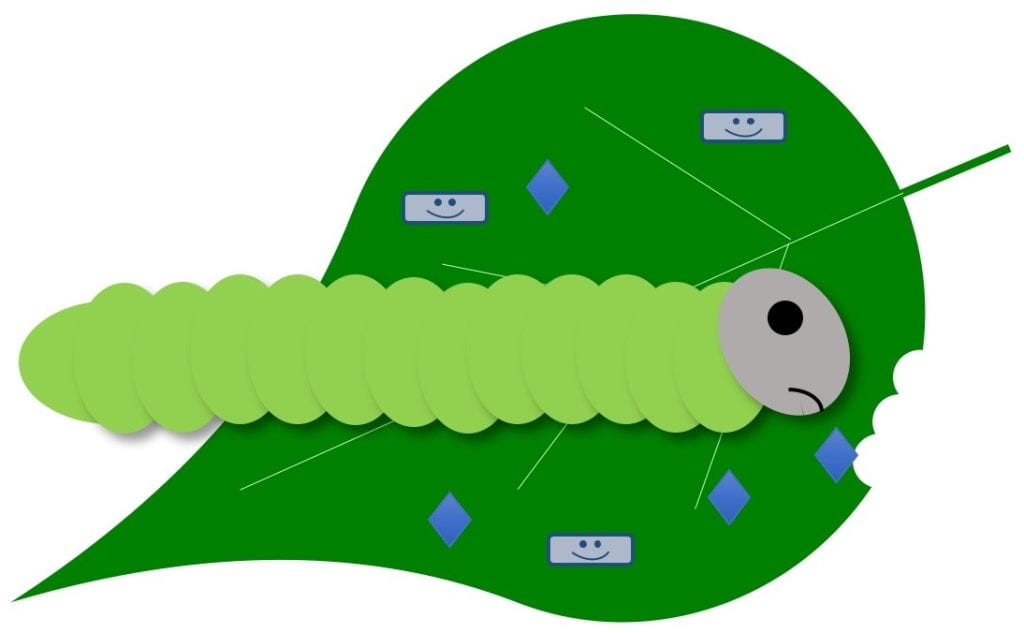
Keep out – Some biopesticides contain microbes (blue smiling rectangles) that grow on the plant. These beneficial microbes use up space and nutrients so there is no room for the pathogen (angry yellow rectangles.

Keep out – live microbe grows on plant, leaving no room for pests

Biopesticides with this MOA can work against plant disease (e.g., Actinovate which contains Streptomyces lydicus WYEC 108, or Serifel, which contains Bacillus amyloliquefaciens strain MBI 600) and may be bacteria or fungi. The microbes in biopesticides with this MOA must be alive when applied and need to be able to grow on the part of the plant that is being protected.


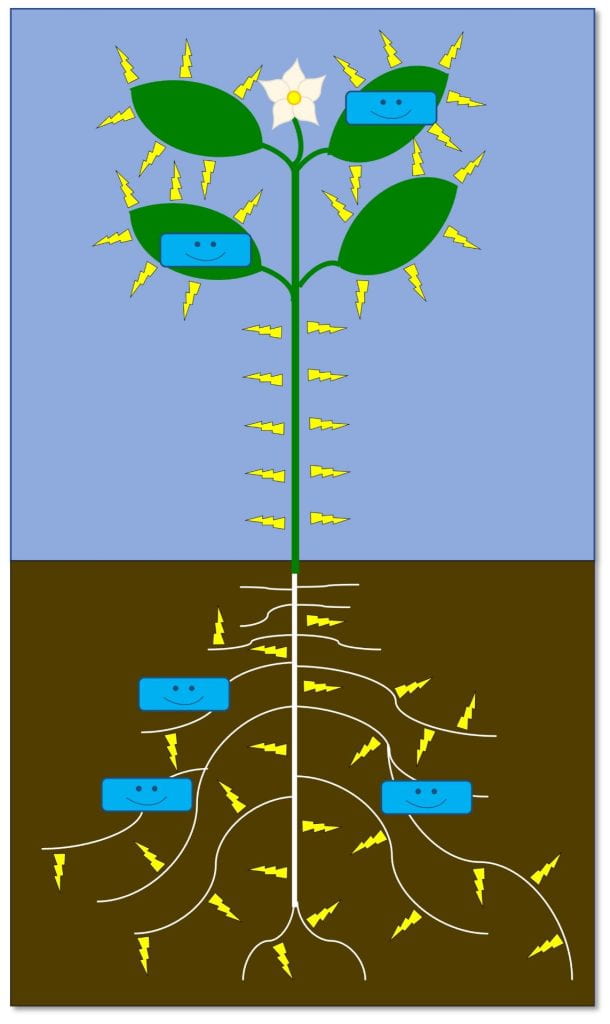
Diagram of a plant with blue smiling rectangles on both leaves and roots. Little yellow lightning bolts surround the roots and leaves.
Turn on resistance – Some biopesticides contain microbes (blue smiling rectangles) or other natural compounds that activate the plants defense system, so that it’s ready when it encounters a pathogen.

Turn on resistance – turns on the plant’s defenses before pest attacks

As far as I know, these biopesticides only work against plant diseases, but as new products are developed, or as we learn more about existing biopesticides, this may change. Some examples include Regalia (giant knotweed extract) and Lifeguard WG (Bacillus mycoides isolate J). Some of these products contain live microbes that need to stay alive (like LifeGard), while others do not. These biopesticides need to be applied before infection.


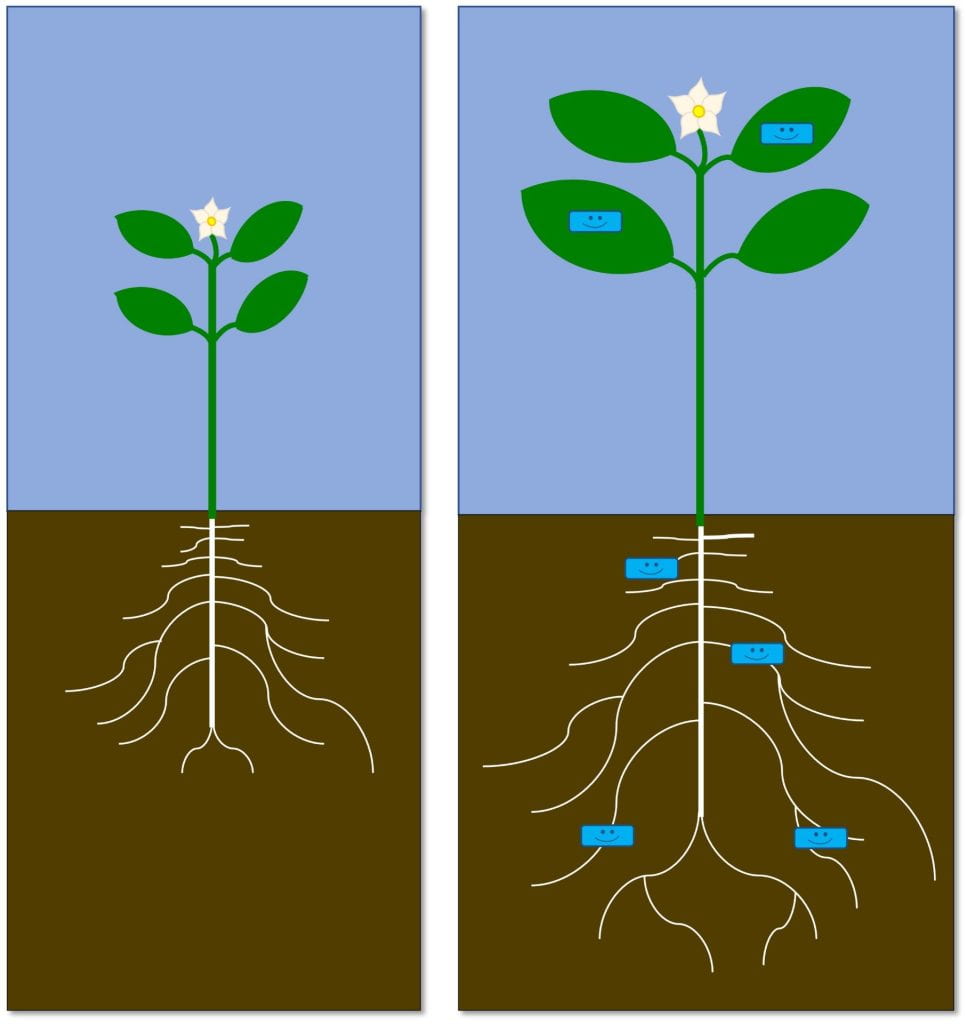
Diagram - The plant on the left has no smiling blue rectangles on leaves or roots. The plant on the right has these blue rectangles on roots and leaves and is larger.
Grow strong plants – Some biopesticides contain microbes (blue smiling rectangles) or other natural compounds that enable the plant to grow stronger and healthier. As a result, the plant can better withstand attack from a pest.

Grow strong plants – makes plant stronger, healthier, more resilient

These biopesticides primarily work against plant diseases. Some examples include: Serenade (Bacillus subtilis strain QST 713), RootShield (Trichoderma harzianum), and Sil-Matrix (potassium silicate). Some of these products contain live microbes that need to stay alive, while others do not (e.g., Sil-Matrix). These biopesticides need to be applied before infection.


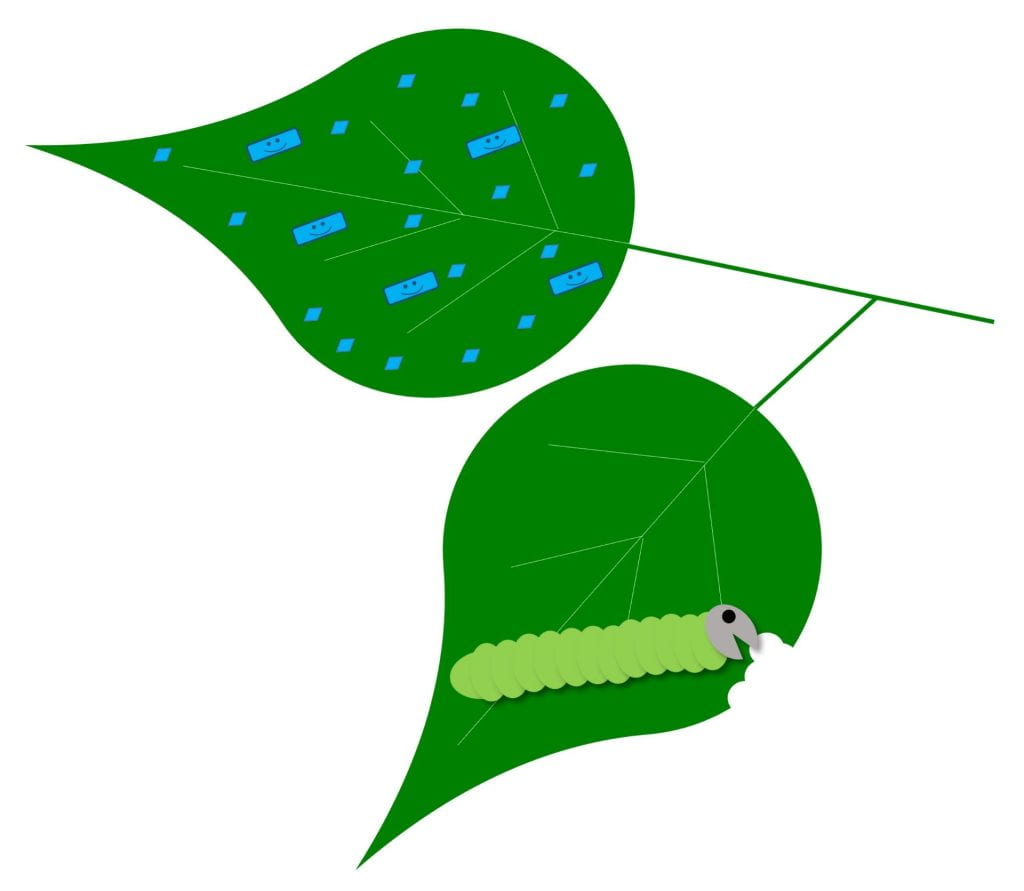
Diagram - One leaf is covered with blue diamonds and smiling rectangles (bioinsecticide), but the other is not. The caterpillar is feeding on the leaf that has no bioinsecticide.
Repel – Some bioinsecticides (blue diamonds and blue rectangles with smiling faces) protect plants because they repel insect and mite pests.

Repel – pest avoids plants treated with biopesticide

Biopesticides with this MOA can work against insect pests, but perhaps only on certain insect life stages. Some products with this MOA could contain live microbes, while others do not. You can evaluate the effectiveness of products with this MOA, not by scouting for dead insects, but by looking for reduced damage or lower insect populations on treated plants. Examples include: Grandevo WDG (Chromobacterium subtsugae strain PRAA4-1 and its spent fermentation products) and products containing azadirachtin.


Diagram - A caterpillar eats or comes in contact with a bioinsecticide, and then stops feeding.
Stop feeding – Some bioinsecticides (diamonds and rectangles on the leaf) cause insect and mite pests to lose their appetites.

Stop feeding – stops pest from feeding; pest eventually starves

Biopesticides with this MOA can work against insect pests either by contact or ingestion and may only be effective against insects of certain ages or life stages. It depends on the biopesticide and pest. Examples include insect-killing viruses and some types of Bacillus thuringiensis products. Some products with this MOA could contain live microbes, while others do not. Live pests will still be present for some time after applying a product that works in this way, since the pests die of starvation. Watch for feeding damage to stop or a reduction in insect numbers over time to know if the product is working.


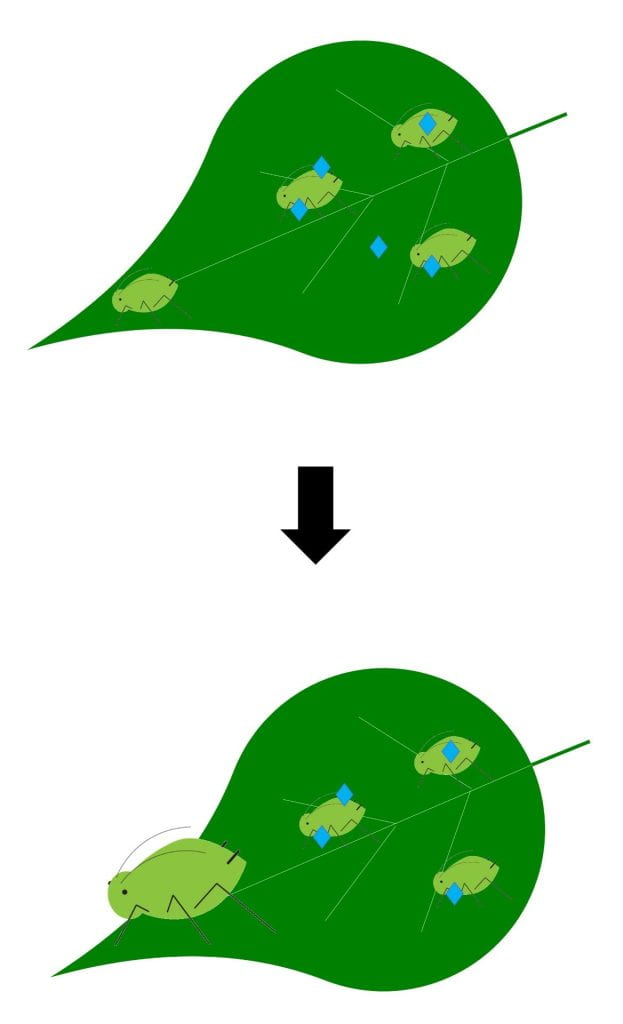
Diagram – Three aphids on a leaf, two of which are exposed to blue diamonds. The aphids exposed to the diamonds stay the same size. Another aphid that was not exposed grows normally.
Stop growth – Some bioinsecticides (blue diamonds in this diagram) don’t kill insects and mites outright, but they can prevent them from molting and growing into the next life stage. Pests that can’t move on to the next life stage will eventually die.

Stop growth – stops pest from growing or molting; pest eventually dies

Biopesticides with this MOA may work against insect pests either by contact or ingestion and may only be effective against pests of certain ages or life stage. It depends on the biopesticide and pest. Examples include Venerate (Burkholderia spp. strain A396) and some products containing azadirachtin. Some products with this MOA could contain live microbes, while others do not. Products with this MOA will not kill pests immediately, but will prevent them from growing or molting. Watch for insect populations to decline over time, but do not expect pests to die immediately.


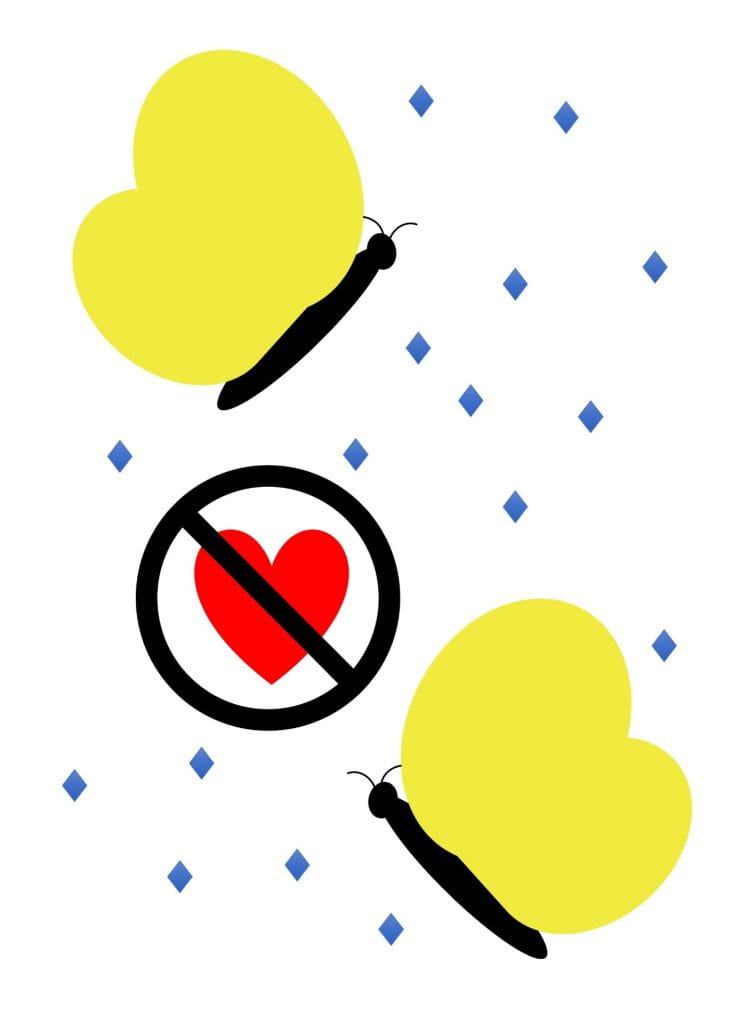
Diagram - Two yellow moths surrounded by blue diamonds. A red heart has a line through it.
Stop reproduction – Pheromones (represented here by blue diamonds) are a type of bioinsecticide that confuses insects looking for a mate. As a result, males and females can’t find each other, don’t mate, and females don’t lay eggs.
Stop reproduction – hampers pests’ ability to find a mate or produce eggs

The two main groups of biopesticides I know of with this MOA are (1) pheromones that make it hard for male and female insects to find each other, or (2) products that reduce the number of eggs female insects lay. Grandevo (Chromobacterium subtsugae strain PRAA4-1 and spent fermentation products) is an example of the later, but may not work in this way against all ages and species of pests listed on the label. The products I know of with this MOA do not contain live microbes. This mode of action will reduce insect populations in subsequent generations, not the current one. So use it on a pest with multiple generations per season, or in combination with other MOAs.


Things to keep in mind:

If the biopesticide contains live microbes, make sure you…

  • store the biopesticide correctly (and for the correct amount of time); check the label.
  • confirm compatibility of the biopesticide with other products before tank mixing or applying; read the label and contact the manufacturer with questions.

In addition, if the biopesticide contains microbes that need to stay alive for some period of time after application in order to be effective, make sure you also…

  • pay special attention to the recommended optimal environmental conditions for application; start by reading the label.

Remember!

  • Biopesticides are pesticides. Their labels are the law. Read the labels and follow them, along with other pesticide application laws in your state.
  • Not all biopesticides are permitted for use in certified organic production. Check with your certifier if you have questions.


Questions to ask when you are considering/purchasing a biopesticide

The manufacturer or dealer should be able to tell you:

  • How does it work (MOA)?
  • Is it alive? Does it need to stay alive to work?
  • Special instructions for storage or use? (e.g., temperature, spray tank pH, time of day)
  • Is it compatible (in the tank, greenhouse, or field) with other products in use (e.g., pesticides, fertilizers)?


Additional biopesticide Resources


This post was written by Amara Dunn, Biocontrol Specialist with the NYSIPM program.

Which biopesticides work? Updated resources

A caterpillar eats or comes in contact with a bioinsecticide that causes the caterpillar to stop feeding.
Some bioinsecticides cause insect and mite pests to lose their appetites. Depending on the bioinsecticide, it either needs to contact the pest or be eaten by it.

Biological pesticides (biopesticides) are pesticides with active ingredients that are considered natural. According to the EPA they “include naturally occurring substances…microorganisms that control pests…and pesticidal substances produced by plants containing added genetic material.” This last category is more often recognized as certain (but not all) genetically modified organisms (GMOs). The “naturally occurring substances” (plant extracts, some natural chemicals) and microorganisms (bacteria, fungi, viruses) are the focus of today’s post. There’s a deeper dive into how biopesticides work in another blog post.

Biopesticides can be an important tool for integrated pest management because some of them may pose less risk to people or the environment than some conventional chemical pesticides. (But always read and follow the label on biopesticides to ensure you are minimizing risks!)

If you are considering using a biopesticide as part of your IPM program, you will of course want to know whether or not it is effective against a particular pest on a particular crop. A few years ago I wrote a post about efficacy of biocontrol. With some great help, I’ve been collecting summaries of efficacy trials on biopesticides conducted by universities. These summaries are available as downloadable Microsoft Excel spreadsheets for the following crops:

  • Berries
  • Field crops
  • Grapes
  • Greenhouse, nursery, and ornamental crops
  • Hemp
  • Hops
  • Tree fruit

The Cornell Vegetables website has some excellent information about biopesticides for vegetable diseases.

Green leaf with blue rectangles with smiling faces representing microbes as natural enemies of the pest microbes (yellow rectangles with shocked faces). The blue microbes are producing blue droplets (representing antimicrobial compounds).
Microbes used to control pests are biopesticides. In this conceptual diagram, the happy blue microbes are producing antimicrobial compounds that are killing the plant pathogens (represented by yellow rectangles with shocked faces).

Once you download a spreadsheet, take a look at the ‘Notes’ sheet for some important background information, then look at the data on either the ‘Diseases’ or the ‘Arthropods’ (insects and mites) sheet. You can sort the data on either sheet by crop, pest name, name of the product, active ingredient, or other column headings. I’ve included both a simple rating of efficacy (-, +/-, +, ++), and a numerical summary that shows how much each product improved control compared to doing nothing to control the pest.

The spreadsheets do indicate whether each product was registered in New York State at the time the sheet was last reviewed. Remember that you must confirm that the product you want to use is currently registered in New York, and that the label includes your setting, crop, and pest. You can check for current registration and download NYS pesticide labels from NYSPAD.

If you are not able to open an Excel spreadsheet, please let me know and I’m happy to get you the info in a format that works for you.


This work is supported by NYS Departments of Environmental Conservation and Agriculture and Markets, as well as the National Institute of Food and Agriculture, Crop Protection and Pest Management Extension Implementation Program, award number 2021-70006-35672.

This post was written by Amara Dunn, Biocontrol Specialist with the NYSIPM program.

IPM for establishing Christmas trees: Survival and growth in the first season

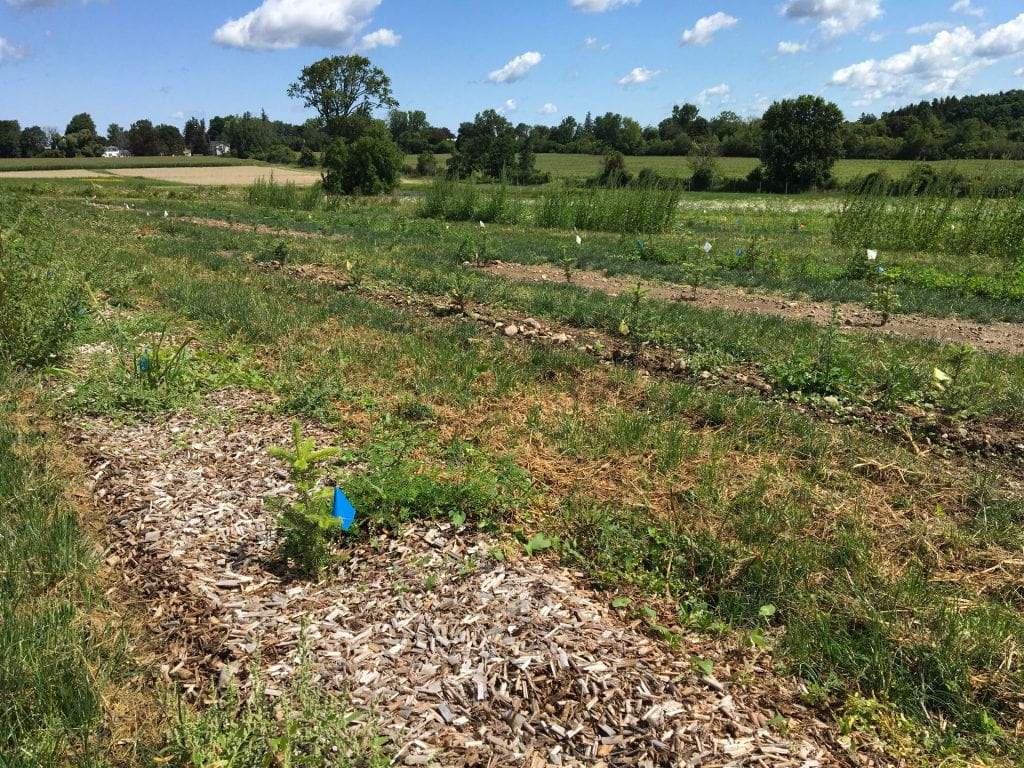
Rows of small Christmas trees growing in a field on a sunny afternoon; some are surrounded by wood chip mulch, some by cultivated ground, some by bare ground, and some by tall weeds.
The different weed management strategies we are comparing certainly look different in the field. But how do they impact tree growth and quality?

Back in June we introduced you to a new project comparing different methods for weed and root disease management when establishing Christmas tree seedlings. Recall that this is a collaboration among Bryan Brown, Amara Dunn, Brian Eshenaur, Betsy Lamb, and Lynn Sosnoskie. We wrapped up our first season in October, and we have a first look at some of the data. In this post, we’ll focus on tree survival and tree growth. There’s a lot more weed data!

Treatments

Let’s start with a quick reminder of the treatments we were comparing. Each row of 28 trees received the same weed management treatment. Each row was also divided into four plots of seven trees each. Each plot within a row received a different root treatment. Here’s a map of how the treatments were laid out in the field.

Weed management (in-row, within a 30” band around the row of trees; between row zones were seeded with grass and mowed 4 times) :

  • Cultivate – three times early in the season using a tractor drawn KULT Kress Argus Toolbar with sweeps, finger weeders, and a rear side-shift adjustment
  • Herbicide – conventional active ingredients (oxyfluorfen and pendimethalin applied shortly after planting, with a fall application of glyphosate) as a control treatment
  • Mow – mow about every two weeks with a walk-behind mower
  • Mulch – 3 inches of chipped shrub willow mulch
  • Untreated – No weed management at all

Root disease management:

  • ProPhyt (active ingredient: potassium phosphite) – a biopesticide applied by dipping bare roots of seedlings just before planting; mixed 1.28 fl oz in 2 gallons of water for 140 trees (11 fl oz/A if you plant 1,200 trees/A)
  • RootShield PLUS WP (active ingredient: Trichoderma harzianum Rifai strain T-22 and Trichoderma virens strain G-41) – a biopesticide applied twice (the day after planting and 7 weeks later) as a drench around each tree (24 oz/A in 171 gallons of water/A)
  • Subdue Maxx – a conventional fungicide applied twice (the day after planting and 5 months later) as a soil-directed spray (2.5 pt/A in 140 gal/A in a 6-inch band on either side of the row of trees). We made the application with a hand-pump backpack sprayer fitted with a TeeJet TTI11005 nozzle with a shield rotated parallel to the row of trees. The maximum pressure possible with this sprayer is 60 psi. After application, we applied an extra 0.45 gallon of water per plot of 7 trees with the same sprayer (280 gal/A additional water).
  • Water – 1 pt of water poured around each tree at planting, as a control.

What we measured

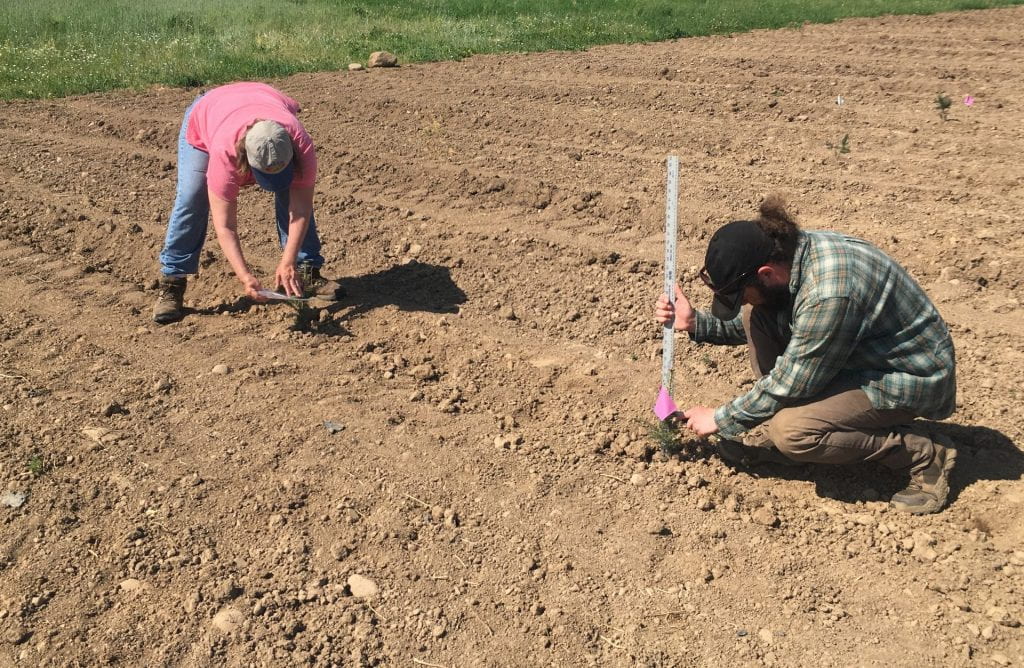
We’re interested in how the weed and root disease treatments impact survival, growth, and quality of these trees. Thanks to our excellent technicians, Marcus and Erik, for helping us measure all of these trees! Betsy and Amara were helping, too, but in this picture Amara is behind the camera.

A woman in a pink shirt comparing a small Christmas tree to a piece of paper, while a man in a plaid shirt measures the height of a small Christmas tree seedling; both are in a newly planted field with freshly tilled soil
Betsy and Marcus measuring trees and evaluating needle color in May.

On May 25 (about a week after planting) and again on October 6 we measured the height of each tree (from the soil to the tallest part of the tree, even if it wasn’t the leader anymore) and the diameter of the tree trunk 4 inches above the soil. In both May and October, we also rated the color of the needles using this scale. However, we only used: 2 (darkest green), 5 (medium green), 7 (paler green), and 9 (yellow or brown).

Of course, measuring and rating each tree also allowed us to take note of which trees had died (versus a few that unfortunately succumbed to “mower blight”).

What we found

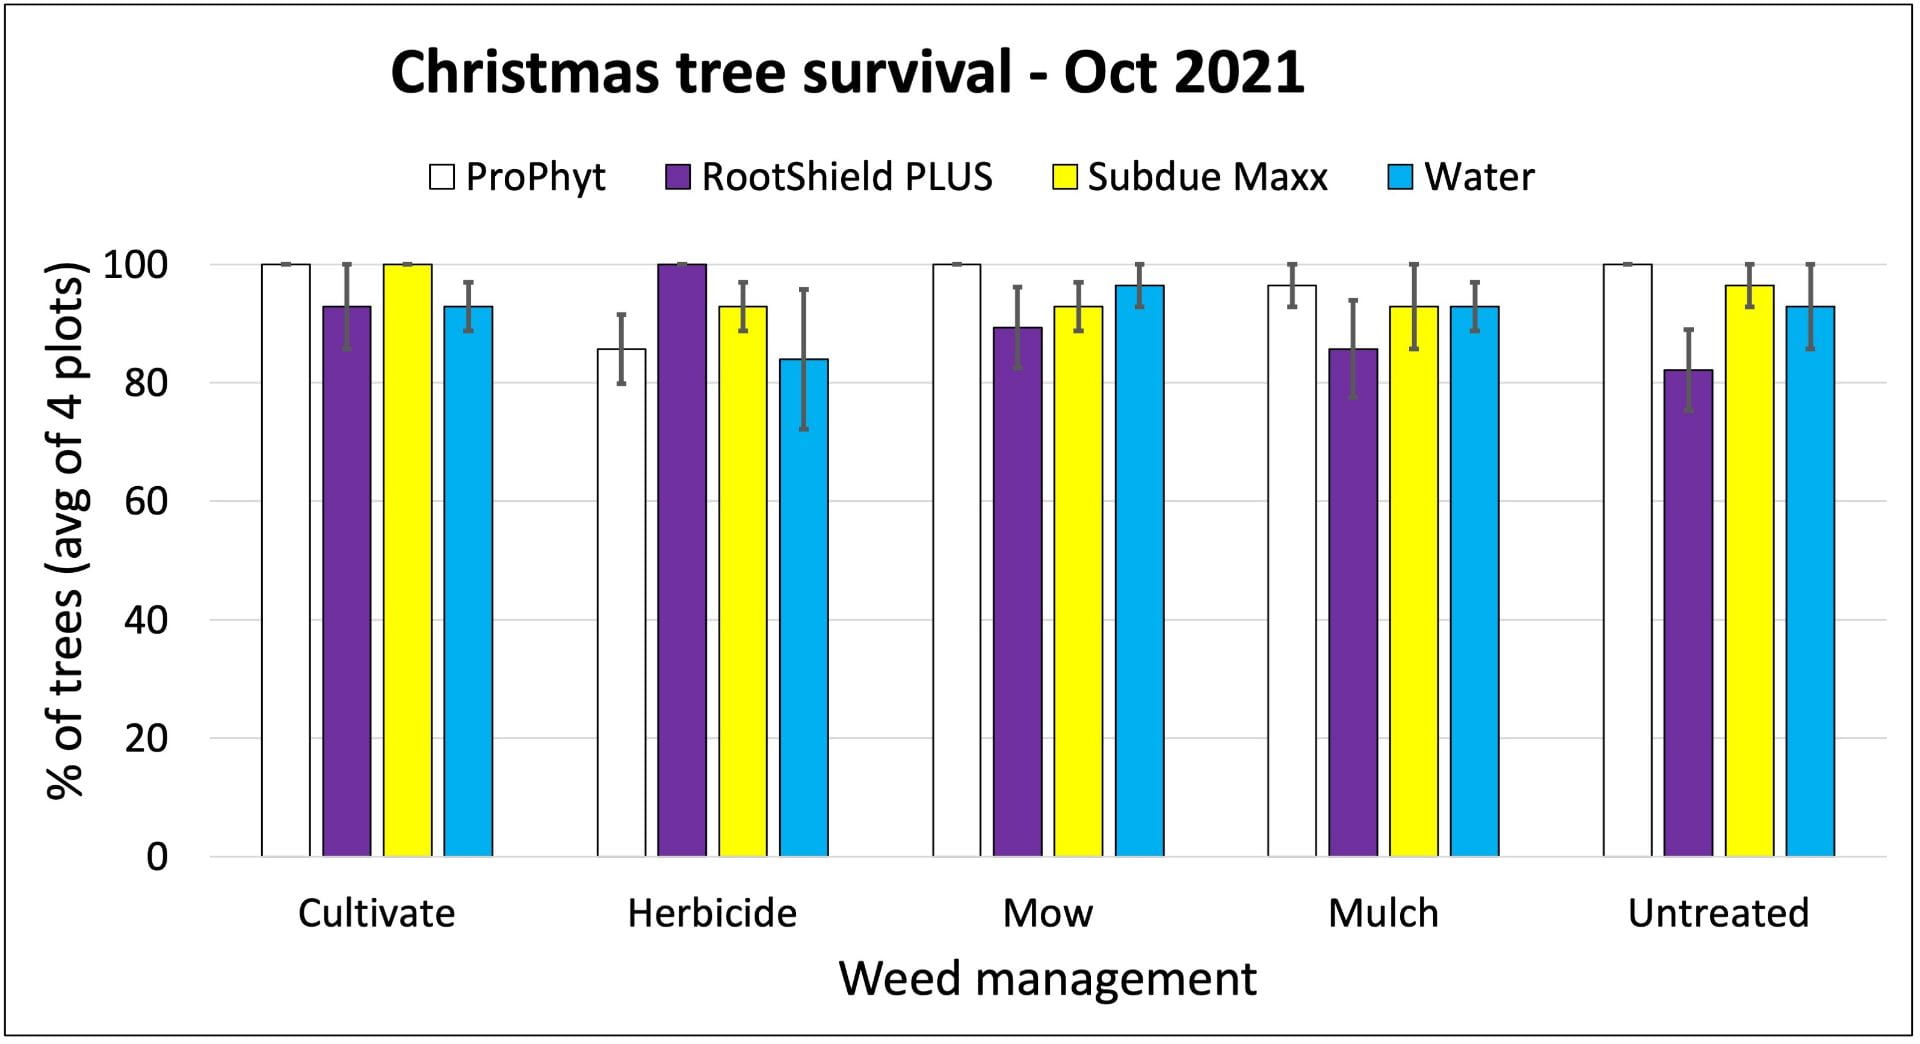
Bar graph showing that trees generally survived better when treated with ProPhyt, except not if weeds were managed with herbicide. The impact of root treatment varied, depending on which weed management strategy was used.
Percentage of trees in each plot (out of seven trees total) that were still alive by October 2021, not counting a couple that were accidentally mowed. Each bar is the average of four plots for each combination of root treatment (color of bars) and weed management strategy (along x-axis). The lines on each bar show variability (one standard error above and below the mean value).

It’s too early to know for sure, but it’s possible that the root treatment that results in the best seedling survival might depend on which weed management strategy you use. For example, after just one year, the RootShield PLUS-treated trees did better than the ProPhyt-treated trees where herbicide was used, but not where the weeds were allowed to grow unchecked (‘Untreated’). We haven’t done a statistical analysis on the data, yet, but the little lines at the top of each bar are an indication of the amount of variability amongst the four plots in each treatment (one standard error above and below the mean percent survival, for those who might be interested).

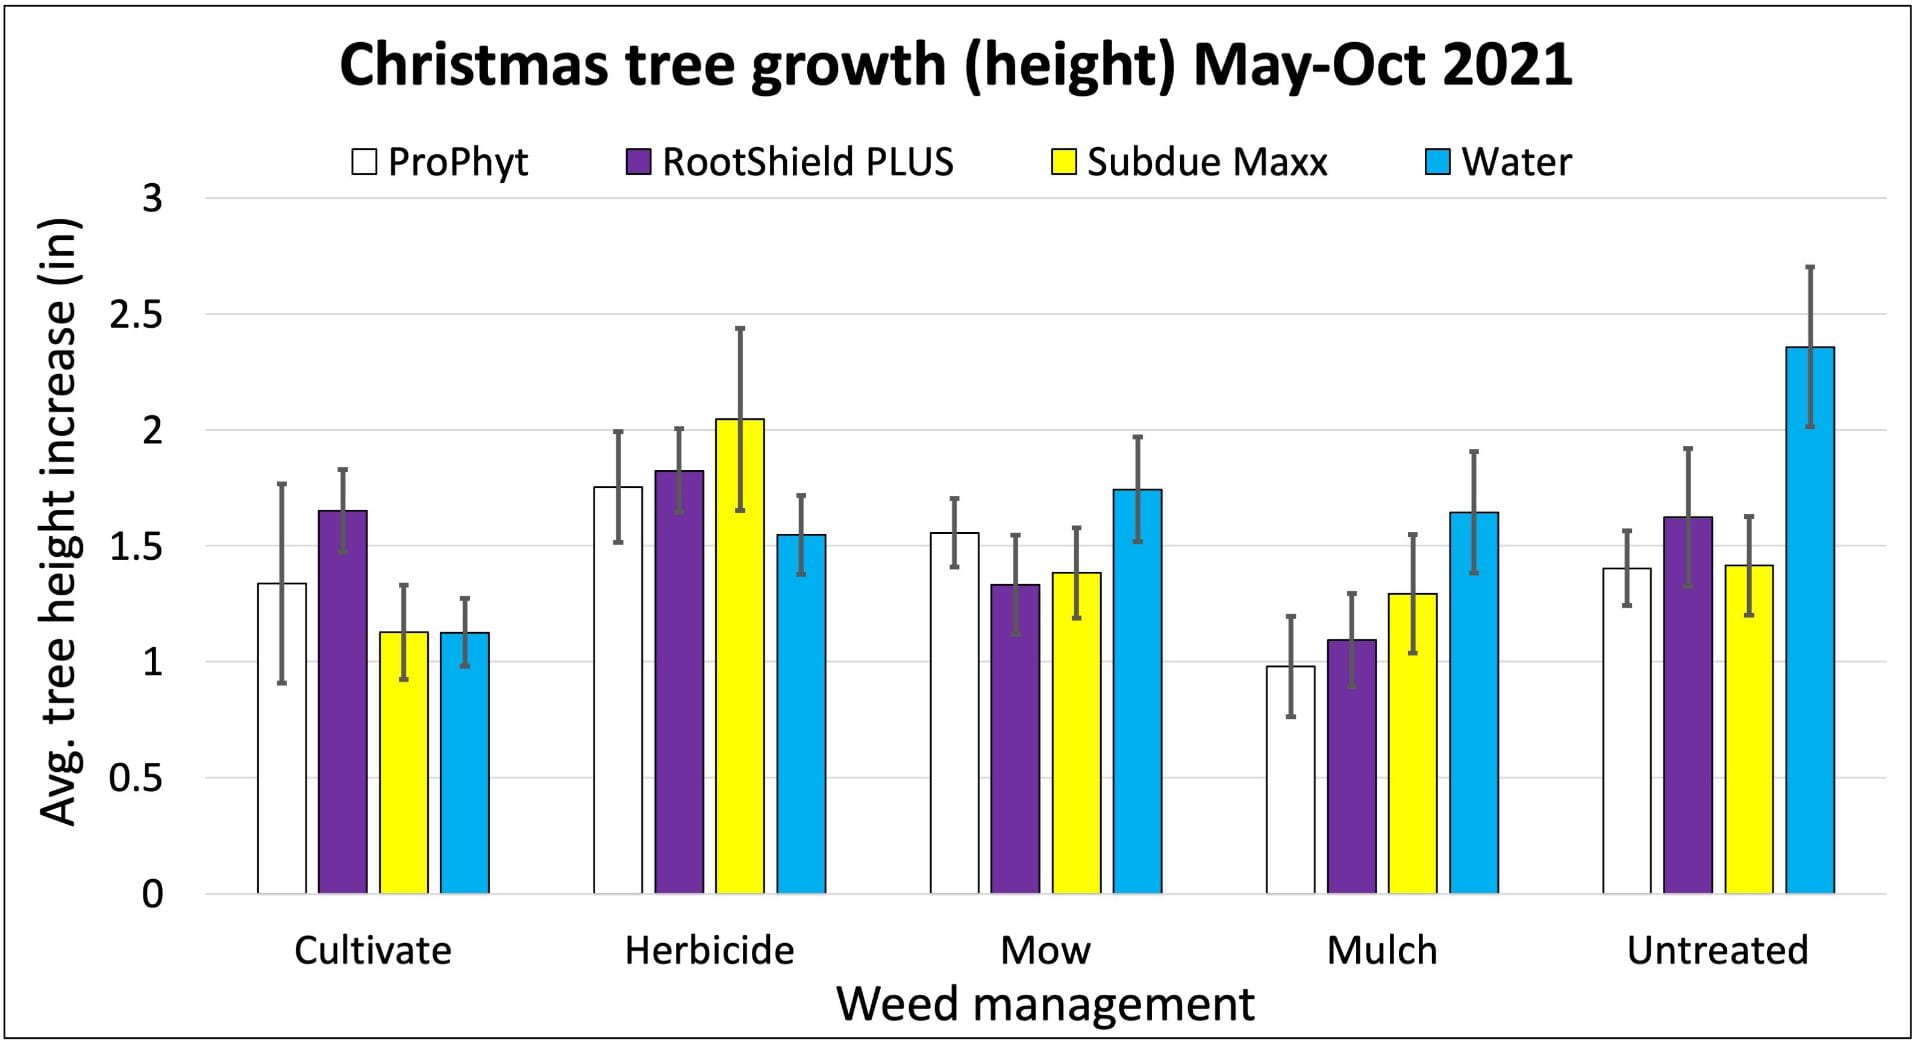
Bar graph showing that trees might have grown slightly more when weeds were managed with herbicides. The impact of root treatment varied, depending on which weed management strategy was used.
Change in height of Christmas trees from May to October 2021. Each bar is the average of up to 28 trees (7 trees in each of 4 plots) for each combination of root treatment (color of bars) and weed management strategy (along x-axis). The lines on each bar show variability (one standard error above and below the mean value).

These Fraser fir seedlings grew between 1 and 2.5 inches during their first season. Much like the tree survival, the root treatment that produced the most growth wasn’t consistent across all weed management strategies. Results for tree trunk diameter were similar.

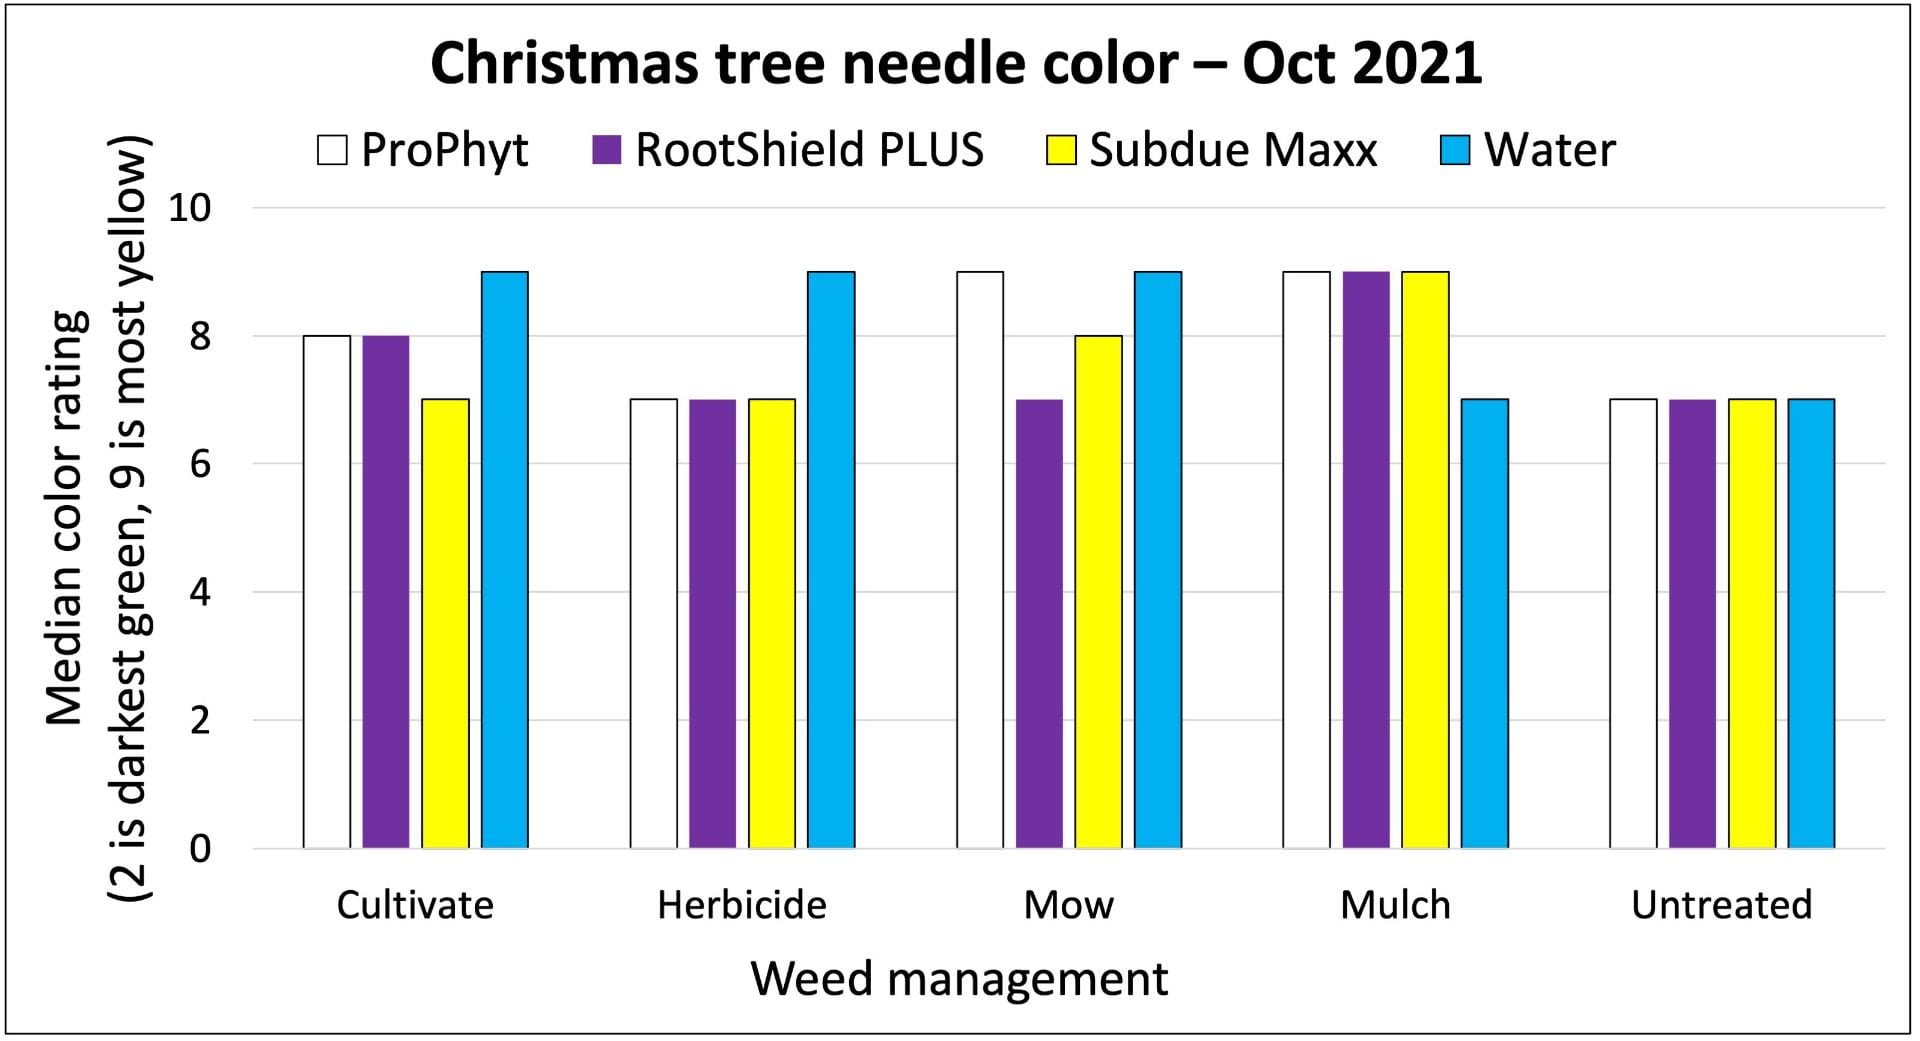
Bar graph showing that needle color might be slightly darker in the plots that were treated with herbicide or no weed management. The impact of root treatment varied, depending on which weed management strategy was used.
Average needle color when trees were rated in October. Lower numbers indicate darker green color. Each bar is the median value of up to 28 trees (7 trees in each of 4 plots) for each combination of root treatment (color of bars) and weed management strategy (along x-axis).

Recall that needle color was rated as 2 (darkest green), 5, 7, or 9 (most yellow or brown). So on this graph, shorter bars indicate better needle color. Also, this rating scale impacted how we summarized the data. Instead of taking the mean needle rating, we used the median. (Here’s a quick refresher on the difference.) And the graph doesn’t have those little lines to summarize the variability in each treatment. Too early to draw firm conclusions, but again, there might be some interactions between root treatment and weed management strategy.

What does it cost?

Economic risk is one of the risks we seek to reduce through IPM, so we’ve been keeping track of the costs associated with our pest management strategies. Based on the way we applied the root treatments and some local price estimates, here’s what we would have spent per acre for these treatments, assuming we planted 1,200 trees on each acre (that’s 6 ft x 6 ft spacing).


Fungicide Rate/A Number of applications Cost/A (Supplies) Cost/A (Labor1)
ProPhyt 11 fl oz2 1 $4 $1,037
RootShield PLUS WP 24 oz3 2 $123 $4,150
Subdue Maxx 2.5 pt3 2 $82 $2,074
Water 1 $0 $2,075

1We assumed a labor rate of $20/hr. These costs were calculated based on the time it took us to apply the products. This includes drenching each tree by hand (RootShield PLUS WP and water) and applying Subdue Maxx (and additional water to move it into the soil) with a backpack sprayer. On a larger scale, there’s surely a more efficient way to do this.

2Seedling roots were dipped in a ProPhyt solution prior to planting. The rate on the label is 4 pt/100 gallons of water. We mixed up 2 gallons of root dip solution (containing 1.28 fl oz of ProPhyt) to treat 140 trees. If we had used a fresh 2 gallons for every set of 140 trees, we would have used 11 fl oz of ProPhyt on an acre of 1,200 trees.

3Because RootShield PLUS WP was applied as a drench to each tree and Subdue Maxx was applied as a soil-directed spray banded on either side of the row, these rates are per acre of ground to which pesticide was applied. This is less than the total space taken up by these trees in the field. Read and follow the pesticide label for instructions on calculating quantity of product needed for banded applications.

And here’s a summary of our weed management costs. You can see all the details of these costs (including labor and supplies) here.

In-row weed management Cost/A (labor and supplies)
Cultivate $248
Herbicide $86
Mulch $1,153*
Mow $293
Untreated $0

*Assumes woodchips can be obtained locally at no cost

Take home

With only one season of data, it’s too early to draw conclusions about the effectiveness (or cost effectiveness) of each treatment. So far, survival of trees treated with ProPhyt is looking very good across most weed management strategies. And we’re seeing some indication that the best (in terms of tree survival, growth, or color) root treatment to use may vary depending on what you’re doing to manage weeds.

In late October we also dug up five dead trees and sent them to the Cornell Diagnostic lab to check for Phytophthora. The trees had been dead for a while, so they were only able to test for the presence of any Phytophthora species (which could include some that don’t cause disease on Christmas trees). Four out of five trees came back positive, which makes us feel more confident that we picked a good field for this trial…if by “good” you mean one where trees will be exposed to Phytophthora. For the purposes of this project, that’s exactly what we mean.

Please let us know if you have questions and stay tuned for more updates on this project. We’ve got at least two more years to go! You can check back on this blog (subscribe so you’ll know when new posts are available!), follow Lynn Sosnoskie and Amara Dunn on Twitter or on Instagram (@specialtycropweedscience and @biocontrol.nysipm), or check out Bryan Brown’s webpage. We’ll also be hosting another field event in 2022 and hope to provide updates at future Christmas Tree Farmers Association of NY meetings.

USDA logo, accompanied by the words: National Institute of Food and Agriculture, U.S. Department of Agriculture

This work is supported by Agriculture and Food Research Initiative – Foundational and Applied Science Grant no. 2021-68008-34179/project accession no. 1025660  from the USDA National Institute of Food and Agriculture.


This post was written by Amara Dunn, Biocontrol Specialist with the NYSIPM program, with helpful input from project collaborators. All images are hers, unless otherwise noted.

Introducing a new Christmas tree project

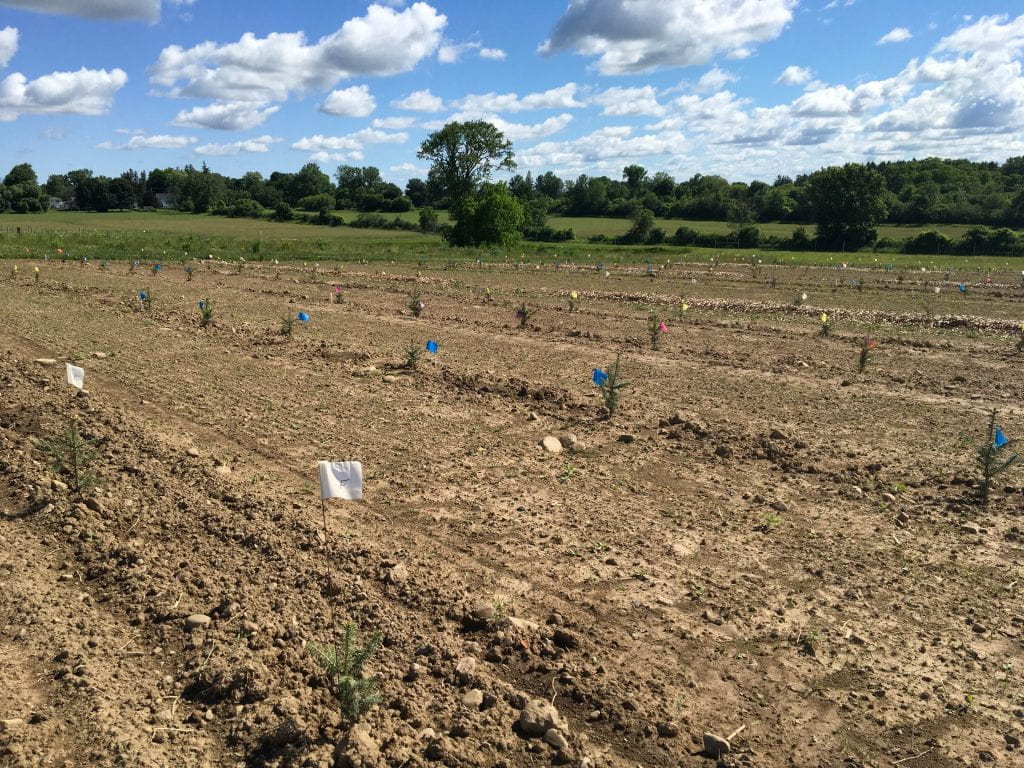
Field with mostly bare ground and small Christmas tree seedlings, each marked by a flag. In the background are some trees and a blue sky with puffy clouds.
We planted a new field of Christmas trees this spring!

If you’ve been following this blog for a bit, you might recall that the beneficial insect habitat plots I’ve been helping to establish and monitor with my colleagues Betsy Lamb and Brian Eshenaur are located on the edges of a field of Christmas trees. Once the trees get a bit bigger, we’ll be able to start assessing whether trees closer to these wildflowers have fewer pests or not.

New in 2021, I’m collaborating with Bryan Brown, Brian Eshenaur, Betsy Lamb, and Lynn Sosnoskie on a three-year project funded by the USDA to look at IPM when you’re establishing a new field of Christmas trees. An important part of IPM is the integration of multiple strategies when managing pests. So in this project we’re looking at some tools for managing both weeds and root diseases (specifically Phytophthora).

Weeds

Our weed management strategies include:

  • Mulching with approximately 3 inches of chipped shrub willow
  • Cultivating three times early in the season using a KULT Kress Argus Toolbar with rear side-shift adjustment pulled by a tractor
  • Mowing grass seeded around the trees
  • Conventional herbicides (oxyfluorfen and pendimethalin applied shortly after planting, with the possibility of additional applications depending on the length of the residual control) as a control treatment
  • No weed management at all (another control treatment)

We planted 560 Fraser firs in 20 rows on May 19th, and four of these rows will be receiving each of these different weed management treatments. So far, we’ve spread mulch…

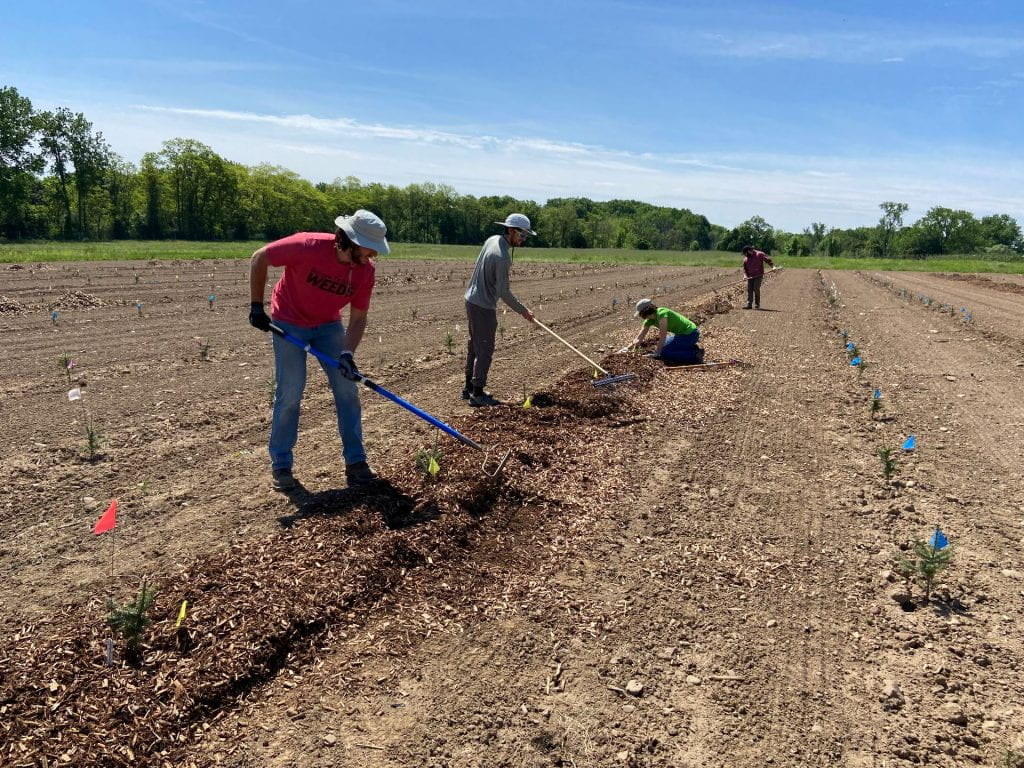
Four people spreading mulch around small Christmas tree seedlings in a field with rakes or by hand.
Mulch was dumped in small piles along the row of trees, and we raked it in to place. Photo taken by Lynn Sosnoskie.

…and applied herbicides.

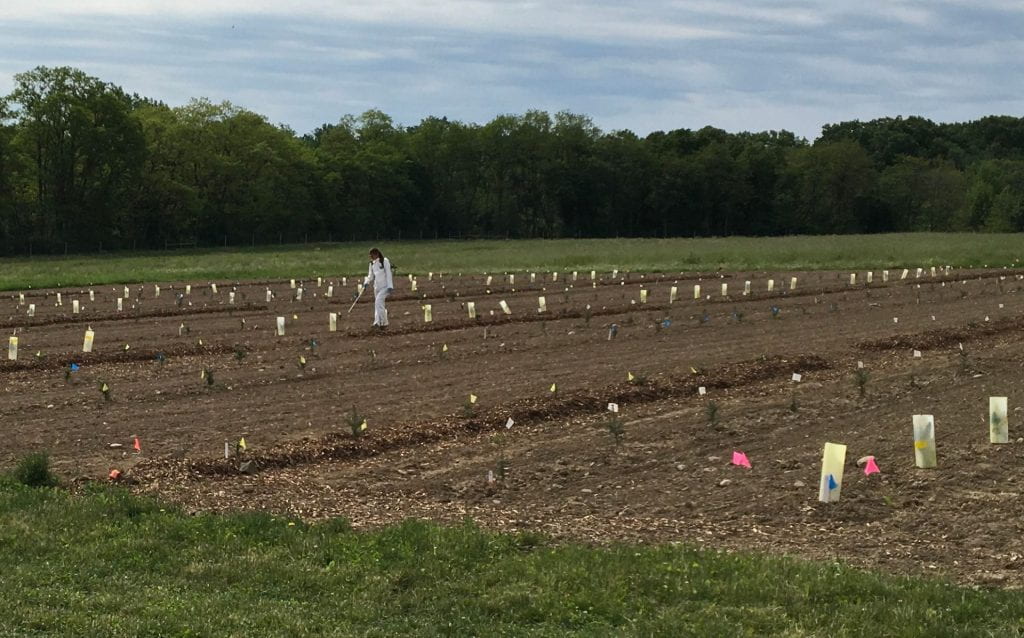
Woman in Tyvek suit with backpack sprayer applying herbicides to rows of Christmas tree seedlings. Seedlings receiving herbicide have plastic cylinders around them to protect them.
Since a few of the trees were getting close to budbreak, we shielded them when applying the herbicide.

Lynn and her team collected soil from the field to assess which weed seeds are currently present in the seedbank. They will continue to evaluate the weed seedbank yearly to determine whether different weed management programs result in different weed seeds in the seedbank. Bryan, Lynn, and technicians working for them will also be assessing the success of each weed control strategy throughout the season (weed density and biomass).

Disease

Within each row, plots of seven trees have been assigned to one of four different treatments for root disease control. The biocontrol piece of this project is the root disease management tools. The biofungicide RootShield PLUS WP contains two different species of the fungus Trichoderma. These fungi may protect the trees by:

  • Inducing resistance – turning on the plants defense mechanisms ahead of pathogen attack
  • Exclusion – growing on the roots so there’s no space for the pathogen to grow
  • “Eating” the pathogen – Trichoderma is a fungus that parasitizes other fungi (and water molds)
  • Poisoning the pathogen – Trichoderma produces antimicrobial compounds
  • Promoting plant growth – Stronger, healthier trees are more likely to survive pathogen attack (and probably be more resilient to water stress).

A study done in Oregon on Douglas fir found that Trichoderma species might help improve survival of trees in pots when they are being attacked by the water mold Pythium. So we’re curious if we can document similar results in the field. We applied RootShield PLUS as a soil drench immediately after transplanting, and will repeat the application 6-8 weeks later.

There’s also been some work done by Richard Cowles in Connecticut suggesting that ProPhyt could improve the color of Fraser firs when they are planted in a field known to have Phytophthora. The active ingredient in ProPhyt is potassium phosphite (equivalent to phosphorous acid), so this product is also classified as a biopesticide by the EPA. I think of it as not really a biological control, since it neither contains a (current or formerly) living organism, nor was made by a living organism. We applied ProPhyt as a root dip immediately before planting. It works by inducing plant resistance, and also inhibiting (“poisoning”) water molds like Phytophthora.

The other two root disease treatments are controls: Subdue Maxx (active ingredient mefenoxam) and just water. Subdue Maxx was applied as a shielded, soil-directed spray the day after we transplanted the trees. All the trees were watered in right after planting because we planted a bit late in the season and it was a pretty warm day. The label calls for a second application in the fall.

So far, we’ve collected data on the initial height, stem diameter (4 inches above the soil) and needle color of every tree in the field. We’ll do this again in the fall to assess tree growth over this first season, and tree health (needle color). We will also record how many trees in each treatment survive. Bi-weekly weed surveys have also been initiated. Bryan has started cultivating the trees in that weed control treatment.

Video of Christmas tree cultivation

For updates on this project, you can check back on this blog (subscribe so you’ll know when new posts are available), follow Lynn and Amara on Twitter or on Instagram (@specialtycropweedscience and @biocontrol.nysipm), or listen to Bryan’s podcast. We’ll also be hosting events at the field (Geneva, NY) in this and subsequent years (put August 19th on your calendars, and stay tuned for more details), and hope to provide updates at future Christmas Tree Farmers Association of NY meetings.

USDA logo, accompanied by the words: National Institute of Food and Agriculture, U.S. Department of AgricultureThis work is supported by Agriculture and Food Research Initiative – Foundational and Applied Science Grant no. 2021-68008-34179/project accession no. 1025660  from the USDA National Institute of Food and Agriculture.


This post was written by Amara Dunn, Biocontrol Specialist with the NYSIPM program. All images are hers, unless otherwise noted.

How do biofungicides fit in vegetable disease management? An update after Year 2

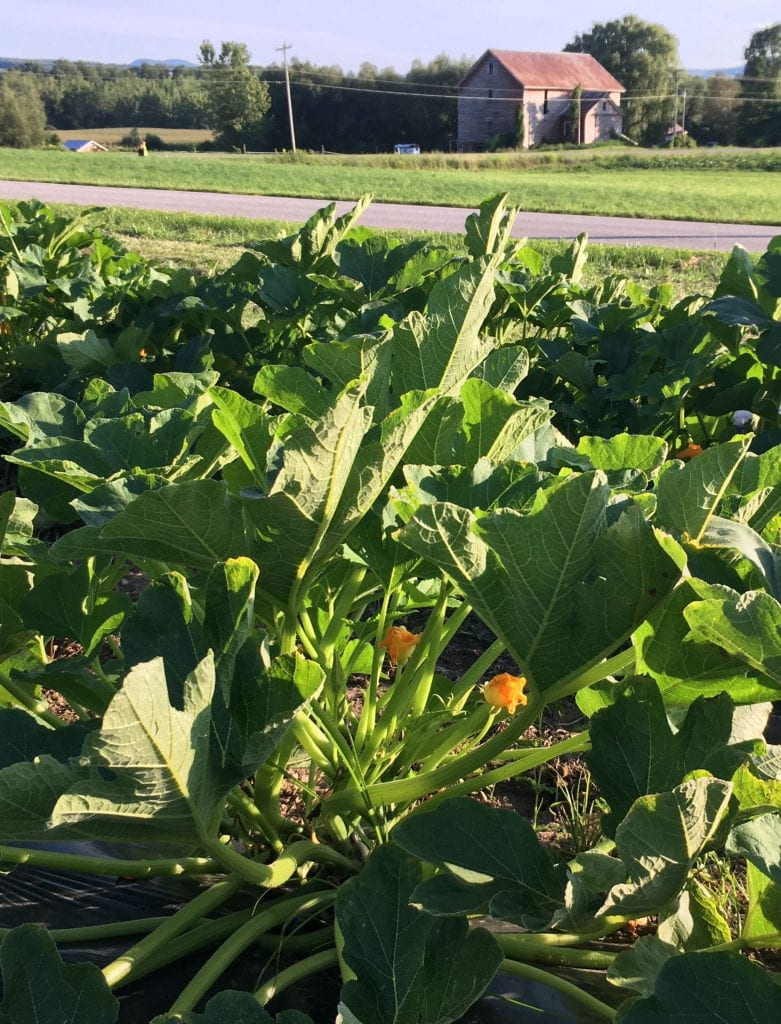
Healthy squash plants, just starting to flower in the foreground, with a field and barn in the background.
Some of the squash plants in one of our 2019 field trials looking at the role of biofungicides in managing cucurbit powdery mildew.

We have been working on a 2-year project funded by the New York Farm Viability Institute to look at adding biofungicides to the management of two vegetable diseases: cucurbit powdery mildew and white mold. In addition to summarizing results from Year 1 of the trial, previous blog posts also covered some of the details about how to best use the biofungicides we’re testing. During the summer of 2019, we completed our second year of trials. The numbers have all been crunched, and here’s a summary of what we learned. If you want to read all the nitty gritty details, a lengthy full report from Year 2 is available here.

Project goals

During the second year of this project, we wanted to answer a few questions for growers:

  1. Can you replace some conventional fungicide applications for cucurbit powdery mildew in winter squash with one of three OMRI-listed biofungicides (LifeGard, Regalia, or Serifel) while maintaining disease control, crop quality, and yield?
  2. Can you get better control of white mold in green beans by Contans prior to planting, and Double Nickel at bloom?
  3. What are the costs (versus benefits) of using these biofungicides in these ways?
  4. Can NDVI sensors help us detect disease early? Can they help us detect differences in plant health as a result of using biofungicides?

White mold – what we did

This table summarizes the white mold treatments in green beans. Replicated plots were treated with Contans in the third week of May, prior to planting; Double Nickel when snap beans were at 10% bloom (late June or early July) and 7 days later; both Double Nickel and Contans; or neither. Treatments are summarized below.

Timing Non-treated Contans Double Nickel Contans + Double Nickel
Pre-plant Contans
(2 lb/A)
Contans (2 lb/A)
10% bloom Double Nickel LC (2 qt/A) Double Nickel LC (2 qt/A)
7 days later Double Nickel LC (2 qt/A) Double Nickel LC (2 qt/A)

White mold – what we saw and what it means

There was very little disease in the white mold trials on either collaborating farm in 2019. This is great news for the collaborating farms, but it means that we couldn’t answer our question about whether using both Contans and Double Nickel in a single season would improve control of white mold. Sarah Pethybridge did three years of efficacy trials with Double Nickel and other OMRI-approved products. In small plot trials with uniform disease pressure Double Nickel was as effective as the conventional fungicides it was compared to in reducing disease. You can read about her results here.

Cucurbit powdery mildew – what we did

We conducted the cucurbit powdery mildew trials on one farm in Eastern NY and on research farms on Long Island and in Western NY, always using the bush acorn squash variety ‘Honey Bear’. This table summarizes the treatments we compared. Essentially, we started with two early biofungicide sprays, then shifted to rotating products when disease was detected. But, in some treatments we replaced the scheduled conventional product with a biofungicide every other week. The biofungicides we looked at were the same as last year: LifeGard, Regalia, and Serifel. We compared these treatments to both a regular conventional fungicide program and a “Conventional + skip” program where we just skipped every other conventional fungicide. And, we included an organic program with traditional OMRI-listed products plus the biofungicides. Important note: Luna Experience is NOT allowed for use on Long Island. We used it in a research plot in order to be able to make comparisons to trials conducted in other parts of the state. You can learn more about fungicide options for managing cucurbit powdery mildew here, and here.

Date Non-treated Conventional Conventional + skip Conventional + LifeGarda Conventional + Regaliaa Conventional + Serifelb Organicab 
~14 days before disease LifeGard WG (4 oz/100 gal) Regalia (2 qt/A) Serifel

(8 oz/A)

LifeGard WG (4 oz/100 gal)
~7 days before disease LifeGard WG (4 oz/100 gal) Regalia (2 qt/A) Serifel

(8 oz/A)

LifeGard WG (4 oz/100 gal)
First disease detection Vivando (15 fl oz/A) Vivando (15 fl oz/A) Vivando (15 fl oz/A) Vivando (15 fl oz/A) Vivando (15 fl oz/A) MilStop (3 lb/A)
+7-10 days Luna Experiencec (10 fl oz/A) LifeGard WG (4 oz/100 gal) Regalia (2 qt/A) Serifel

(8 oz/A)

Serifel (8 oz/A)
+14-17 days Quintec (6 fl oz/A) Quintec (6 fl oz/A) Quintec (6 fl oz/A) Quintec (6 fl oz/A) Quintec (6 fl oz/A) Suffoil-X (1% v/v)
+21-24 days Vivando (15 fl oz/A) LifeGard WG (4 oz/100 gal) Regalia (2 qt/A) Serifel

(8 oz/A)

MilStop (3 lb/A)
+28-31 days Luna Experiencec (10 fl oz/A) Luna Experiencec (10 fl oz/A) Luna Experiencec (10 fl oz/A) Luna Experiencec (10 fl oz/A) Luna Experiencec (10 fl oz/A) Serifel (8 oz/A)
+35-38 days Quintec (6 fl oz/A) LifeGard WG (4 oz/100 gal) Regalia (2 qt/A) Serifel

(8 oz/A)

Suffoil-X (1% v/v)

a LifeGard and Regalia were tank mixed with Nu Film P (1 qt/100 gal)

b Serifel was tank mixed with EcoSpreader (4 fl oz/100 gal) when applied at spray volumes of 30 to 40 gal/A.

c Luna Experience is not allowed for use on Long Island. The Long Island trial was conducted on a research farm.


We summarized disease severity on multiple dates over the season by calculating the area under the disease progress curve (AUDPC). This value describes with a single number how quickly disease developed and how bad it got. We also measured NDVI using a GreenSeeker as a way to quantify how green and healthy the leaves were. At the end of the season, we collected yield and Brix data.

Cucurbit powdery mildew – what we saw

Not surprisingly, there was some variability among sites. But at two sites disease severity was not statistically different when we compared the standard weekly conventional fungicide program to skipping every other fungicide spray. This was disappointing, since we were expecting more severe powdery mildew from extending the spray interval, providing room for the biopesticides to improve control. However, in the Long Island trial, although powdery mildew was more severe when the spray interval was extended, applying a biopesticide during the skip week did not improve control.

For the most part, replacing alternate conventional fungicides with biofungicides resulted in disease levels that were somewhere between the conventional fungicide program and the non-treated control. At two sites LifeGard and Serifel performed slightly better than Regalia. To keep this post a reasonable length, we’re only showing results from the Long Island trial, here.

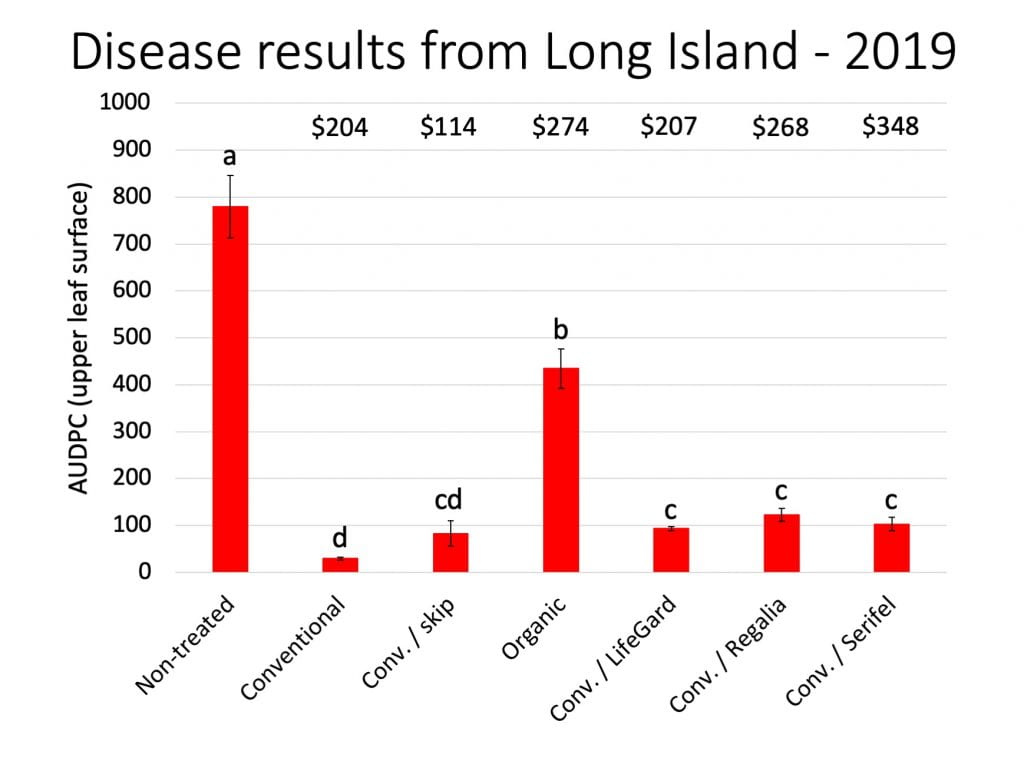
Bar graph showing the amount of disease observed in each treatment in the Long Island trial. Alternating LifeGard, Regalia, or Serifel with conventional fungicides resulted in disease levels similar to skipping every other conventional fungicide. But skipping every other conventional fungicide did not result in statistically worse disease than the full fungicide program. The costs per acre of the conventional, conventional + skip, organic, conventional alternated with LifeGard, conventional alternated with Regalia, and conventional alternated with Serifel treatments were $204, $114, $274, $207, $268, and $348, respectively.
In the Long Island trial, the conventional, conventional + skip, and all three of the conventional/biofungicide programs provided pretty good powdery mildew control. The organic program was still better than the non-treated control. This graph shows only disease on the upper surface of the leaves (AUDPC = area under the disease progress curve). The black lines on each bar show one standard error above and below the mean value for that treatment. Bars with the same letter are not statistically different from each other. This graph also shows the cost (per acre) of the cucurbit powdery mildew fungicides for each treatment above each bar.

The above graph shows a summary of disease on the upper leaf surface over the whole season. We’re not reporting the data here, but if you look at disease ratings on individual dates or on the lower surface of the leaves, skipping every other fungicide or alternating conventional fungicides with biofungicides were not as good as the weekly conventional fungicide program.

At all three sites, yield was not statistically different when we compared the standard weekly conventional fungicide program to skipping every other fungicide spray. There were no statistically significant differences in yield in the Eastern NY trial, and few differences in the Western NY trial. In both trials, when Regalia was alternated with conventional fungicides the yield was slightly but not significantly lower than the conventional/LifeGard and the conventional/Serifel treatments. In the Long Island trial, only the full conventional treatment and treatments that included LifeGard or Regalia had significantly higher yields than the non-treated control. Again, we’ll show just the data from Long Island to keep this story briefer.

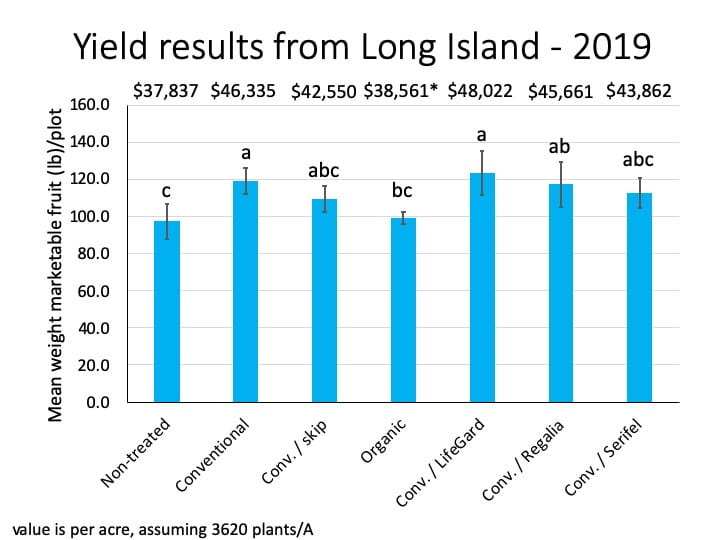
Bar graph showing the average weight of marketable fruit harvested from each treatment in the Long Island trial. The heights of the bars are fairly similar, but the bars representing the conventional, conventional/LifeGard, and conventional/Regalia treatments are the tallest. The value per acre of the marketable fruit harvested from the conventional, conventional + skip, organic, conventional/LifeGard, conventional/Regalia, and Conventional/Serifel treatments is $37,837, $46,335, $42,550, $38,561, $48,022, $45,661, and $43,862, respectively.
Yields from all treatments in the Long Island trial were pretty high. The black lines on each bar show one standard error above and below the mean value for that treatment. Bars with the same letter are not statistically different from each other. The yield per plot of 12 plants was extrapolated to the yield per acre (assuming 6 ft between rows and 2 ft between plants within rows, resulting in 3,620 plants/A) and used to estimate the average grocery store value (per acre) of each treatment, shown above each bar. The value of the organic treatment (*) was not adjusted to account for presumably higher prices for certified organic produce.

Our data did not suggest that NDVI readings taken with the GreenSeeker were a good replacement for visual scouting, or that this was a good tool for detecting differences in plant health among treatments. When NDVI readings differed among treatments, powdery mildew symptoms were readily evident. The most substantial differences in NDVI values among treatments were in the Long Island trial, where both the non-treated control and the organic treatment had much lower average NDVI values over the season.

On the whole, Brix were unaffected by powdery mildew management strategy. The only statistically significant differences in Brix values among treatments were in the Eastern NY trial where the conventional/LifeGard treatment had significantly lower Brix than the conventional/Serifel treatment.

Cucurbit powdery mildew – what it means

When the full conventional fungicide program didn’t result in statistically better disease control than skipping every other spray at 2 of the 3 sites, it’s not possible to say whether or not the biofungicides were good replacements for conventional fungicides against powdery mildew. However, they did not prove to be in the Long Island trial. Our results did not suggest that measurement of NDVI values with a GreenSeeker should replace visual scouting for cucurbit powdery mildew.

Depending on the trial location (and accompanying variations in spray schedules and rates), replacing some conventional fungicides with biofungicides ranged from slightly less expensive than the full conventional program to more than twice the cost. Although in most cases there were no statistically significant differences in the value of the crop between the conventional/biofungicide programs and the full conventional program, the numerical value of the marketable crop ranged from being slightly higher (LifeGard alternated with conventional fungicides on Long Island) to lower (all other biofungicide treatments). Again, the lack of statistically significant differences between the full conventional spray program and the conventional spray program with skips in 2 of the 3 trials makes any conclusions about the economics of replacing some conventional fungicides with biofungicides, tentative, at best. There’s a lot of room to fine-tune incorporation of biofungicides into spray programs to maximize cost effectiveness.

Recall from last year’s results that we did not detect any benefit from adding biofungicides to a full cucurbit powdery mildew fungicide program. So if you’d like to use biofungicides for cucurbit powdery mildew, replacing a conventional fungicide application or two is probably a better way to go. If you’ve tried this, we’d love to hear how it worked for you!


Remember that the information in this post is not a substitute for a pesticide label. The label is the law, and you must read and follow the label of any pesticide you are using. It is your responsibility to use pesticides legally.


This post was written by Amara Dunn (NYSIPM) and Meg McGrath (Plant Pathology & Plant-Microbe Biology, School of Integrative Plant Science, Cornell University). Thank you to the New York Farm Viability Institute for funding.

Battling Fire Blight with Biologicals

This post was written by Anna Wallis, Kerik Cox, and Mei-Wah Choi (all from Cornell’s School of Integrative Plant Science, section of Plant Pathology and Plant-Microbe Biology). Thanks for sharing your research with us!

Since this is a slightly longer post, here’s a little table of contents:

Biological Modes of Action

What products are currently available and where do they fit in?

Results from the Cox lab

The verdict on biologicals for fire blight management

Streptomycin is a clear asset in the fire blight arsenal—it is inexpensive, effective, and reliable. However, antibiotics may not always be a viable option. More and more, biological materials are holding their own in the fight, with an increasing number of products on the market claiming protection for both blossom and shoot blight. Biological materials are still relatively new to the apple scene, an industry with a long track record of effective disease management. So why change to biologicals, and how do they work?

There are a multitude of reasons driving the growth of antibiotic alternatives. Organic production eliminated antibiotic use in 2014 in the United States. In European markets, they are prohibited or severely limited. Pressure from regulatory organizations and markets to use more sustainable management techniques will not be slowing any time soon. The prevailing evidence supports that responsible streptomycin applications do not seem to select for resistance in the pathogen. Yet, resistance continues to appear in commercial settings.

So, what are these biological materials and how do they work? In the ‘What is Biocontrol?’ tab above, Amara provides an excellent overview of biocontrol, as defined by the EPA and industry. Here I’ll review the biological modes of action and specific materials available in the context of fire blight management. I’ll also provide a snapshot of how biological programs have performed in our research orchards. There is no intention to endorse any specific trade products, rather this is an attempt to provide a neutral perspective and overview of the current market.

Biological Modes of Action

Biological materials available for fire blight management are typically biopesticides falling into the biochemical or microbial category. This means they are derived from natural sources (i.e. plant extracts or minerals) or they are composed of microcorganisms and/or their products.

To understand how biologicals can be used in fire blight management, it’s first important to review the important features of the disease. A thorough description of the disease cycle, symptoms, and causal organism can be found on this Cornell Fact Sheet. Fire blight is caused by Erwinia amylovora, a bacterial pathogen which preferentially colonizes the floral surface, specifically the stigma or the sticky part of the tip of the female organ. First, enough heat must be accumulated for colonization to occur, which can be predicted by disease forecasting models such as MaryBlyt (if you’re familiar with the disease and pest prediction tool NEWA, this is the model used in the fire blight prediction model there). Then there must be a wetting event to wash the bacteria into the natural openings in the flower, the nectary at the base of the floral cup. Unlike fungi, bacteria cannot penetrate plant cells directly, so they rely on natural openings and tissue damage to invade their host.

Pictures (counterclockwise, from top left) of a yellow glob of bacteria oozing out of a dark, necrotic canker on an apple stem; a dead cluster of apple blossoms; a dead apple shoot curved like a shepherd’s crook; the base of an apple tree trunk with a dark canker.
Figure 1. Simplified disease cycle for Erwinia amylovora, causal agent of fire blight. Clockwise from top left: primary inoculum is produced in the spring as bacterial ooze from old cankers; inoculum is transferred to open flowers and causes blossom blight; blighted blossoms provide additional inoculum which is transferred to young leaf tissue damaged by wind or hail causing shoot blight; bacteria may also travel systemically via the vascular system of the plant leading to canker blight; cankers produced from blossom, shoot, or canker blight provide an overwintering site for bacteria to colonize the tree in the following season.

Biologicals can disrupt these events by:

  1. Outcompeting the bacteria during colonization of the plant
  2. Producing antibiotic metabolites, killing the pathogen prior to infection, or
  3. Priming natural host defenses, making the plant more resistant to the bacteria. This is called ‘Induced Resistance’

A simplified view of these events is depicted in Figure 2.

Two identical pictures of a cluster of open apple blossoms. Left photo with a red circle around the yellow floral parts (stigmas) and a blue curved arrow from this circle to the base of the flower (nectary), representing the colonization of the stigma by E. amylovora and a wetting event washing the bacteria into the plant. Right photo with the red circle and blue arrow, plus a yellow ‘X’ over the red circle, indicating protectant activity at the stigmatic surface, and a brown ‘T’ with the top facing the stigma, indicating the induction of plant defenses.
Figure 2. Depiction of fire blight blossom infection and how biological materials interfere. (A) In order for a blossom infection to occur, flowers must be open and receptive, heat accumulation must be sufficient for E. amylovora to colonize the stigma (red circle), and there must be a wetting event (blue arrow) to wash the bacteria into the floral nectary. (B) Biological materials protect against infections by outcompeting the pathogen or producing antibiotic metabolites (yellow ‘x’) or priming host defenses (red letter “T”).

Like any product, these materials require precise applications, to ensure they are in the right place at the right time to provide effective control (Figure 3). Materials with competitive action or antimicrobial metabolites that ‘protect’ the flower (protectants) must be applied when the bacteria is present or just before. This enables sufficient, timely colonization or interaction with the pathogen. Induced resistance materials (defense inducers), also called Systemic Acquired Resistance or Induced Systemic Resistance materials (SARs or ISRs), must be applied prior to infection events, with enough time to activate the host response. (Click the image below to enlarge it.)

Seven pictures of apple buds in a row, depicting growth stages in chronological order: 1. dormant (closed, brown buds), 2. green tip (green leaves just starting to emerge), 3. half inch green (about ½” of green showing), 4. tight cluster (cluster of green floral buds in center of emerged leaves), 5. pink (floral buds showing pink color), 6. bloom (open blossoms), and 7. petal fall (cluster of very small fruitlets). At several stages, words are printed above indicating actions to be taken for fire blight management. At dormant “Prune out cankers”, at green tip “Copper”, at pink “Pre-bloom defense inducers”, at bloom “Protectants”, at petal fall “Post-bloom defense inducers.”
Figure 3. Approximate timing of biological materials corresponding to phenological stages of apple for blossom and shoot blight protection. In any fire blight management program, it is essential to remove inoculum (old cankers) during the dormant period and apply a general antimicrobial at green tip to reduce inoculum. Blossom blight control is provided by defense inducers applied prior to bloom and protectants applied at bloom. Additional applications of defense inducers post-bloom provide shoot blight control; some of the earlier applications targeting blossom blight seem to also have some carry-over effect for shoot blight.

What products are currently available and where do they fit in?


Blossom protectant type products include both bacteria and fungi. The most well-known examples include: Pantoea agglomerans, a bacterium closely related to the fire blight bacterium and an excellent colonizer of apple flowers, marketed as Bloomtime Biological (Northwest Agricultural Products), and the yeast Aureobasidium pullulans, a fungus, marketed as Blossom Protect (Westbridge Agricultural Products). Another bacterium, Pseudomonas fluorescens, is also an effective competitor and is marketed as BlightBan (NuFarm).

Materials with antimicrobial activity are most often Bacillus species, most commonly strains of B. amyloliquefaciens and B. subtillus. Currently on the market are Serenade Optimum (Bayer), Double Nickel (Certis), and Serifel (BASF).

Products that stimulate Induced Resistance response in the host plant work by stimulating two possible pathways the ISR and SAR, as mentioned earlier. These pathways are related and overlapping in the plant, and scientists are still detangling the complex molecular mechanisms involved in plant protection. Example products include Regalia, an extract of the plant Reynoutria sachaliensis or giant knotweed (Marrone Bio Innovations) and a Bacillus mycoides strain marketed as LifeGard (Certis). Another common product used in induced defense is acibenzolar-S-methyl. This is not a biological, but a synthetically derived product marketed as Actigard (Syngenta).

Many of these products have been recommended as part of an integrative management strategy outlined in an extensive report from The Organic Center, based on results from both research trials and anecdotal experience (Ostenson and Granatstein 2013). Always follow the label on any pesticide (including biopesticides) you use.

Table 1. Biological products for Fire Blight

Product Active Ingredient Mode of Action
Firewall Streptomycin antibiotic – kills pathogen
Blossom Protect Aureobasidium pullulans strains DSM14940 & 14941 competitive with pathogen
Bloomtime Biological Pantoea agglomerans strain E325 competitive with pathogen
BlightBan Pseudomonas fluorescens strain A506 competitive with pathogen
Serenade Optimum Bacillus amyloliquefaciens strain QST713 antibiotic metabolites
Double Nickel Bacillus amyloliquefaciens strain D747 antibiotic metabolites
Serifel Bacillus amyloliquefaciens strain MBI600 antibiotic metabolites
Regalia extract of Reynoutria (giant knotweed) resistance inducer
LifeGard Bacillus mycoides isolate J resistance inducer

Results from the Cox lab


Our lab conducts extensive trials evaluating efficacy and sustainability of disease management programs in our research orchards at Cornell AgriTech in Geneva. More recently testing has included various biological materials. In these trials, management programs are tested in two orchard blocks: a Gala block and an Ida Red block, established in 2002 and 2004 respectively, both on B.9 rootstock. The trees in these blocks are spaced considerably farther apart than commercial orchards in order to prevent drift between treatments.

Programs targeted either blossom or shoot blight. To provide sufficient disease pressure, trees are inoculated with a high concentration of E. amylovora at bloom. In blossom blight programs, resistance inducers are applied at pink, and protectants are applied at bloom. For shoot blight programs, resistance inducers are applied at petal fall.

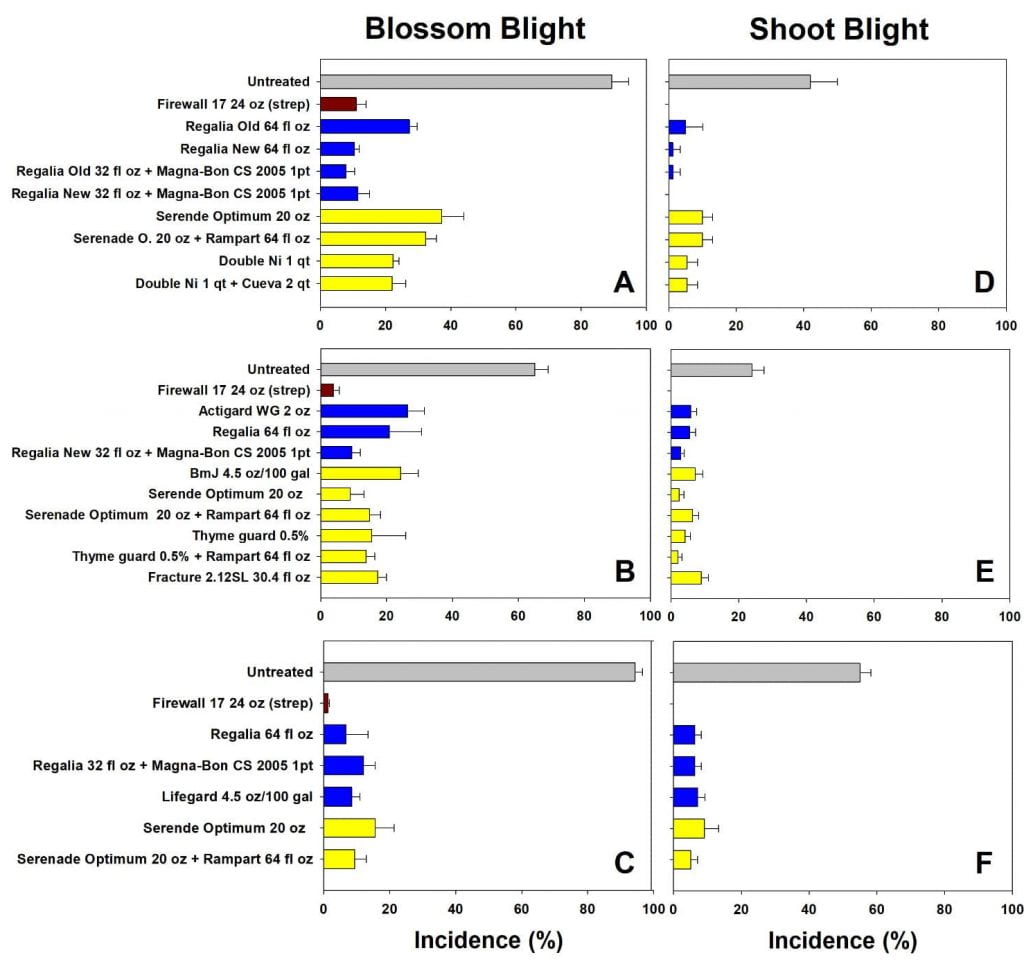
Disease pressure varied from season to season, as indicated by the untreated control trees, ranging from 60 to 99 % disease incidence. Across all trials, antibiotics provided the most consistent and reliable control of both blossom and shoot blight, with less than 15% blossom and 5% shoot blight. The biological materials, both protectants applied at bloom and defense inducers applied pre-infection, also provided good disease protection with typically less than 30% incidence depending on the season conditions and the product. Compared to antibiotic programs, these materials showed greater variation both within and between seasons (i.e. greater standard deviation within a treatment and different top performers in different seasons). In seasons with lower disease pressure, biological programs tended to perform as well as antibiotics. Some of the specific results from 2015-17 are shown in Figure 4 (click the image to enlarge the graphs).

Disease was most severe in the untreated control, ranging from 60% to more than 90% of blossoms blighted and 30% to more than 50% of shoots blighted. Pressure was high in 2015 and 2017, lower in 2016. The antibiotic streptomycin always had <20% and often 0% incidence. Defense inducers outperformed protectants in 2015. In 2016 and 2017 defense inducers and protectants performed similarly, and overall disease incidence was lower.
Figure 4. Average disease incidence of four replicate trees treated with fire blight management programs in 2015 (A & D), 2016 (B & E), and 2017 (C & F). Programs included untreated control (grey bar; highest disease pressure), antibiotics (maroon), resistance inducers (blue), and blossom protectants (yellow).

The verdict on biologicals for fire blight management


Do we recommend biological materials for fire blight management? Overall, the answer is generally yes. There are several important considerations to consider. In our research orchards, the system is challenged with a very high level of inoculum to examine fine differences in product performance. These inoculum levels are much higher than would be present in most commercial orchards. Hence, we expect all programs would perform even better in a commercial setting. In addition, combinations of products seem to be the best: for example, pairing a defense inducer applied at bloom with a protectant material at bloom to control blossom blight, with follow up defense inducer applications for shoot blight. We also expect efficacy of biological materials to improve in the future. Changes in formulations improving activity (note the old and new Regalia formulations in Figure 3), as well as shelf life, tank mixing, and storage happen fairly regularly and will make products more accessible and affordable for growers.

Biologicals are still relatively new materials. As with any product, there is still much to learn about how products work in the field, the most effective management programs, and translating best practices from research to commercial settings. We believe they are a valuable part of an integrated fire blight management approach, including good cultural and mechanical practices such as planting resistant cultivars and rootstocks and removing inoculum from the orchard.


You can learn more from these sources:

Ostenson, H., and Granatstein, D. Grower Lessons and Emerging Research for Developing an Integrated Non-Antibiotic Fire Blight Control Program in Organic Fruit. The Organic Center. November 2013. Available at: https://www.organic-center.org/wp-content/uploads/2013/07/TOC_Report_Blight_2b.pdf

Pal, K., and Gardener, B. 2011. Biological Control of Plant Pathogens. The Plant Health Instructor, APS. Available at: https://www.apsnet.org/edcenter/advanced/topics/Pages/BiologicalControl.aspx.

Turechek, W. W., and Biggs, A. R. 2015. Maryblyt v. 7.1 for Windows: An Improved Fire Blight Forecasting Program for Apples and Pears. Plant Health Progress. 16:16–22. Available at: https://www.plantmanagementnetwork.org/pub/php/volume16/number1/PHP-RS-14-0046.pdf

And the results are in…from Year 1. What do biofungicides add to vegetable disease management Part 3

Cucurbit powdery mildew on a winter squash leaf.
One of our goals for this project was to understand what biofungicides might add to a cucurbit powdery mildew management program.

Introduction

In 2018 we conducted field trials using biofungicides in cucurbit powdery mildew and snap bean white mold management programs. Hopefully you’ve read part 1 and part 2 of this biofungicide story. If not, now might be a good time.

Part 1 will give you more details about the trial design. We wanted to know whether adding biofungicides would improve disease control, plant health, or yield. For cucurbit powdery mildew, we were adding one of three different biofungicides to a conventional chemical spray program. We also included a treatment that was all OMRI-listed (organic) products. For white mold on snap beans, we were curious about using an in-season biofungicide (Double Nickel, Bacillus amyloliquefaciens strain D747) in combination with a pre-season biofungicide (Contans, Paraconiothyrium minitans strain CON/M/91-08). In 2018, our white mold treatments were just Double Nickel and Cueva (an OMRI-listed copper). In 2019, we’ll add the pre-season Contans treatment.

Part 2 explains more about the modes of action of the five biofungicides we are looking at. The post also includes practical information about how to use these biofungicides to maximize their efficacy – compatibility with other products, best way to store them, when to apply them, etc.

Now it’s time to talk about what we learned from this first year (of a two-year project).

The bottom line

We don’t want to keep you in suspense, so here’s a quick summary of what we learned. Fortunately for the eastern NY grower who graciously allowed us to run the trial on his farm (but unfortunately for us), the snap bean field had very little white mold in 2018. Even the plots that were not sprayed with Double Nickel or Cueva had almost no disease. So we weren’t surprised when there were no differences in disease, plant health, or yield among the white mold treatments. Results from Sarah Pethybridge’s efficacy trials with OMRI-approved products for white mold are available online.

A healthy field of snap bean plants.
Our snap bean trial in eastern NY in 2018 had very little white mold. (Photo credit: Crystal Stewart)

Cucurbit powdery mildew was a bit more severe than white mold (low pressure in eastern NY, moderate pressure in western NY and on Long Island), but we were not able to detect statistically significant benefits from adding biofungicides to a conventional spray program. Disease severity, plant health (as measured by NDVI), yield, and fruit quality (Brix) were the same whether you used a conventional spray program, or a conventional spray program plus a biofungicide. We didn’t measure significant differences in yield among any of the treatments at any of the three sites.

The conventional powdery mildew spray program alone, or when combined with LifeGard, Regalia, or Serifel significantly reduced disease compared to no treatment for cucurbit powdery mildew. Adding any of the biofungicides to the conventional spray program did not improve control compared to using only the conventional sprays. The organic (OMRI-listed products) treatment was not significantly different from either no sprays at all, or the conventional spray program.
Severity of powdery mildew on the upper sides of the leaves in the Western NY trial. Here, disease severity is quantified using the area under the disease progress curve (AUDPC). This number summarizes disease severity from multiple dates, and the larger the number, the worse the disease. If two treatments share the same letter, the average disease in those treatments is not significantly different. The error bars give you an idea of how much variability there was in each treatment.

NDVI results

NDVI (normalized difference vegetation index) values did not detect cucurbit powdery mildew early. (Since there was so little white mold, we couldn’t test NDVI for early detection.) There was some inconsistent correlation between NDVI readings and disease, yield, and Brix in winter squash. In WNY we used both a handheld GreenSeeker and a gator-mounted Crop Circle to measure NDVI. Both devices had similar results. Based on this first year of testing with these two devices, NDVI measurements were not useful as an early indicator of cucurbit powdery mildew.

In addition,  NDVI measurements did not  detect subtle differences in plant health among treatments. At only one of our three sites (Long Island) were there any significant differences in NDVI among treatments. This was only on the last two rating dates in the season, when powdery mildew was visibly more severe in the non-treated control than the conventional fungicide treatments.

On the last two rating dates of the season (August 31 and September 17), NDVI values were significantly higher in the conventional powdery mildew spray program treatment and all three of the conventional + biofungicide treatments, compared to the plots that were not treated for powdery mildew. Adding the biofungicides did not significantly improve NDVI, compared to using only conventional products.
Normalized difference vegetation index (NDVI) measured on winter squash in the Long Island trial on three dates at the end of the season. NDVI values closer to 1 indicate more healthy, green foliage. If two treatments have the same a letter on the same date, the average NDVI readings on that date were not different between the two treatments. Data from August 31 are labeled with uppercase, while data from September 17 are labeled with lowercase letters. There were no differences among any treatments on August 24. The error bars give you an idea of how much variability there was in each treatment. We couldn’t do statistics on the organic treatment because too many plants were killed by Phytophthora blight in the plots that received this treatment.

Some caveats

The non-treated control (received no powdery mildew fungicide) was often not significantly different from the conventional fungicide control (our best management program). We know that controlling powdery mildew on cucurbits is important, so if we don’t detect a significant difference between the non-treated control and the treatment that should have provided the best control, it is then hard to draw further conclusions from the data.

We didn’t measure statistically significant differences in marketable yield among any of the treatments at any of the sites. Data for eastern NY are shown in this graph.
We didn’t detect statistically significant differences in marketable yield among any of the treatments in any of the trials. Here are the data from eastern NY. Notice that all six bars are labeled with the letter “a”. As with previous graphs, the error bars give you an idea of how much variability there was across the different plots in each treatment.

When disease pressure is low (as it was in Eastern NY), we would expect not to see many differences between treatments. Similarly, if the conventional fungicide program provided excellent disease control (as it did on Long Island), it would be hard to detect an improvement in control from adding a biofungicide. Another challenge we dealt with in the Long Island trial was Phytophthora blight. By the end of the season, we had lost two of the four plots receiving the organic treatment to this disease. This limited our ability to statistically analyze the biofungicide data. On Long Island, the organic spray program initially performed well – as seen on August 31  – comparable to the conventional treatments. But by the final assessment on September 17, the organic program was no longer as effective. This was not surprising since it was 10 days after the last application. Suffoil-X was the final organic product applied, and it has little residual activity.

In the Long Island trial, there was very little disease on August 16 or 24. On August 31, disease had increased in the non-treated control, but the organic treatment was still suppressing disease well. Control in the organic treatment had declined by September 17, but this was 10 days after the last spray was applied.
Average severity of powdery mildew on the upper surface of leaves on the last four assessment dates in the 2018 Long Island trial. All of the treatments (except the non-treated control) suppressed powdery mildew well through August 31. Control in the organic treatment had declined by September 17, but this was 10 days after the last spray was applied.

In WNY, we had an epic aphid outbreak. An entomologist colleague identified them as probably melon aphids, and also that 2018 was generally a bad year for aphids. It’s also possible that while trying to control cucumber beetles earlier in the season, we killed some aphid natural enemies, contributing to an aphid outbreak later in the season. I know cucumber beetles are tough, but if you can manage them without decimating your local natural enemies, you’ll be doing yourself a favor!

The underside of a squash leaf covered with aphids; an acorn squash fruit covered with shiny honeydew from aphids; a close-up picture of an adult aphid and some young aphids.
The severe aphid outbreak in the western NY trial may have made it more difficult to detect differences among treatments. In late August, some of the leaves were covered with aphids (A), and many fruit were covered with honeydew (B). Getting a close look at the aphids is essential for correct identification (C).

We deliberately used a very intensive spray program, starting our biofungicide applications early, and continuing to apply them as we added conventional fungicides later in the season. This was an expensive powdery mildew management program. But, in this first year of the project, we didn’t want to be left wondering if a lack of differences was due to underapplication of the biofungicides.

If you want to see more of the data we collected from the cucurbit powdery mildew trial, you can find it in the Proceedings from the 2019 Empire State Producers Expo.

What does this all mean?

First, this is only the first year of our project and one year of data. It’s a start, but we’ll hopefully learn more in a second year. Since we didn’t measure a significant improvement in yield, we didn’t see evidence that adding biofungicides to a full chemical spray program for powdery mildew justified the cost. The relative costs of the treatments we used are listed in the table below, and the approximate per acre costs of each product are in the Proceedings from the 2019 Empire State Producers Expo. Replacing a chemical spray or two with a biofungicide could be a more economical option. That’s something we’re planning to look at in 2019.

Treatment
Date Non-treated Conventional Conventional + LifeGard Conventional + Regalia Conventional + Serifel Organic
7/19/18 LifeGard Regalia Serifel LifeGard
7/27/18 LifeGard Regalia Serifel LifeGard
8/3/18 Vivando LifeGard + Vivando Regalia + Vivando Serifel + Vivando MilStop
8/10/18 Quintec LifeGard + Quintec Regalia + Quintec Serifel + Quintec Serifel
8/17/18 Luna Experience LifeGard + Luna Regalia + Luna Serifel + Luna SuffoilX
8/24/18 Vivando LifeGard + Vivando Regalia + Vivando Serifel + Vivando MilStop
8/31/18 Quintec LifeGard + Quintec Regalia + Quintec Serifel + Quintec Serifel
9/7/18 Luna Experience LifeGard + Luna Regalia + Luna Serifel + Luna SuffoilX
Total cost (per A) $228.28 $343.32 $536.28 $696.28 $257.76
Cost increase vs. conventional (per A) $  – $115.04 $308.00 $468.00 $29.48

Based on results from this year, we can’t yet recommend that you run out and buy a handheld NDVI sensor for early detection of cucurbit powdery mildew. We’ll collect NDVI data again in 2019, and let you know what we learn. Although our results from the field trials were somewhat inconclusive in this first year, we’re hopeful that the information we’ve compiled about how these biofungicides work and how to use them will be useful. If you’re thinking of using Contans, Double Nickel, LifeGard, Regalia, or Serifel in 2019, first take a look at these fact sheets related to our white mold and powdery mildew trials. And if you have used biofungicides, we’d be interested in hearing about it; click here to send an e-mail.

This post was written by Amara Dunn (NYS IPM), Elizabeth Buck (Cornell Vegetable Program), Meg McGrath and Sarah Pethybridge (both Plant Pathology & Plant-Microbe Biology, School of Integrative Plant Science, Cornell University), Crystal Stewart (Eastern NY Commercial Horticulture Program), and Darcy Telenko (Department of Botany & Plant Pathology, Purdue University). Thank you to the New York Farm Viability Institute for funding.