
Apple Thinning

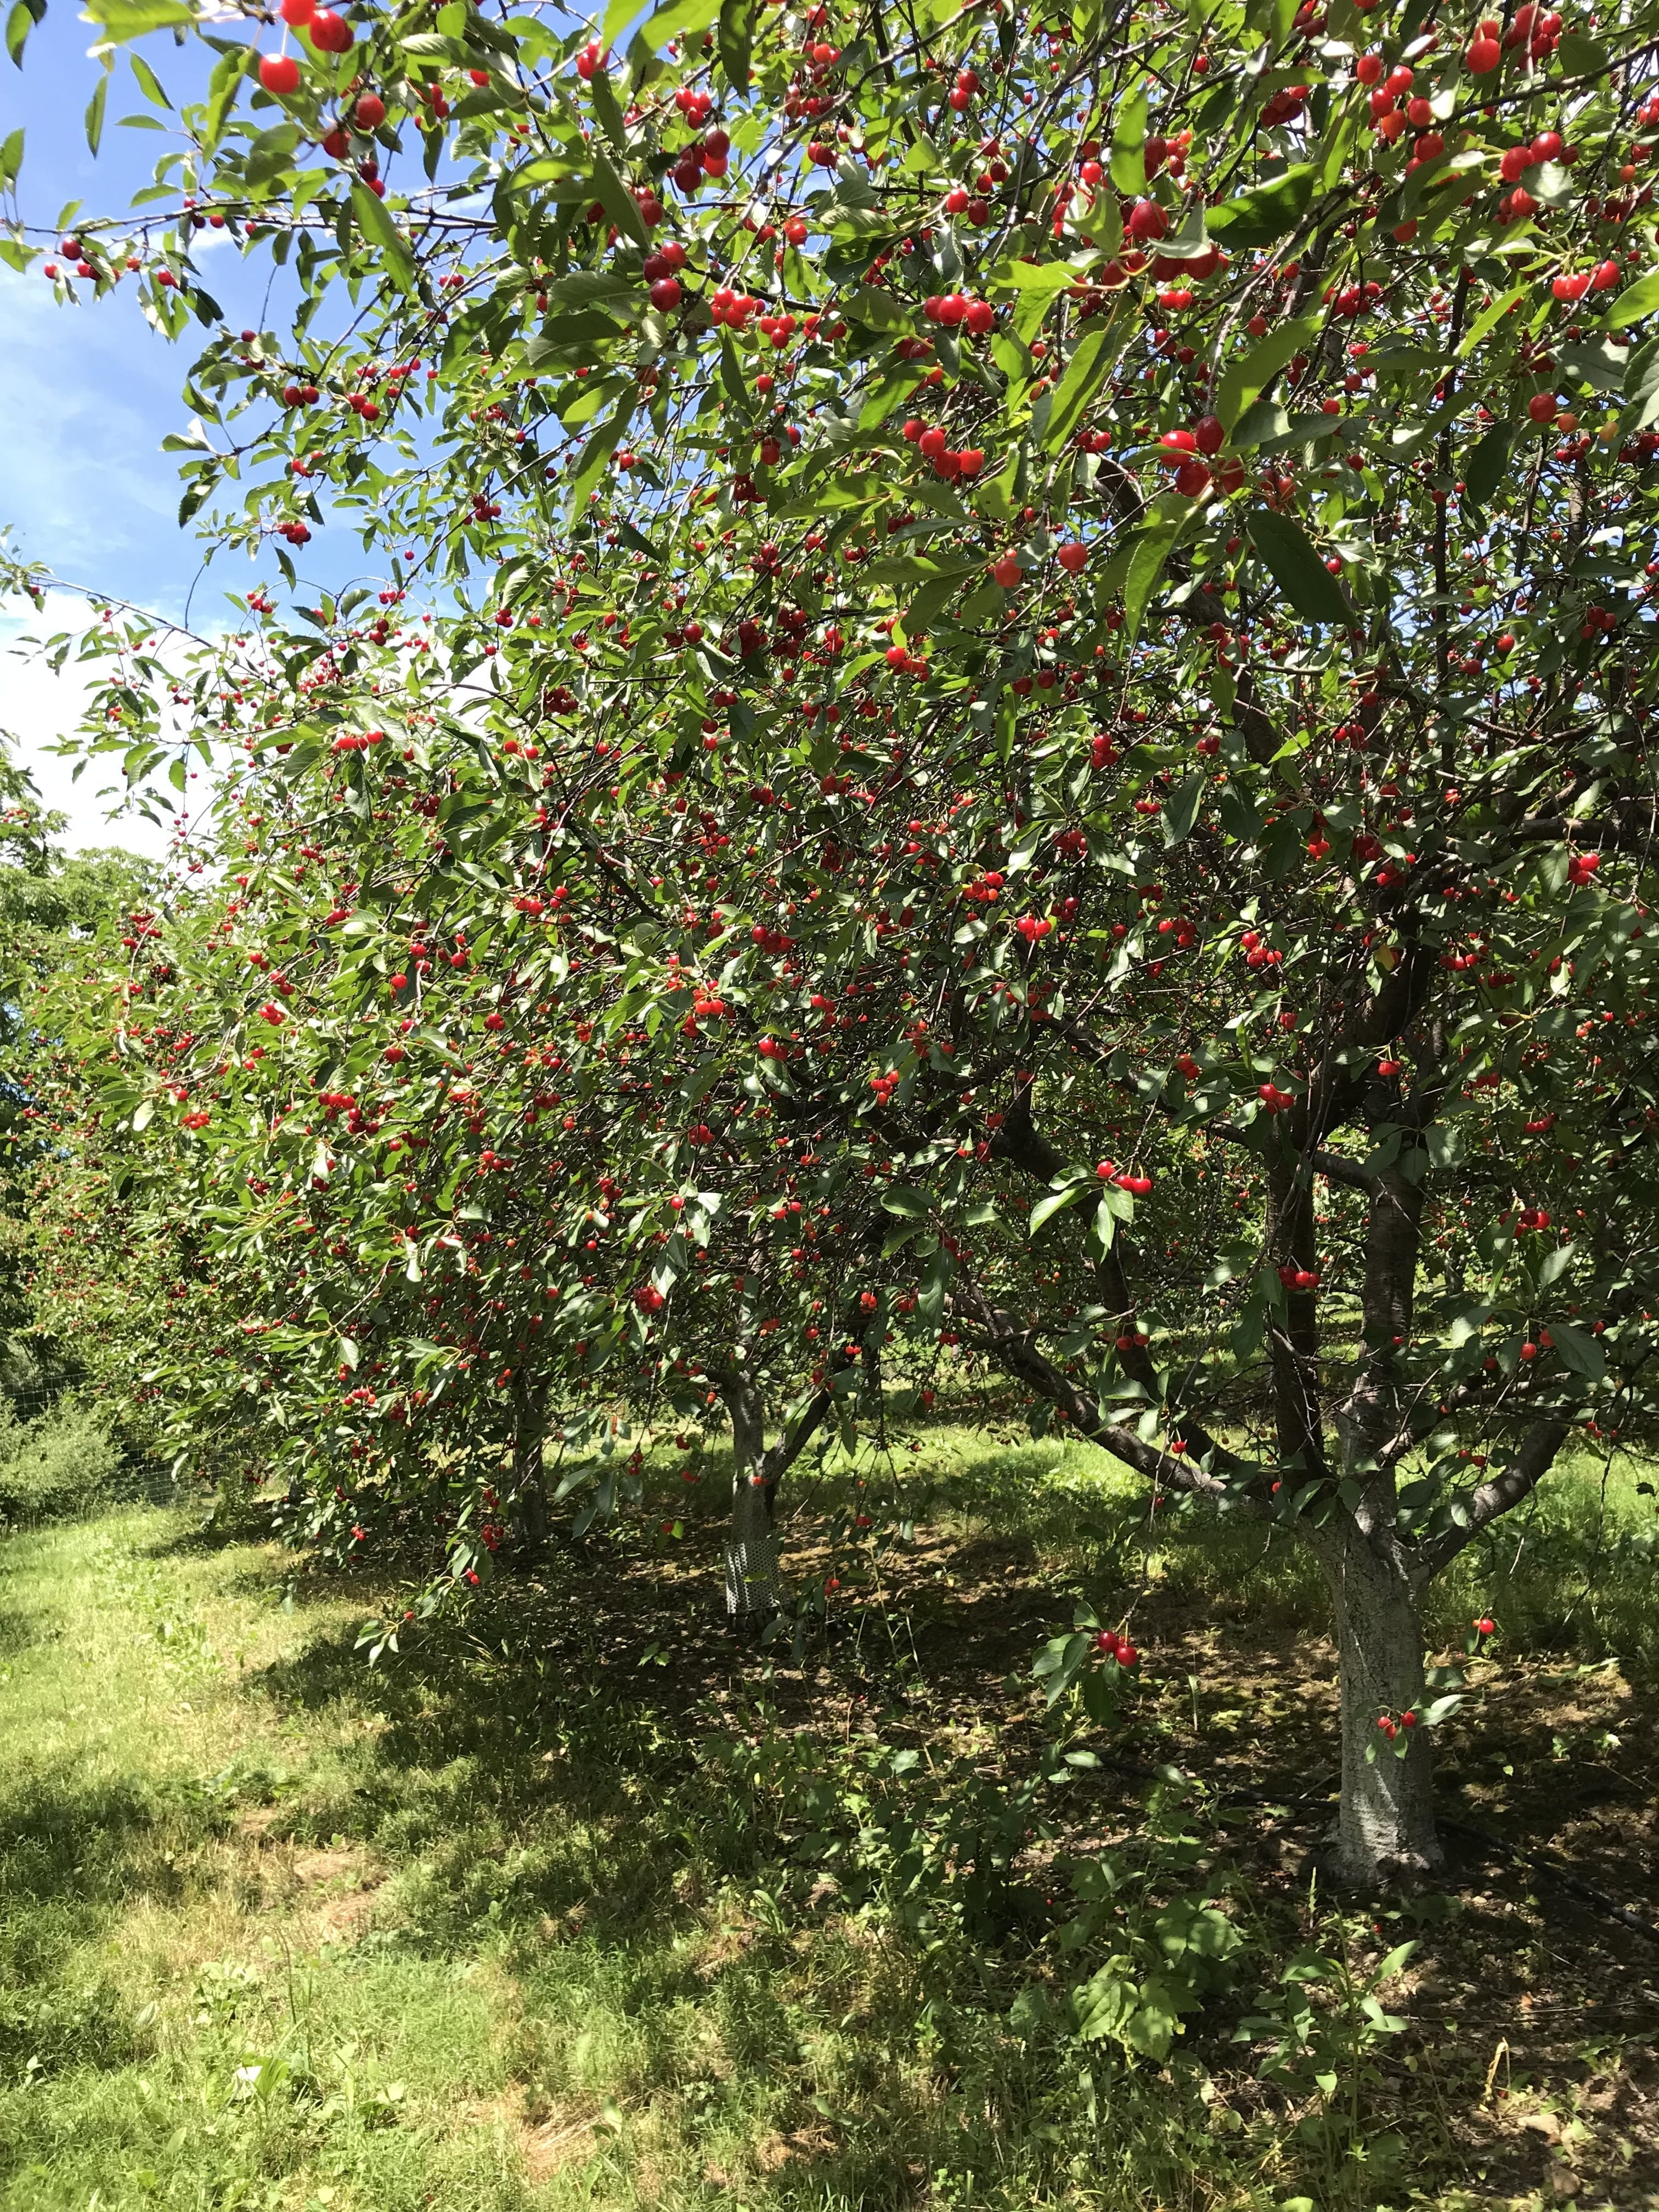
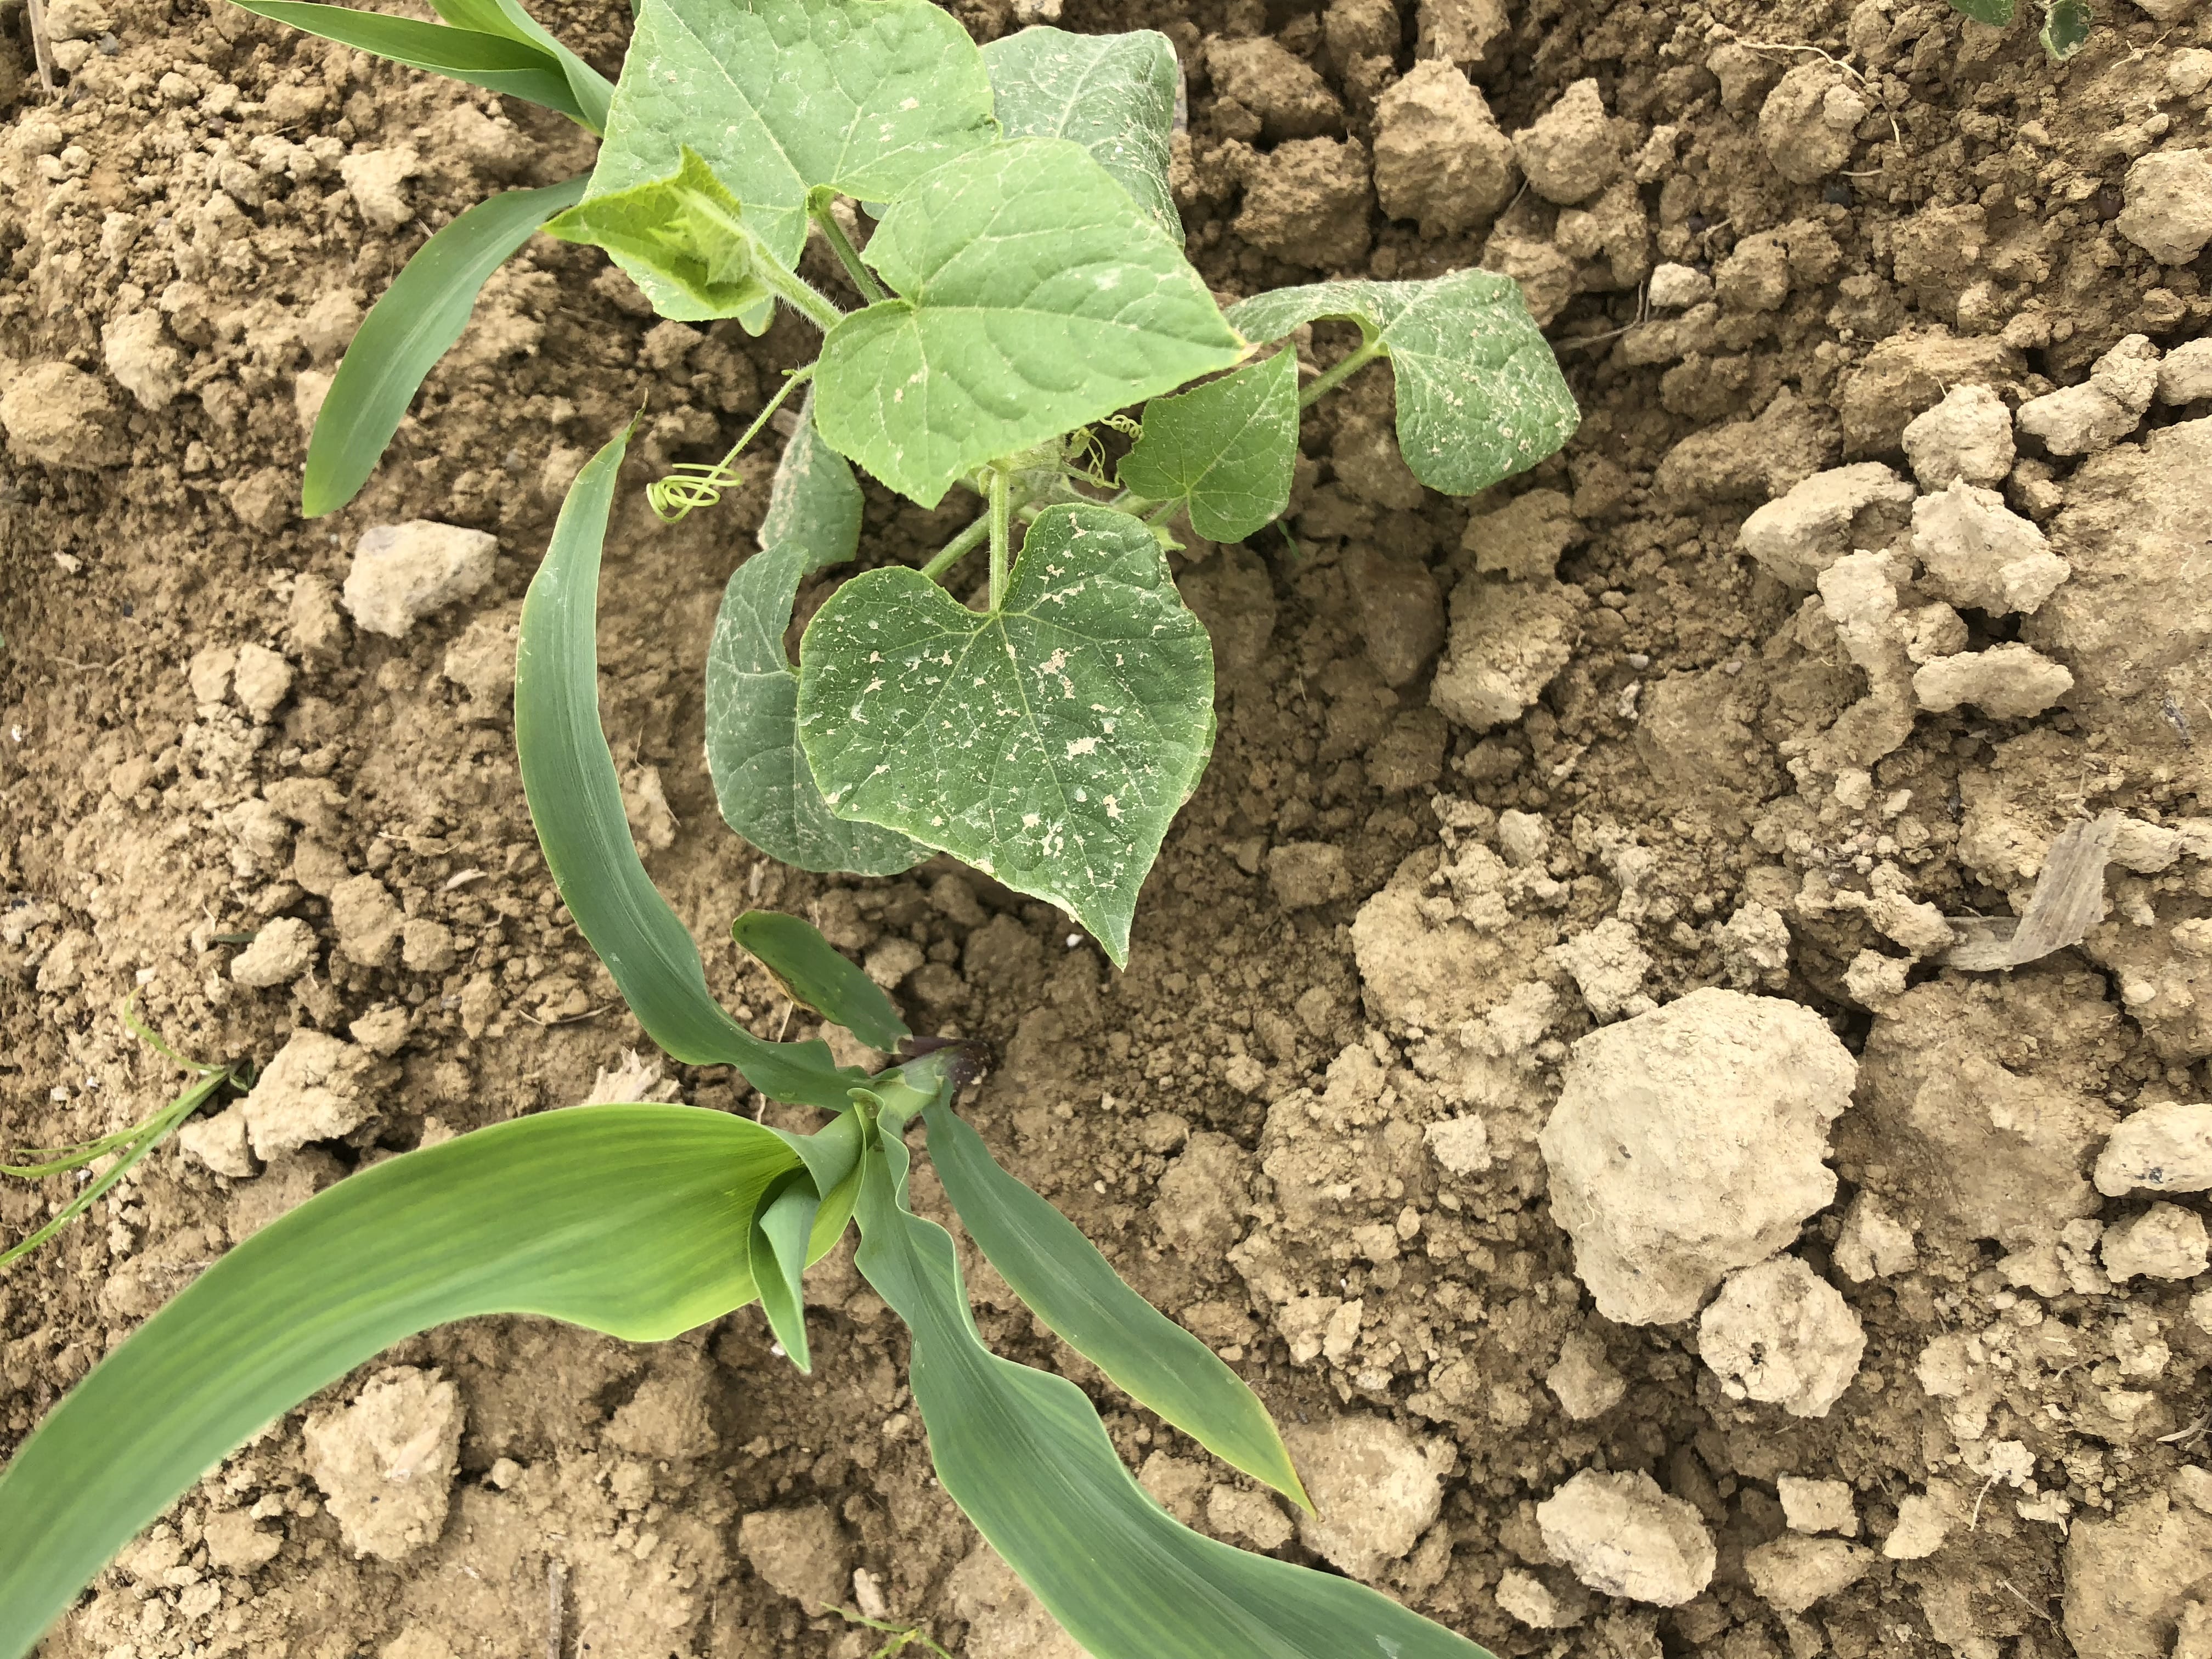
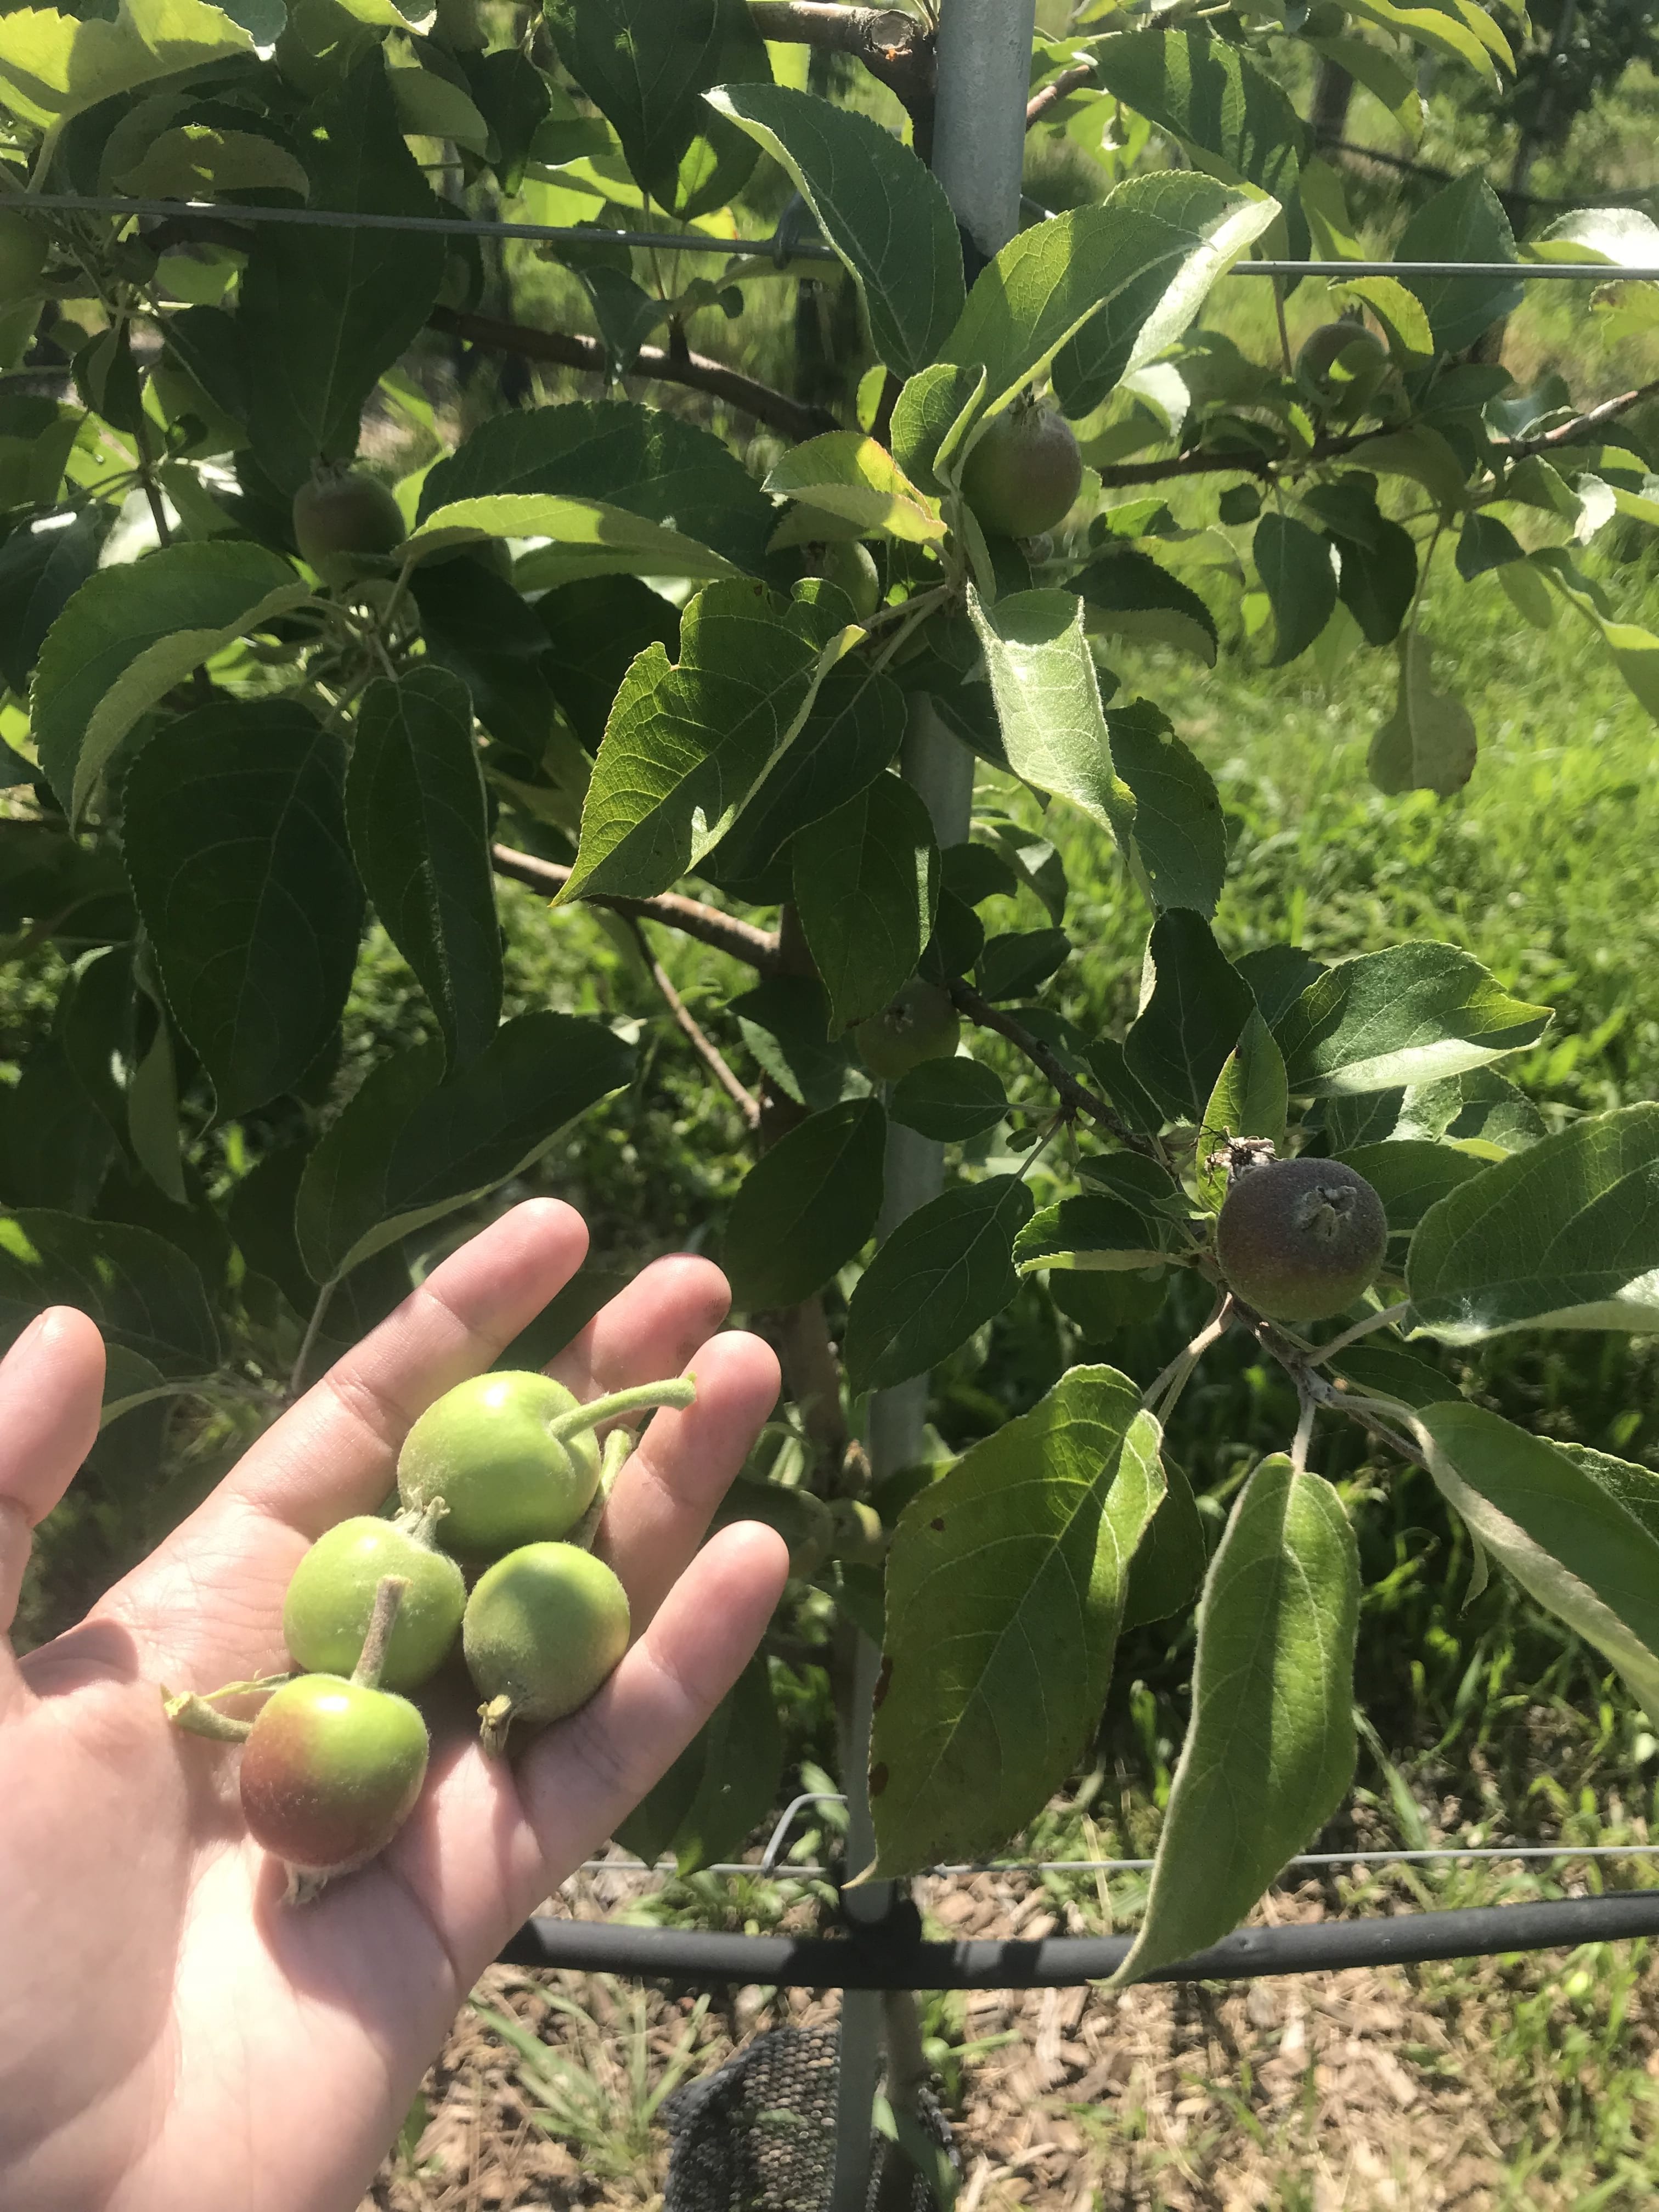
While Johnny Appleseed may have given many people the view that apples can be planted anywhere and maintain their growth perfectly for many years, this is unfortunately not the case. Apples are susceptible to diseases, pest pressures, and, if left alone, may not bear perfect-or hardly any-fruit every year. Growing up on a wheat farm, I knew about spraying fungicides and pesticides, but I never thought I would run into the problem of the crop having too high of a yield. Apples run into issues when they produce too much fruit, and can often fall into a biennial fruit bearing systems, meaning that they will produce a high volume of  fruit one year, but none the next. Many farmers spray chemical thinners when the trees are pollinating, which allow the king bud (the first bud to emerge) to remain, but prevents the subsequent buds from becoming fruit. At the Orchards, one of the research projects is focused on achieving the ideal crop load for producers, while preventing the tree from taking on a biennial growth pattern. Here is an example of a tree that has several fruit per cluster, which we (the interns) would then thin down (remove fruit from the trees) to a single fruit per cluster, ideally the king bud.

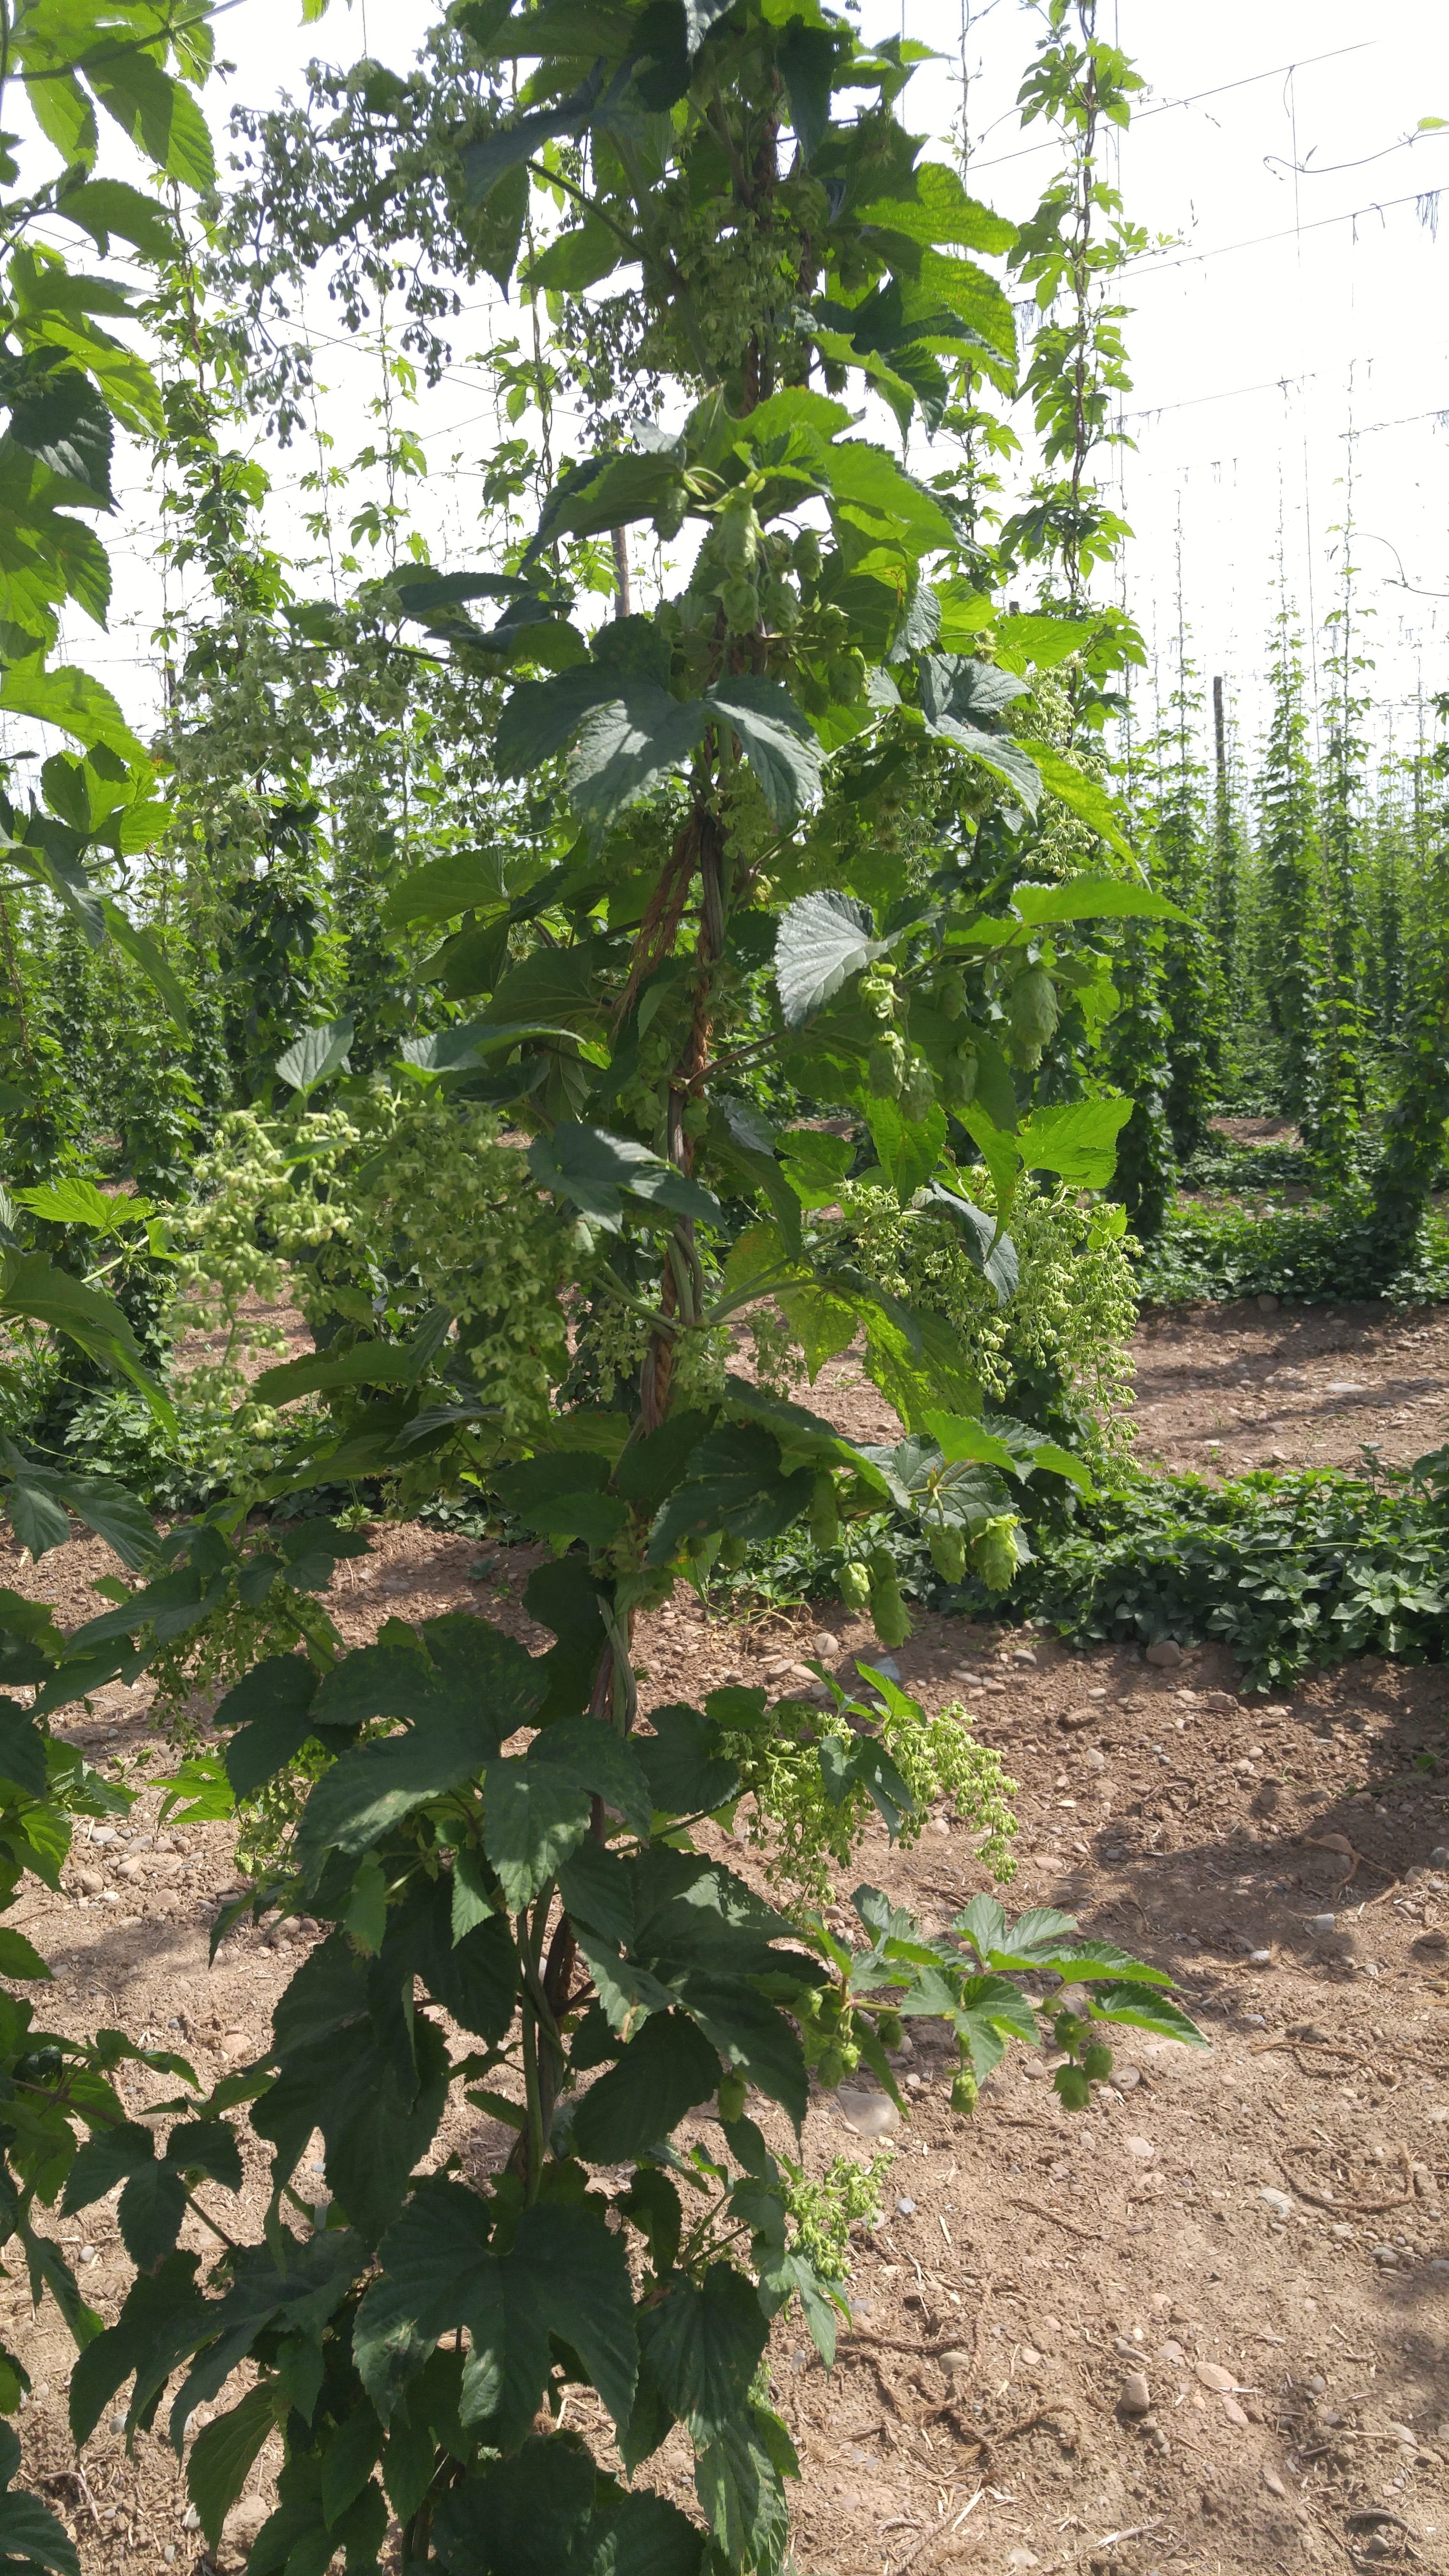
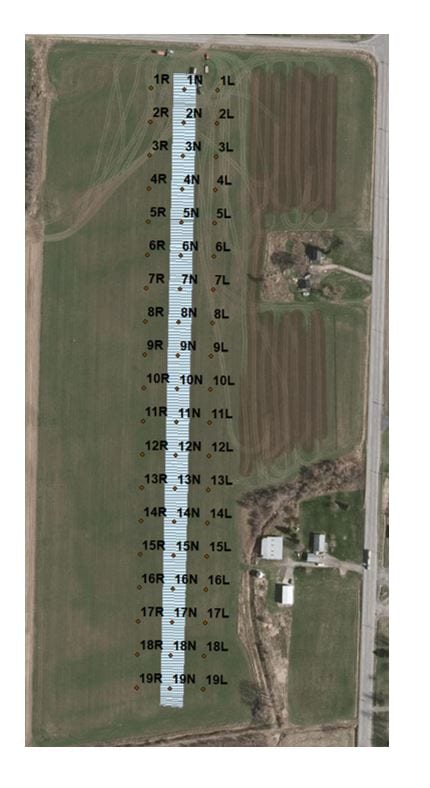
One research trial that has preceded my time as an intern, focuses on thinning trees down to 3, 6, or 9 times the fruit as the tree’s diameter, measured 12 inches above the graft union (the spot where new growth of trees are grafted onto their rootstock). There is also a category of trees that is thinned down to 0 fruit, or left unthinned.


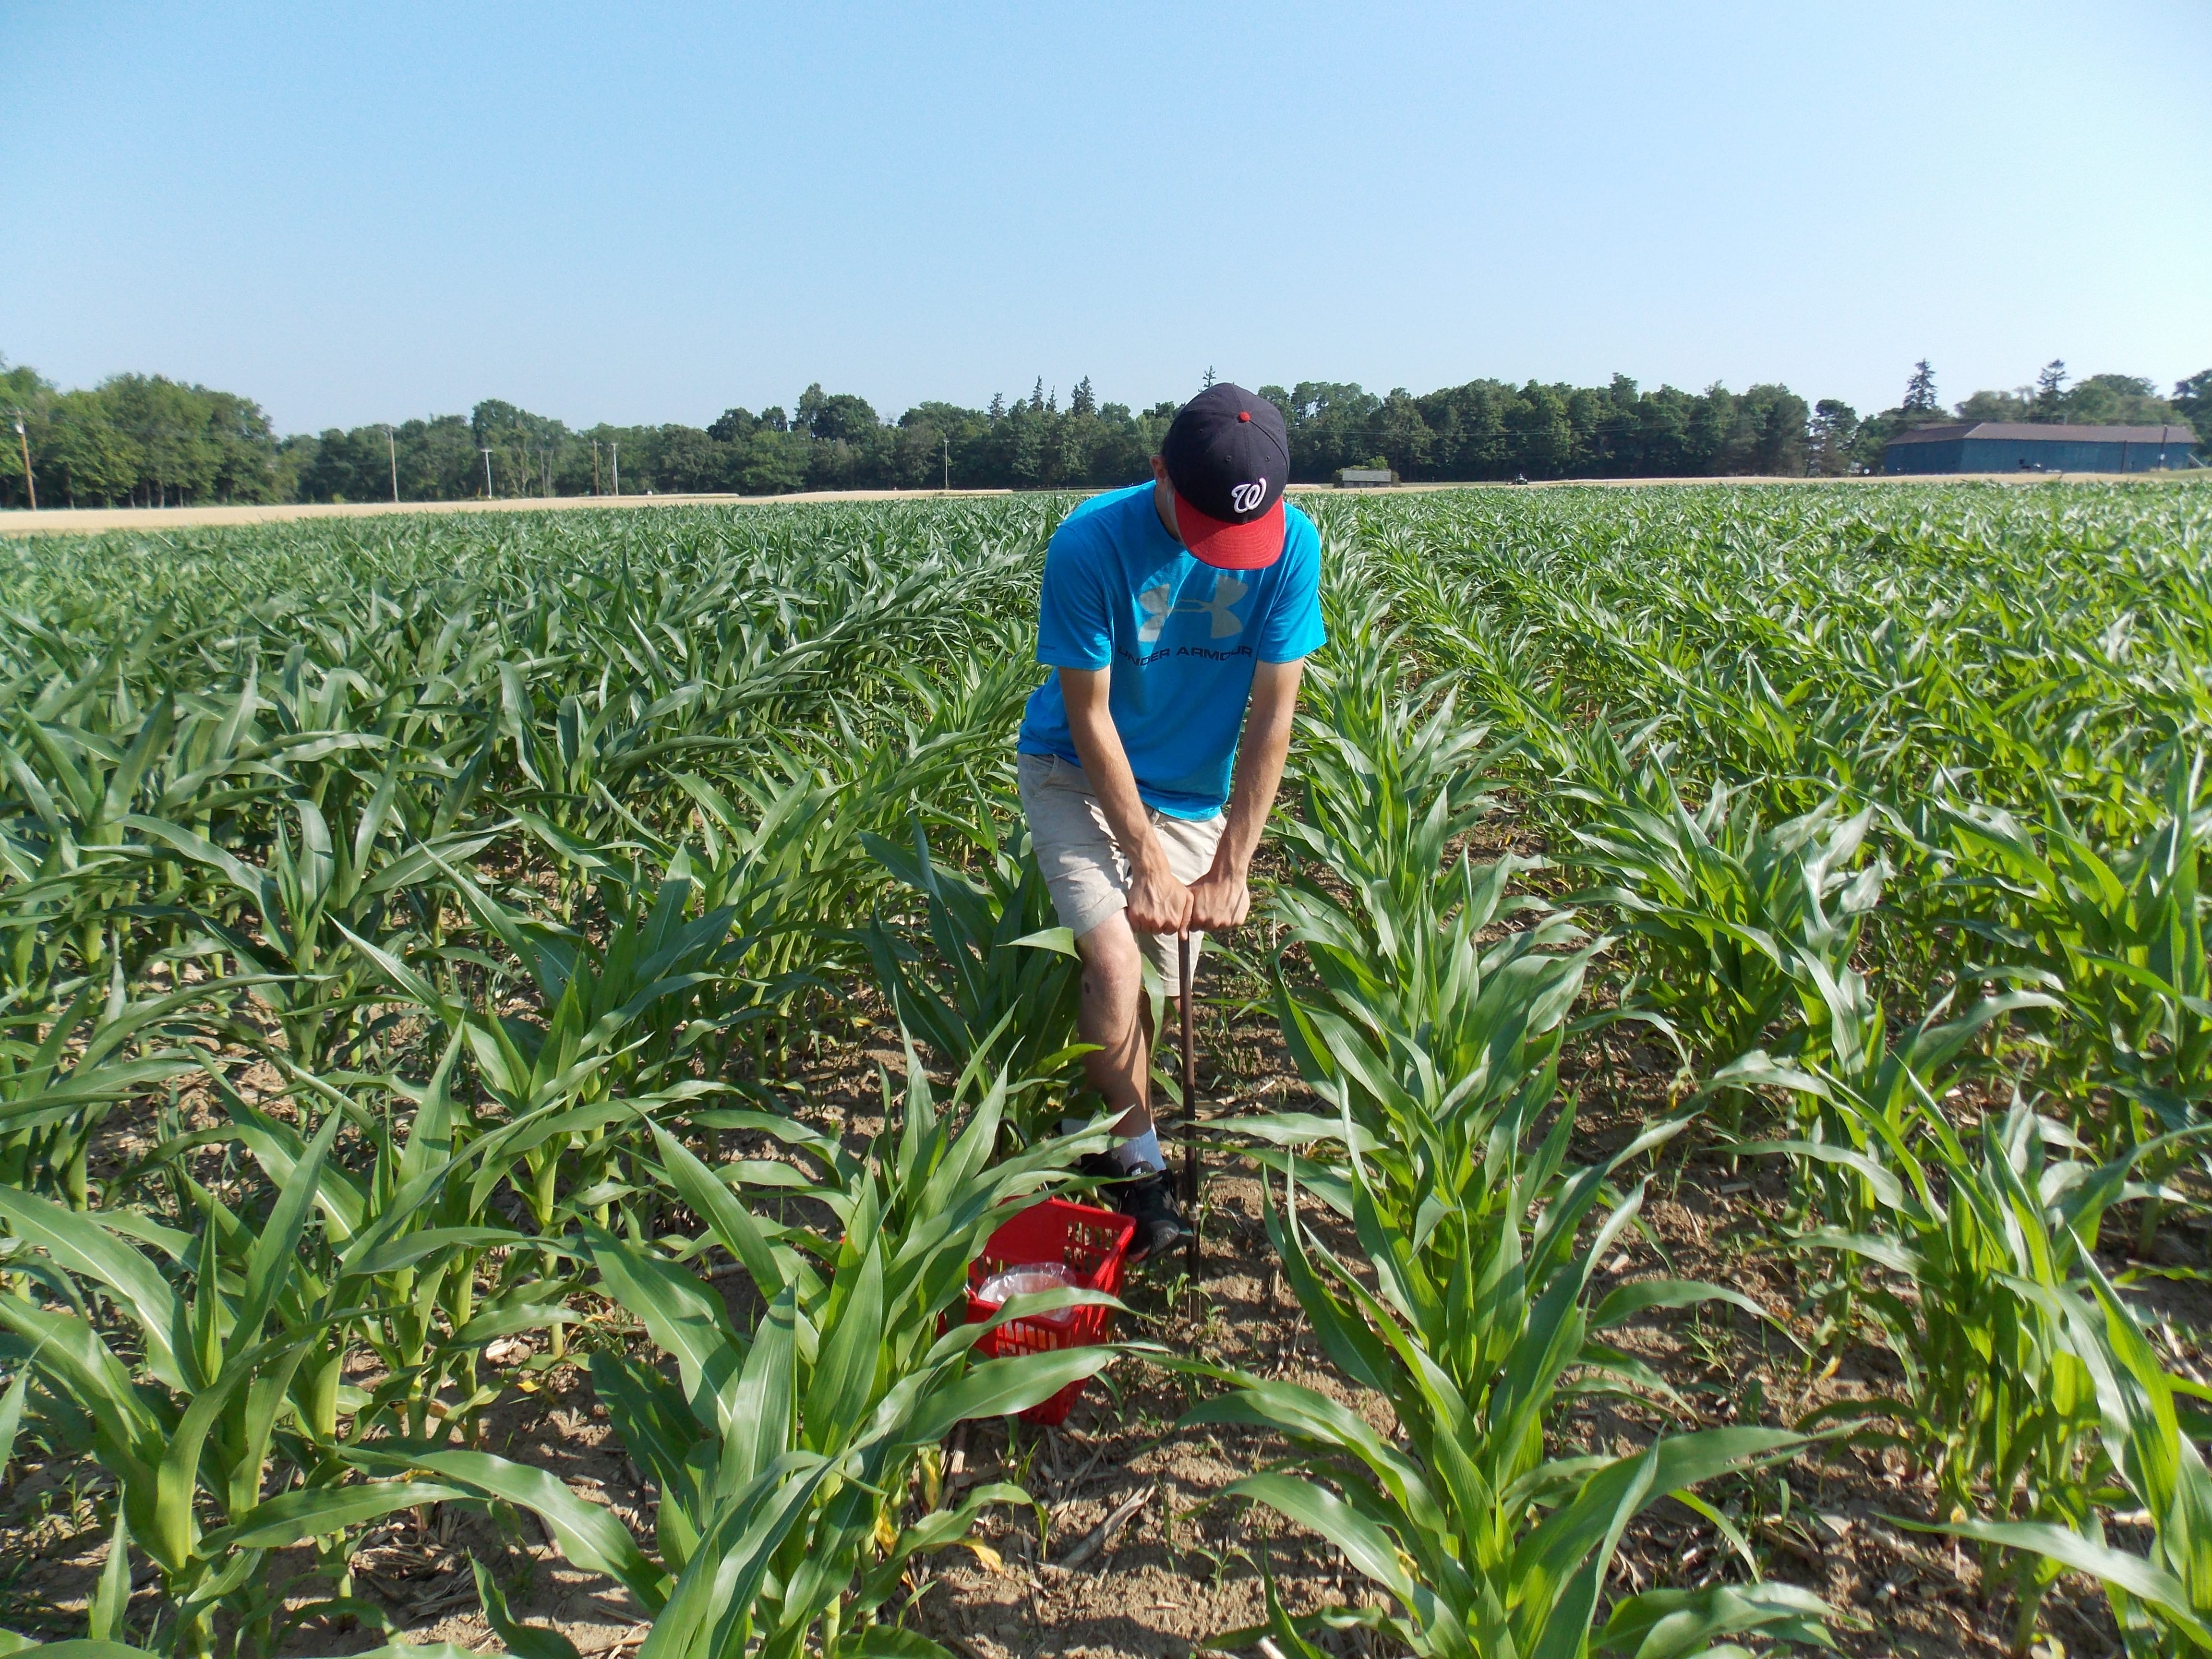
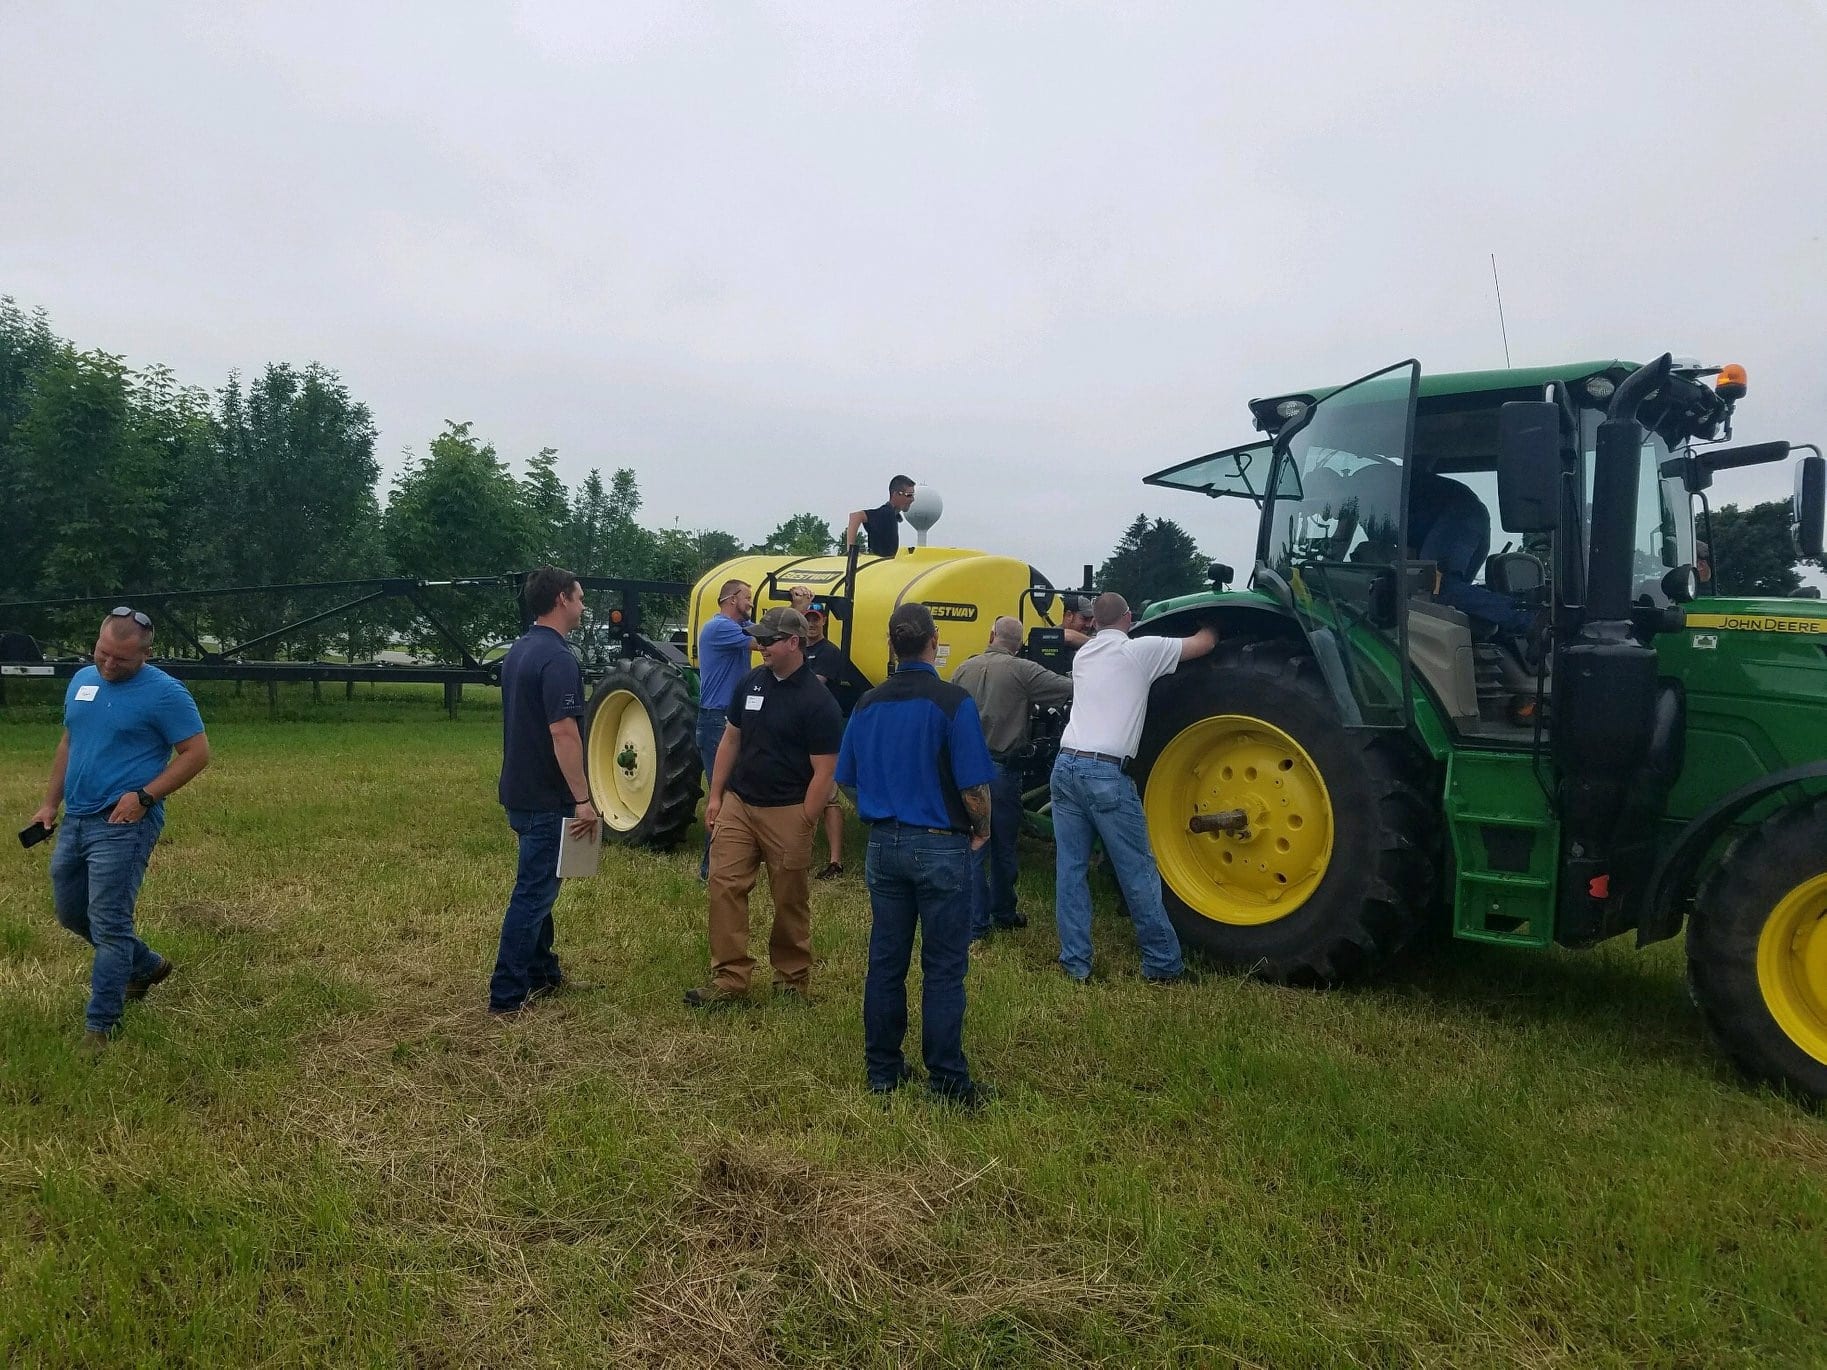
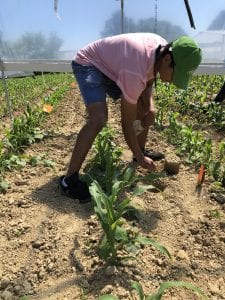
The Orchards staff and my fellow interns have spent long hours counting fruit, thinning fruit, counting, and trying to reach a specific, total number of fruit per tree. This will allow the researchers to note the number of fruit remaining in subsequent years, so they can allow producers to time their chemical thinners to a specific time. Here is an image of us diligently working on the project with staff at Cornell Cooperative Extension. While it may seem simple to thin fruit, it took many hours to achieve perfection on this research project.


From Hops to Blueberries

The past few weeks have flown by! The work has been steady and more tasks have been added to our plates.

The mite levels have slowly increased over the last few weeks with rising temperatures above 100 degrees. The mites move upward to reach the sunlight and are typically found congregating on the leaves that are within the top two feet of the bine. As soon as more than thirty mites or mite eggs are spotted in a field on a single leaf, the sprayers are notified and the field is sprayed within a few hours of our discovery.

Powdery mildew levels have also been increasing, particularly in the baby fields that are more susceptible to heat stress.

weevil

Onto the fun stuff! On Friday the 13th, we worked a half shift during the day, then came back to the farm at 10:00 PM to go weevil hunting until 3:00 AM! Weevils are a nocturnal pest that feed on the hop leaves. The only known control method for weevils is nematodes, and this research has only been conducted in greenhouses. Therefore, it is unknown whether nematodes would be a useful predator to distribute throughout the fields. Our goal was to scout 9 point in each field to determine which field has high weevil counts. Those with the highest counts would be considered for nematode distribution. My boss,  co-worker, and I split 
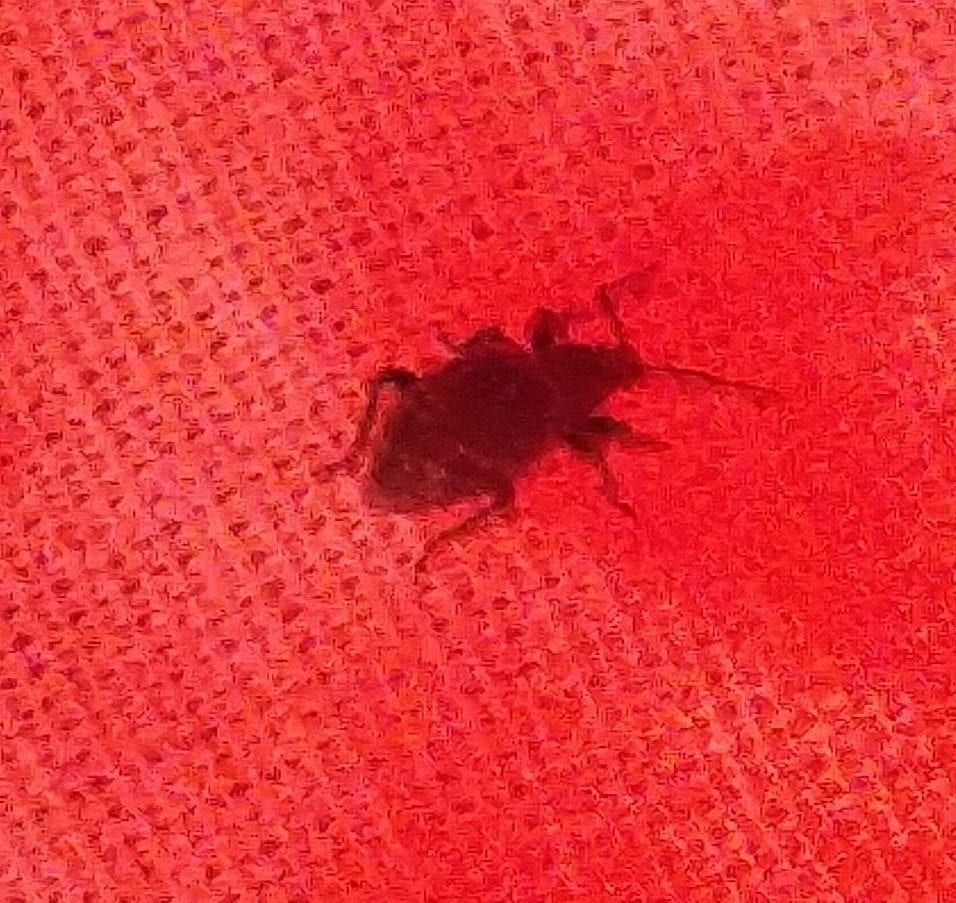
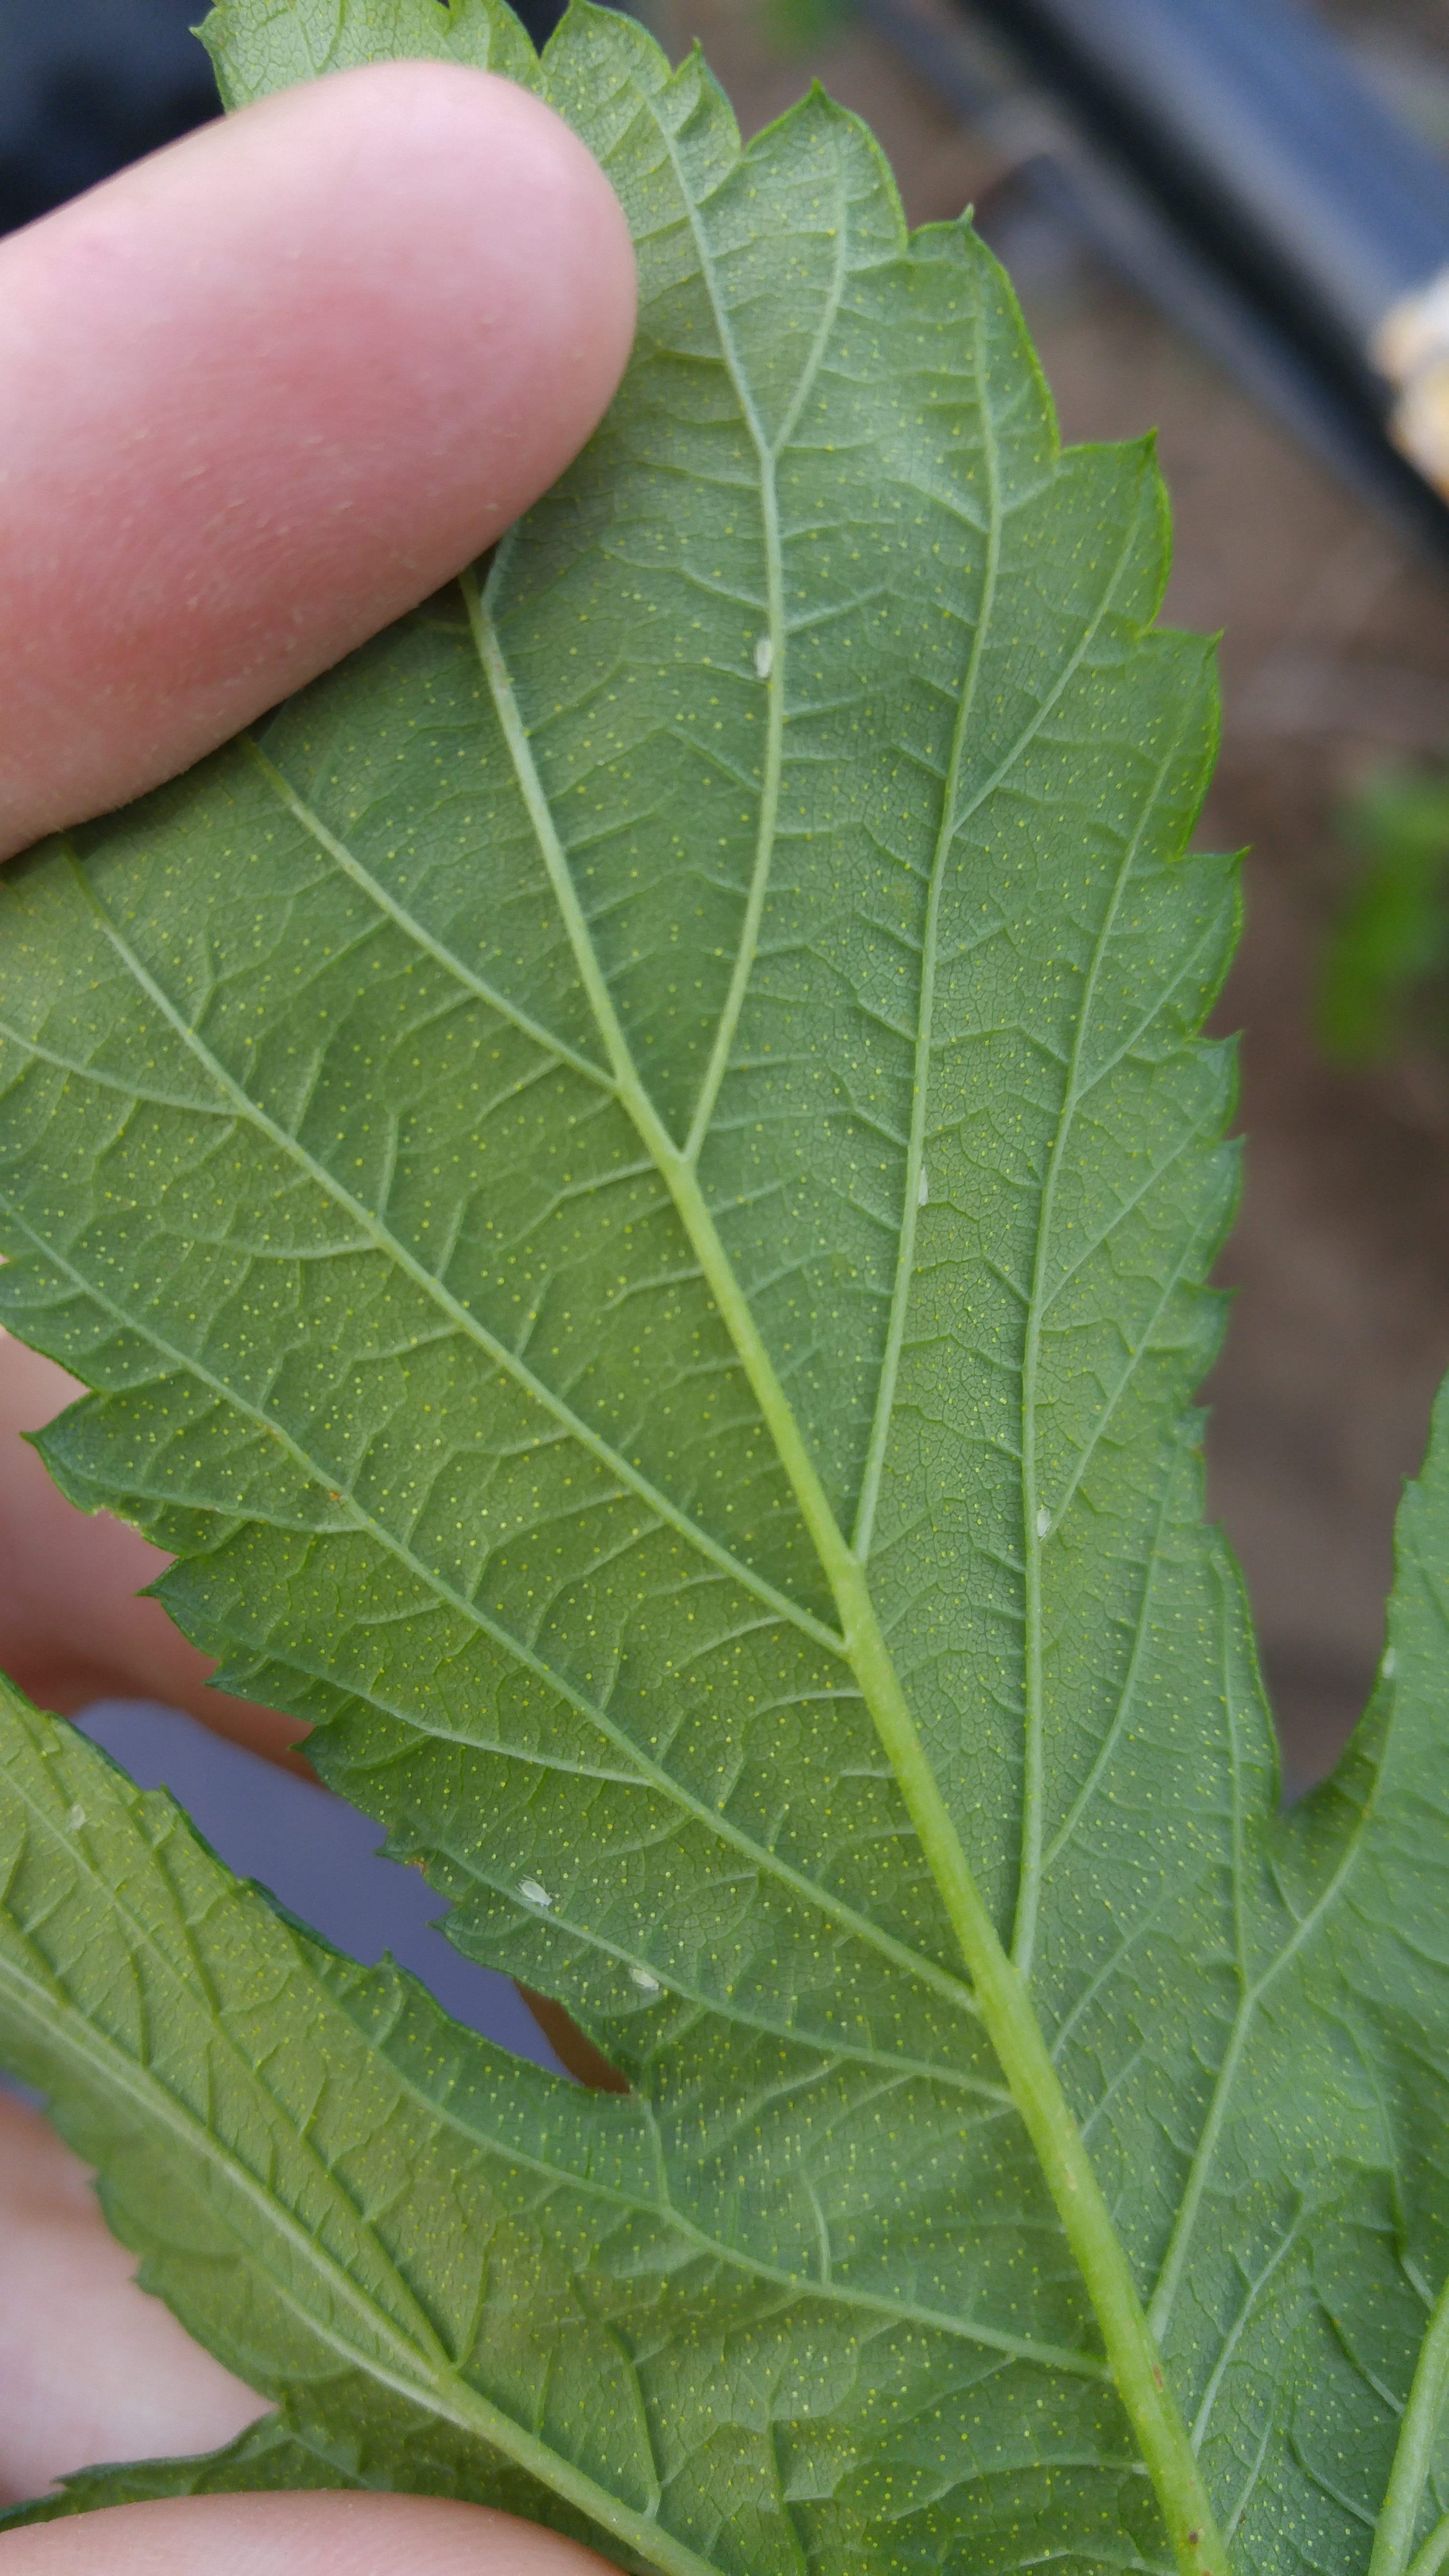
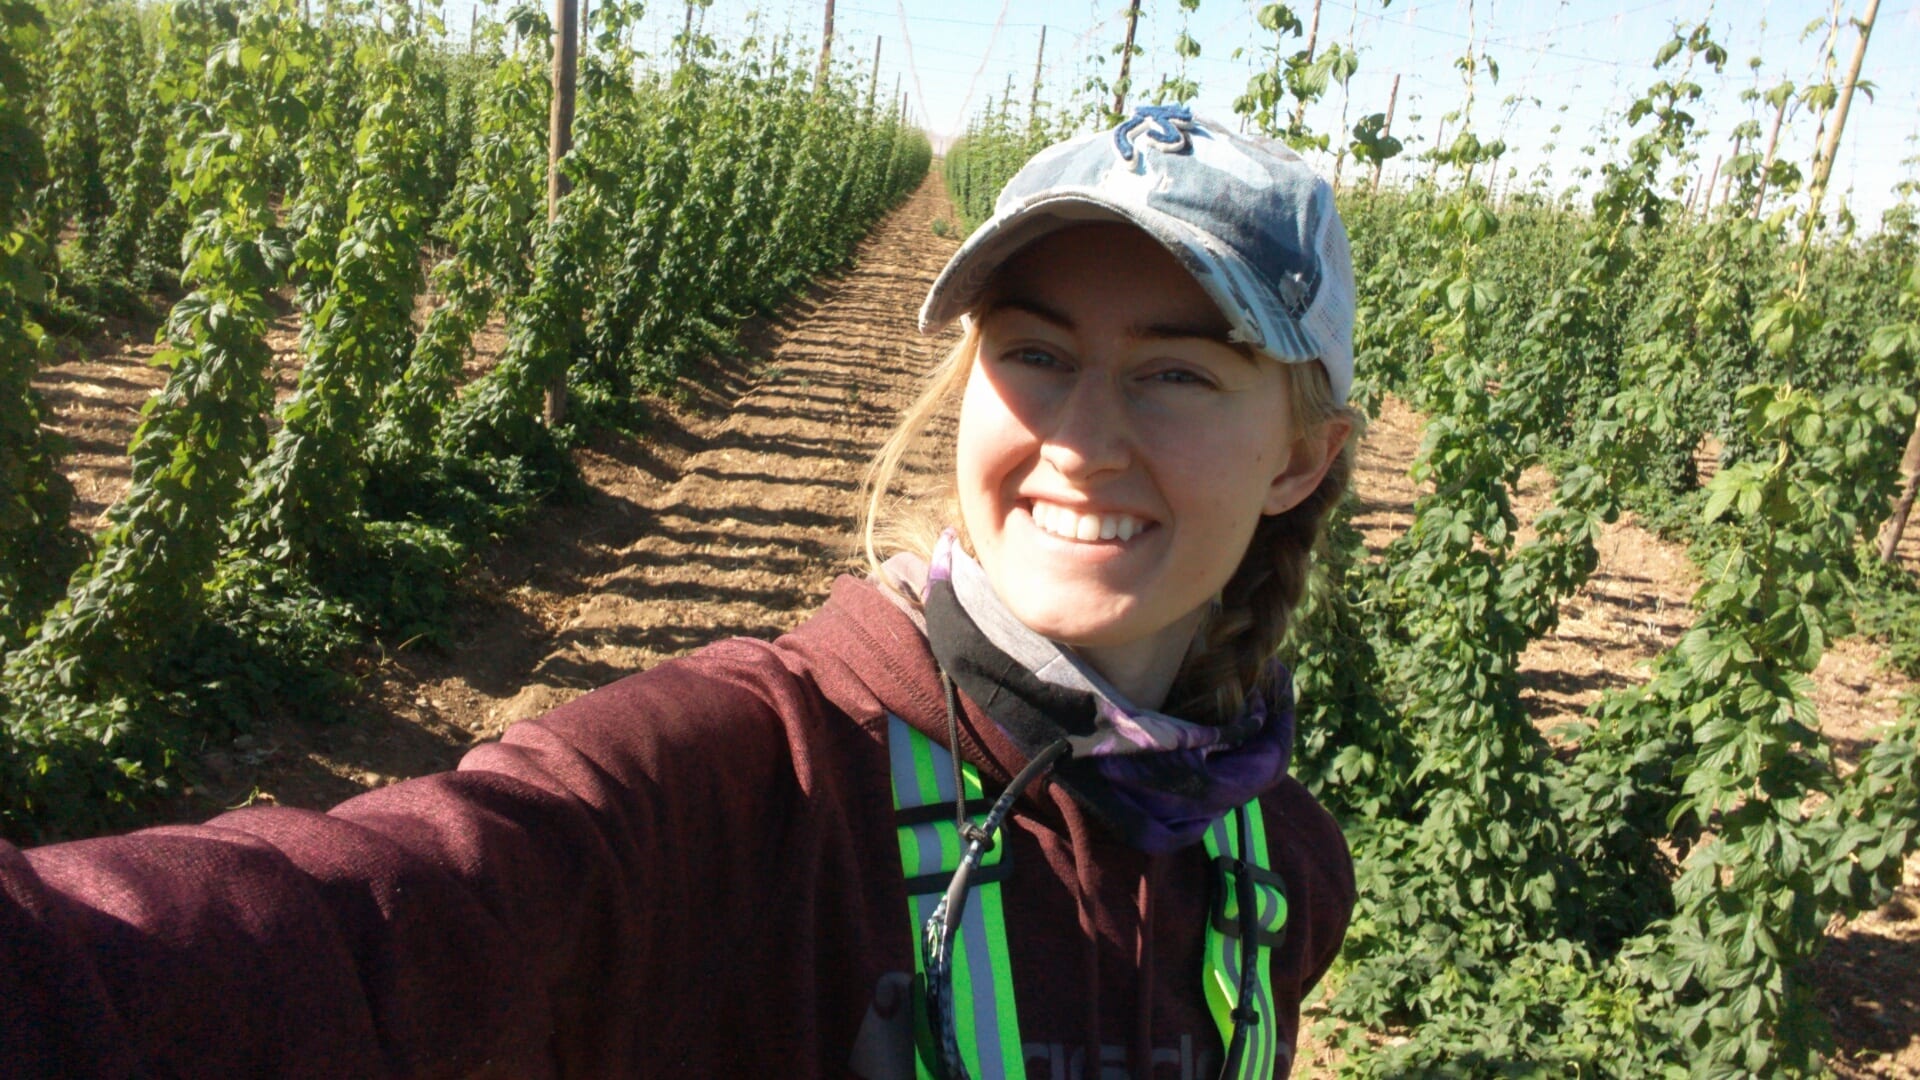
each field into thirds and chose a lane to take our counts from. We stopped at three points in our row, laid out a tarp, and beat the back of a bine with a stick to see how many weevils fell out. We recorded the number of weevils that fell onto the tarp. There were only a few fields that had relatively high counts and control methods have yet to be determined.


We have now begun taking sap analysis samples on leaves from the organic blueberry fields. This past week was my first time being over there and it was quite an experience! I was able to catch the blueberry harvester in action while collecting leaves. We will be collecting leaf samples from the blueberries for the next few weeks so I look forward to getting back over there, especially before everything is harvested!


blueberry harvester


The hops have also been slowly getting bigger! These are from the same Palisade field that I showcased in the previous blog post. We are starting to smell the aroma characteristics of each hop variety.

Finally, here is a sunrise photo I was able to capture just before starting my fields last Monday. Enjoy!

Summer? Where did it go?

Kreher Family Farms certainly knows how to keep summer interesting! If we just grew one or two crops, that might be a different story but the diversity certainly keeps things interesting. This past month has included many exciting events including a visit from the Wegman family on the farm and a trip to the Cornell Field Days at the Musgrave Research Farm.

Not only does the Kreher family grow field crops for the chickens along with

Baby leaf lettuce harvester! 100% stainless steel construction for sanitation purposes!

green beans and beets, they are also involved with a baby leaf lettuce operation in Brockport, NY. The baby leaf lettuce operation is run by Duncan Family Farms who is based out of the South West but is beginning to expand their baby leaf operation into the North East. We had the honor of joining the Duncan Family Farm team in hosting a farm tour for the Wegman family. The day was thoroughly enjoyed by all. Not only was it a unique opportunity to meet the Wegman family but also to learn more about the baby lead operation that Kreher’s are connected to.

The Wegman Family and Executives joined by the Kreher Family Farm and Duncan Family Farm Management!


Some of my more routine days are spent scouting fields for insect and disease pressure along with monitoring crop development. Our spring peas have been harvested, our beets are sizing up nicely and on track for harvest in September, our snap beans are beginning to be harvested daily and, our corn is looking for any drop of moisture that is out there! We have laid miles of irrigation pipe in the past few weeks to irrigate the green beans while praying for rain to help other crops. Finally, our wheat fields have all been combined and our malting barley is days away from harvest!

The beets are coming along nicely however New York soils can have lots of variability that can lead to size differences in the cotyledons, as pictured above.

Malting Barley on a beautiful summer morning!

Cherry Training Systems: UFOs and KGBs-But Not Flying Saucers or Russians

During my time at Cornell Orchards, I’ve learned about management systems for a variety of fruits. One of the newest fruit systems in the Orchards are UFO and KGB cherry training methods. When left to their own defenses, cherry trees can grow to heights that make the tree harder to harvest and less efficient in fruit production. Without management, cherry trees have a central leader, have strong apical dominance, and can take years to produce a fruit crop.

This is what the cherry trees look like without any intervention. You can see that a large amount of the  fruit crop is located above the area where pickers can reach without a ladder, and much of the tree is not utilized in fruit production. These are sour cherries at the Lansing location of Cornell Orchards. (they made great dessert tarts!)

To combat the problems of natural cherry tree growth patterns, faculty at Cornell Orchards have planted cherry trees to be managed in Upright Fruiting Offshoot (UFO) and Kym Green Bush (KGB) systems. These systems allow the trees to be planted in higher densities than natural growth systems, and allow for fruit to be located more conveniently for pickers.

Recently, my fellow interns and I helped set up the trellising for the UFO systems. These trees are trained to create a narrow fruiting wall, much like grapevines. The trunk in UFO systems is trained to grow in a horizontal pattern low to the ground, and have new growth grow vertically on fruiting wires about every 8 inches. Here is a picture of the UFO system at the Orchards:

The trunk is trained and tied down to a lower wire, and each shoot is tied upwards with rubber wire to a top line. With this system, we used rubber to tie the branches upright instead of wire. This was done because cherries and other stone fruit are susceptible to bacterial canker. This disease can fester through cuts during wet weather, and the rubber may prevent wounds in branches.

The other system we have at the orchards is the KGB system. Here is one of the trees at the orchards that was trained in the KGB system.

In this system, the shoots are pruned regularly to keep the tree bush height. This keeps the vigor of the tree low, and keeps all fruit at eye level or lower. KGB pruning keeps shoots productive and efficient for fruit growth.

One of the best parts of this internship has been quality control and taste tests on the amazing cherry crop! They tasted just as good as they looked!

Data Processing

A picture of what the greenseeker data looks like once it is loaded into ArcMap. Each line accounts for the L,N, and R strips.

Once the data is collected, it is time to make use of it. The NDVI  data from the greenseeker is put into ArcMap. ArcMap is a software program that allows for the spatial analysis of relationships. It is extremely useful not in gathering information but in manipulating it in order for conclusions to be made.

First, the data is cleaned and trimmed so there are no outlying values present. Points are added to make the the polygons that will create the final data set. Once the polygons are made around each strip, the join function will be used. The join tool uses one data set’s attributes to and fixes that to another’s location. Each strip gets its one attributes. Then from that the difference in NDVI can be determined between each strip.

A picture of the data set from the joined data sets. It may not look like much, but it holds lots of important information.

This is done for each and every field. A report is made of all the fields. The increased NDVI in the Nrich strip supports that the corn is healthiest where it has sufficient nutrients. It is also worth noting that the average NDVI for all fields that were recorded at V6 is higher than the other fields at V5 and V4. This type of approach can give us insight on what areas of the field are the healthiest in order to manage accordingly.

A picture of the final report of the NDVI for all fields including the average, and the average according to the stage when the data was collected.

Data Collection

A picture of myself taking soil samples in a strip.

Just before the side-dress nitrogen fertilizer is applied to the corn fields, it is time to do a lot of field work. To begin, the PSNT (pre-side dress nitrogen test) is taken. They are soil samples taken in relation to the GPS points in the field. It requires 8 cores of soil from 12 inches deep. Along with that is sample of 8 cores at 8 inches deep to measure the concentration of other macro nutrients like potassium and phosphorous. Each field has a L, R, and an N strip. The N strip is where the extra fertilizer is added to. Depending n the size of the field, the number of points vary. In some fields there may be up to 19. That is 114 soil samples for one field!

Another job is to walk the greenseeker. The greenseeker is a device that measures Normal Digital Vegetative Index (NDVI). It is used to quantify vegetation by measuring the difference between near-infrared (which vegetation strongly reflects) and red light (which vegetation absorbs). This is one way to estimate the potential yield.

ndvi formula

The formula for NDVI. NIR stands for the near-infrared light reflected and Red is the amount red light absorbed.

Covering each strip does take a long time since there is only one greenseeker. It’s especially grueling during the heat and humidity of summer while keeping at a constant speed at 3 feet above the canopy.

A picture of myself walking the greenseeker at Aurora.

Drones flying can be very challenging.  Weather and surrounding objects play a large role in the success of a drone flight for a particular field.  The drone is responsible for taking multi spectral satellite images that measures the amount of reflected light by the plants from the sun.

A close view of the drone used to take light images.


It has been an insane period of time traveling across the New York from Peru, to Hudson Falls, and to Perry. In total 30 fields and 5 research plots were soil sampled, had greenseeker data, and drone images taken. A total of 3147 soil samples! The next part of the project is processing the data in order to make sense of it all.

Agrinetix

Hello everyone my name is Travis Mattison and I and currently a junior in the Agricultural Sciences Major. I am doing my internship this summer with a precision agronomy company out of Rochester, NY called Agrinetix.  Agrinetix has its hands in all aspects of agriculture from selling GPS guidance systems and autosteer to fertility management plans, water management,  spray and fertilizer application control systems as well as a GIS department that does EC/field mapping, NDVI imagery and yield and planter mapping. This summer my main focus is working as a technology integrator installing and maintaining Trimble Guidance systems, 360 Yield center products, Precision planting products and Raven control systems.

The First two weeks were an extremely busy planting season. I was on the road almost everyday traveling to different farms across New York state mostly servicing Trimble GPS systems controlling auto-steer in the tractor as well as planter controls. After the hectic first couple weeks myself and the other tech integrator Chris went out to Ohio State University Agriculture Research and Development Center for a two day training conference put on by Trimble on a new product they released. The release was for the GFX750 display and NAV 900 controller as well as the Muller ISO ecu. This was a great experience receiving training on the product as well as networking with others in the precision agriculture industry from all over the United States and Canada.

Males, Mites, and Aphids

The workload for these last two weeks has steadily increased. The pests have gradually been increasing in the fields and I have begun to see more aphids and a few two-spotted spider mites. However, since the temperature hasn’t been as high as it usually is by this time of year, there are still not too many problems with pests. We are expecting temperatures to increase in July and two-spotted spider mites to become more of an issue then.

Look Closely to See a Two-Spotted Spider Mite!

During week three, I found an abundance of aphids in one section of a field. Ultor, an aphicide, was sprayed on just those twelve rows which terminated the aphid population.

Aphids

The newest addition to our daily schedule is roguing. Roguing is scouting for male plants. The fields we are roguing had high seed percentages per barrel this past fall. Therefore, it is our job to find them, mark them, and cut them down. Later in the season, other workers will come in and remove the hills that we’ve marked to ensure that the males do not grow back next year. It is usually very obvious to spot the male plants because they have visibly large pollen sacs attached to the bines, as pictured below. However, if the plant hasn’t fully expressed itself yet, it can be very difficult to spot male plants which means very thorough checks must be made to ensure none are missed. My colleague and I scout every other row of a field to check for males. If a field is abundant in males, it can take us around six hours to complete a ninety row field. Therefore, we break up the time spent scouting over a few days. There are some bines that can also be hermaphroditic, due to an environmental stress that the bine may be under. We have to severe these bines as well to ensure that pollination does not occur.

Male Bines 

Hermaphroditic Bine

Another task which I have been assigned with is taking soil measurement readings in two fields. My supervisor manages the irrigation in these fields. The water conductivity of the soil is highly variable in these two fields, which means that soil moisture must be closely tracked to ensure that the bines aren’t receiving too much water to cause leaching, and so that they don’t dry out. My job is to take three readings in each of the eight zones so that I can develop a graph that shows the soil moisture for each zone in the field. My supervisor then makes decisions on the length of time the irrigation will run and how many times a day these fields will be irrigated.

To finalize this post, there are hops growing now! Below you can see baby cones developing on Simcoe and larger cones that have started growing on Palisade. If you can’t tell by the picture below, I am absolutely loving working with the hops!

Baby Simcoe cones

Palisade Cones

Nrich Strips

Corn is an extremely important crop to agriculture in New York State and nitrogen is the most limiting nutrient. The work being done my supervisor in the Nutrient Management Spear Program is to study how added nitrogen affects corn yields. The studies are called Nrich strip trials.

In order to begin the study, fields with at least three years of yield data are selected, preferably large ones since they typically have more variability. The yield data is arranged to represent 4 different quadrants in the field.

Quadrant 1- High yielding, low variability

Quadrant 2- high yielding, high variability

Quadrant 3- Low yielding, high variability

Quadrant 4- Low yielding, low variability

A week after planting, a strip spanning the length of the field is laid out. It is where the extra nitrogen fertilizer is applied at side dress time, usually 75 lbs. more per acre. The strips are about two chopper or combine passes wide in order to draw accurate conclusions.


A quadrant map of two fields selected for this project. The gray marks indicate the area for extra nitrogen fertilizer.


Once the trial is set up, GPS points are taken in the field. The points are the locations from where the pre-side dress nitrogen test (PSNT) will be taken. A PSNT measures the amount of nitrate (NO3-) in the soil. Nitrate is an inorganic form of nitrogen that plants most readily take up. Along with the PSNT, drone images, and green seeker data is taken when there are six collard leaves on the plants, otherwise known as V6 stage. That is where I will begin my next post.


A hand-held GPS.

GPS points taken from the field are downloaded into Arc Map to create a map like this. The white rectangle represents the Nrich strip.


This is a diagram explaining what collard leaves on a corn plant look like.

Sample don’t trample

The golf hole cutter made work easy.

This week we completed the drought experiment at Leland. The experiment was to see how climate change can impact plant competitive ability under drought and non-drought conditions. Last year the experiment was done with morning glory, and this year it is with bur cucumber. The bur cucumber was transplanted from a corn field in Barton to our field in Leland.

We then placed 16 rain shelters into the field. The plots in the field varied with different bur cucumber densities between corn rows, and each density had a drought and non-drought area. Then we put moisture sensors 6 inches into the ground. Rain water was collected in gutters and dispersed by tile drains. As we did moisture readings each week I got an idea of how well the shelters were working.

Bur cucumber within corn row.

When collecting moisture readings I had to be careful not to trample the crops. This is a challenge when I collect Rye or Kernza samples. But in this field I had to be extra careful not to get caught in the bur cucumber or trip over the cable holding down the shelters. The Bur cucumber grew vigorously next to the corn using its tendrils to climb. For five weeks data was recorded. We discovered that a rodent had bitten one of the cables where were finding negative data. It is visible obvious that the corn under the shelters has been stunted. We also collected corn height for each subplot. Using the data we’ve collected we will get a better understanding of how climate change impacts weed species’ competitive ability.

Here is a video that helps visualize the extent of the low precipitation in Ithaca: Taughannock_Falls_drought-14cis42

Skip to toolbar