
Hannah Roman

Scouting Fun – Soil, Worms, Slugs, and Bugs

Scouting Fun – Soil, Worms, Slugs, and Bugs
July 8th

The last two weeks have cruised by! I have been busy learning more about the crop management process. The first step to addressing any problem is making a diagnosis! So, with some guidance, I have taken to the fields for some scouting to observe the corn’s progress and determine if any management strategies have to be tweaked.

Some of the things we were on the lookout for were physical damage to the corn, weed presence, overall size and appearance indicating health and nutrient availability, plant viruses/diseases, pest damage and which pests, and overall field conditions or anything that could affect the crop’s growth. While in the fields, we also took selective soil samples to measure how the weather had influenced nutrient availability and determine if additional fertilizer was needed.

I was able to find some interesting indicators in some fields.

Some signs of pests:

Deer damage to the top leaves was from a bite off the very tip of the young plant.

Slug damage was found in some fields near wooded, cooler, or wetter areas.


An interesting and more damaging pest than the smaller scale ones above; we had one instance of cutworm. The conditions and field history have to be exactly right for the cutworm to be an issue, so it was an interesting ailment to see.

As the name describes, the damage from the cutworm eats right through the main stem of the young plant, and cuts it in half.
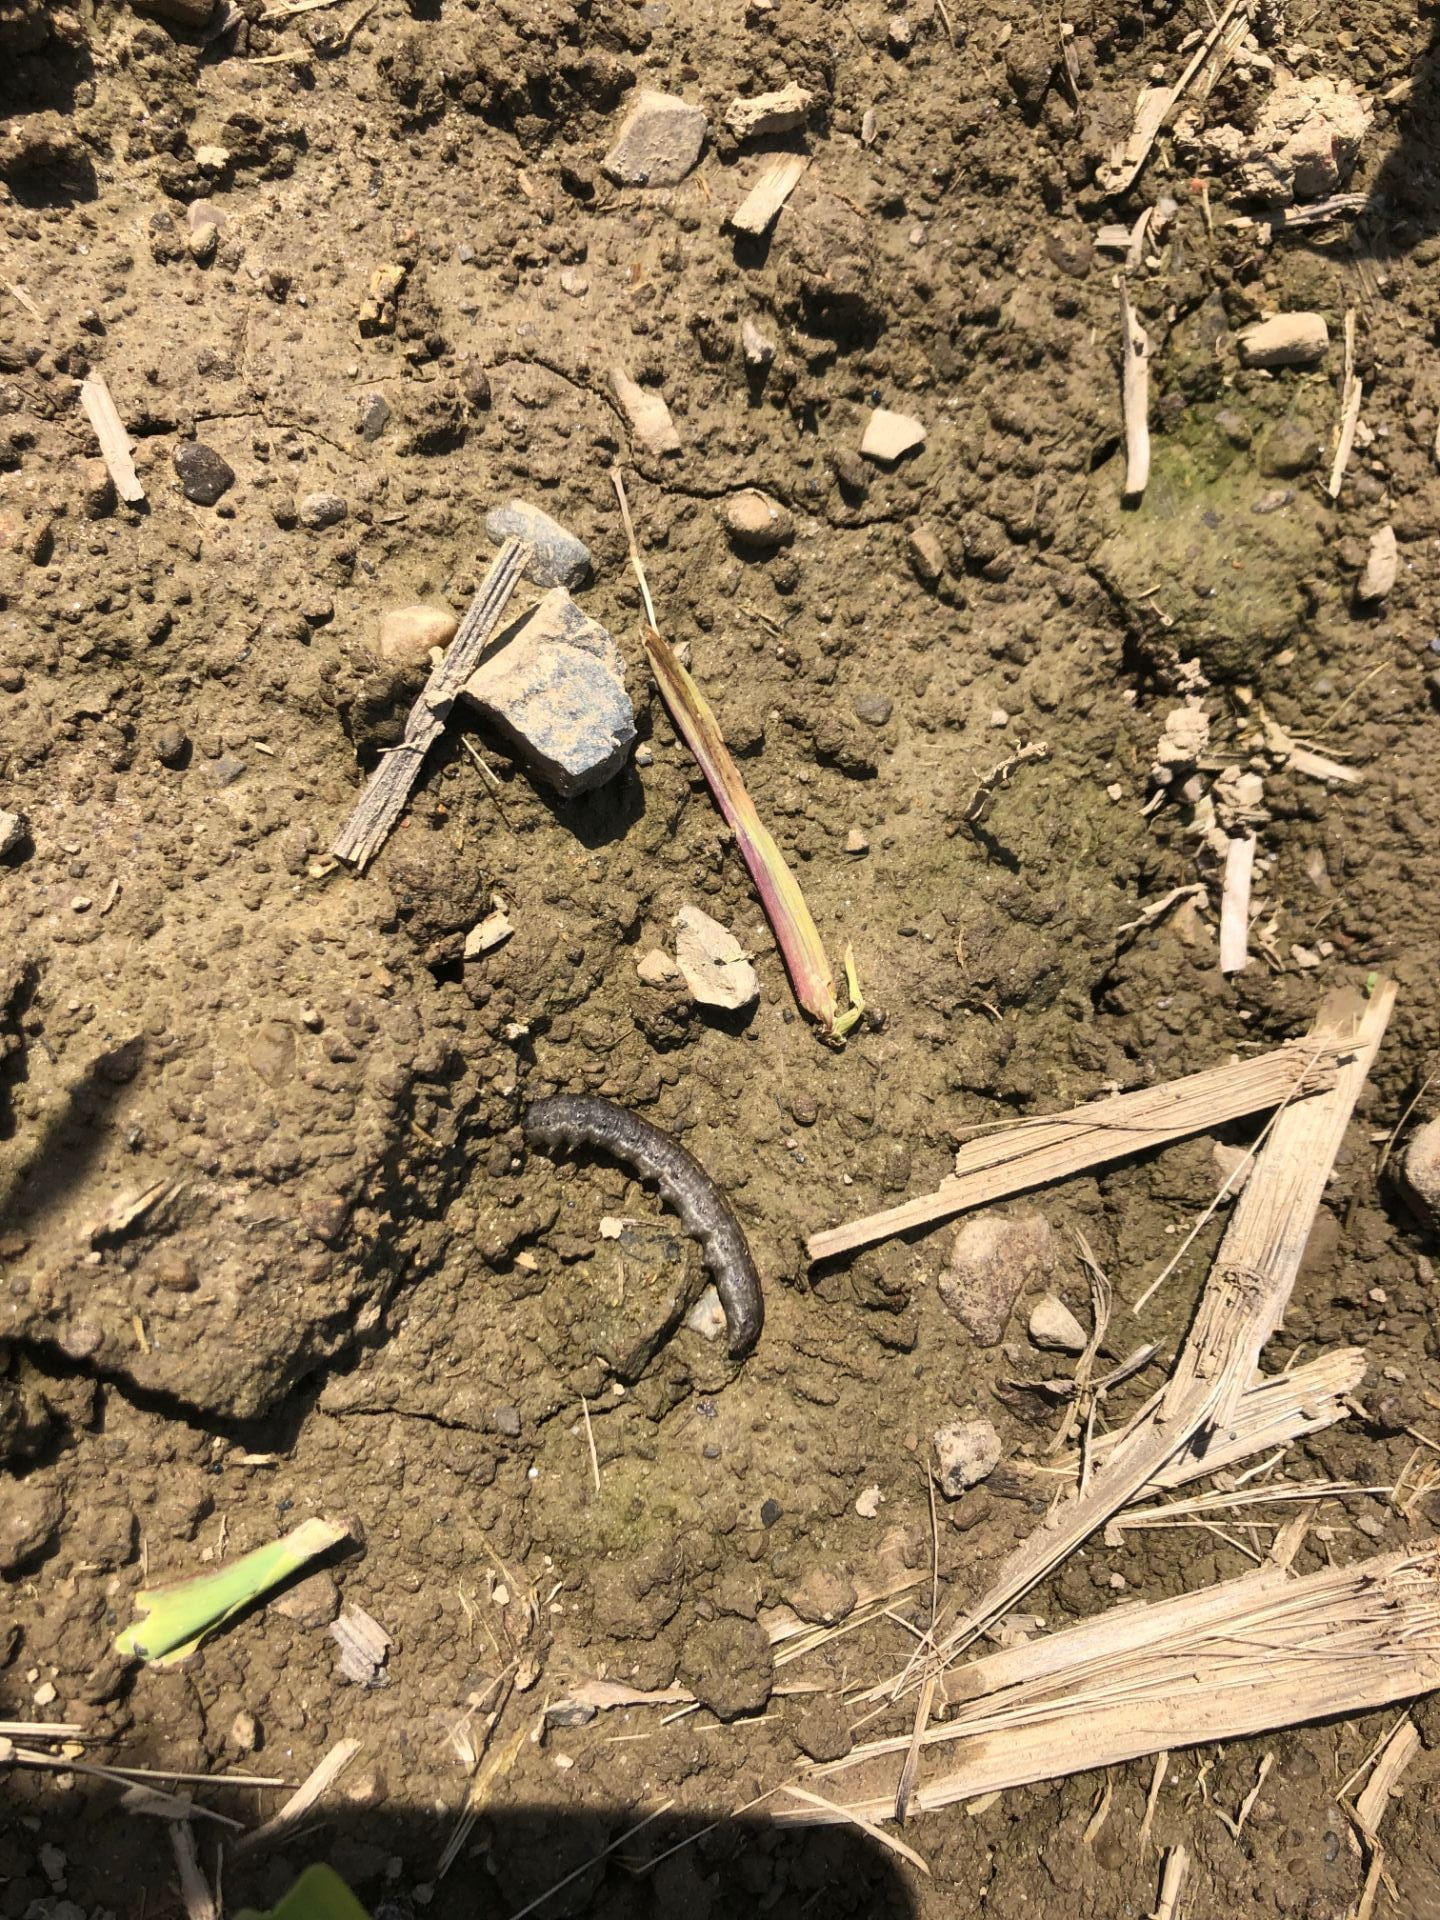
Cutworm larvae


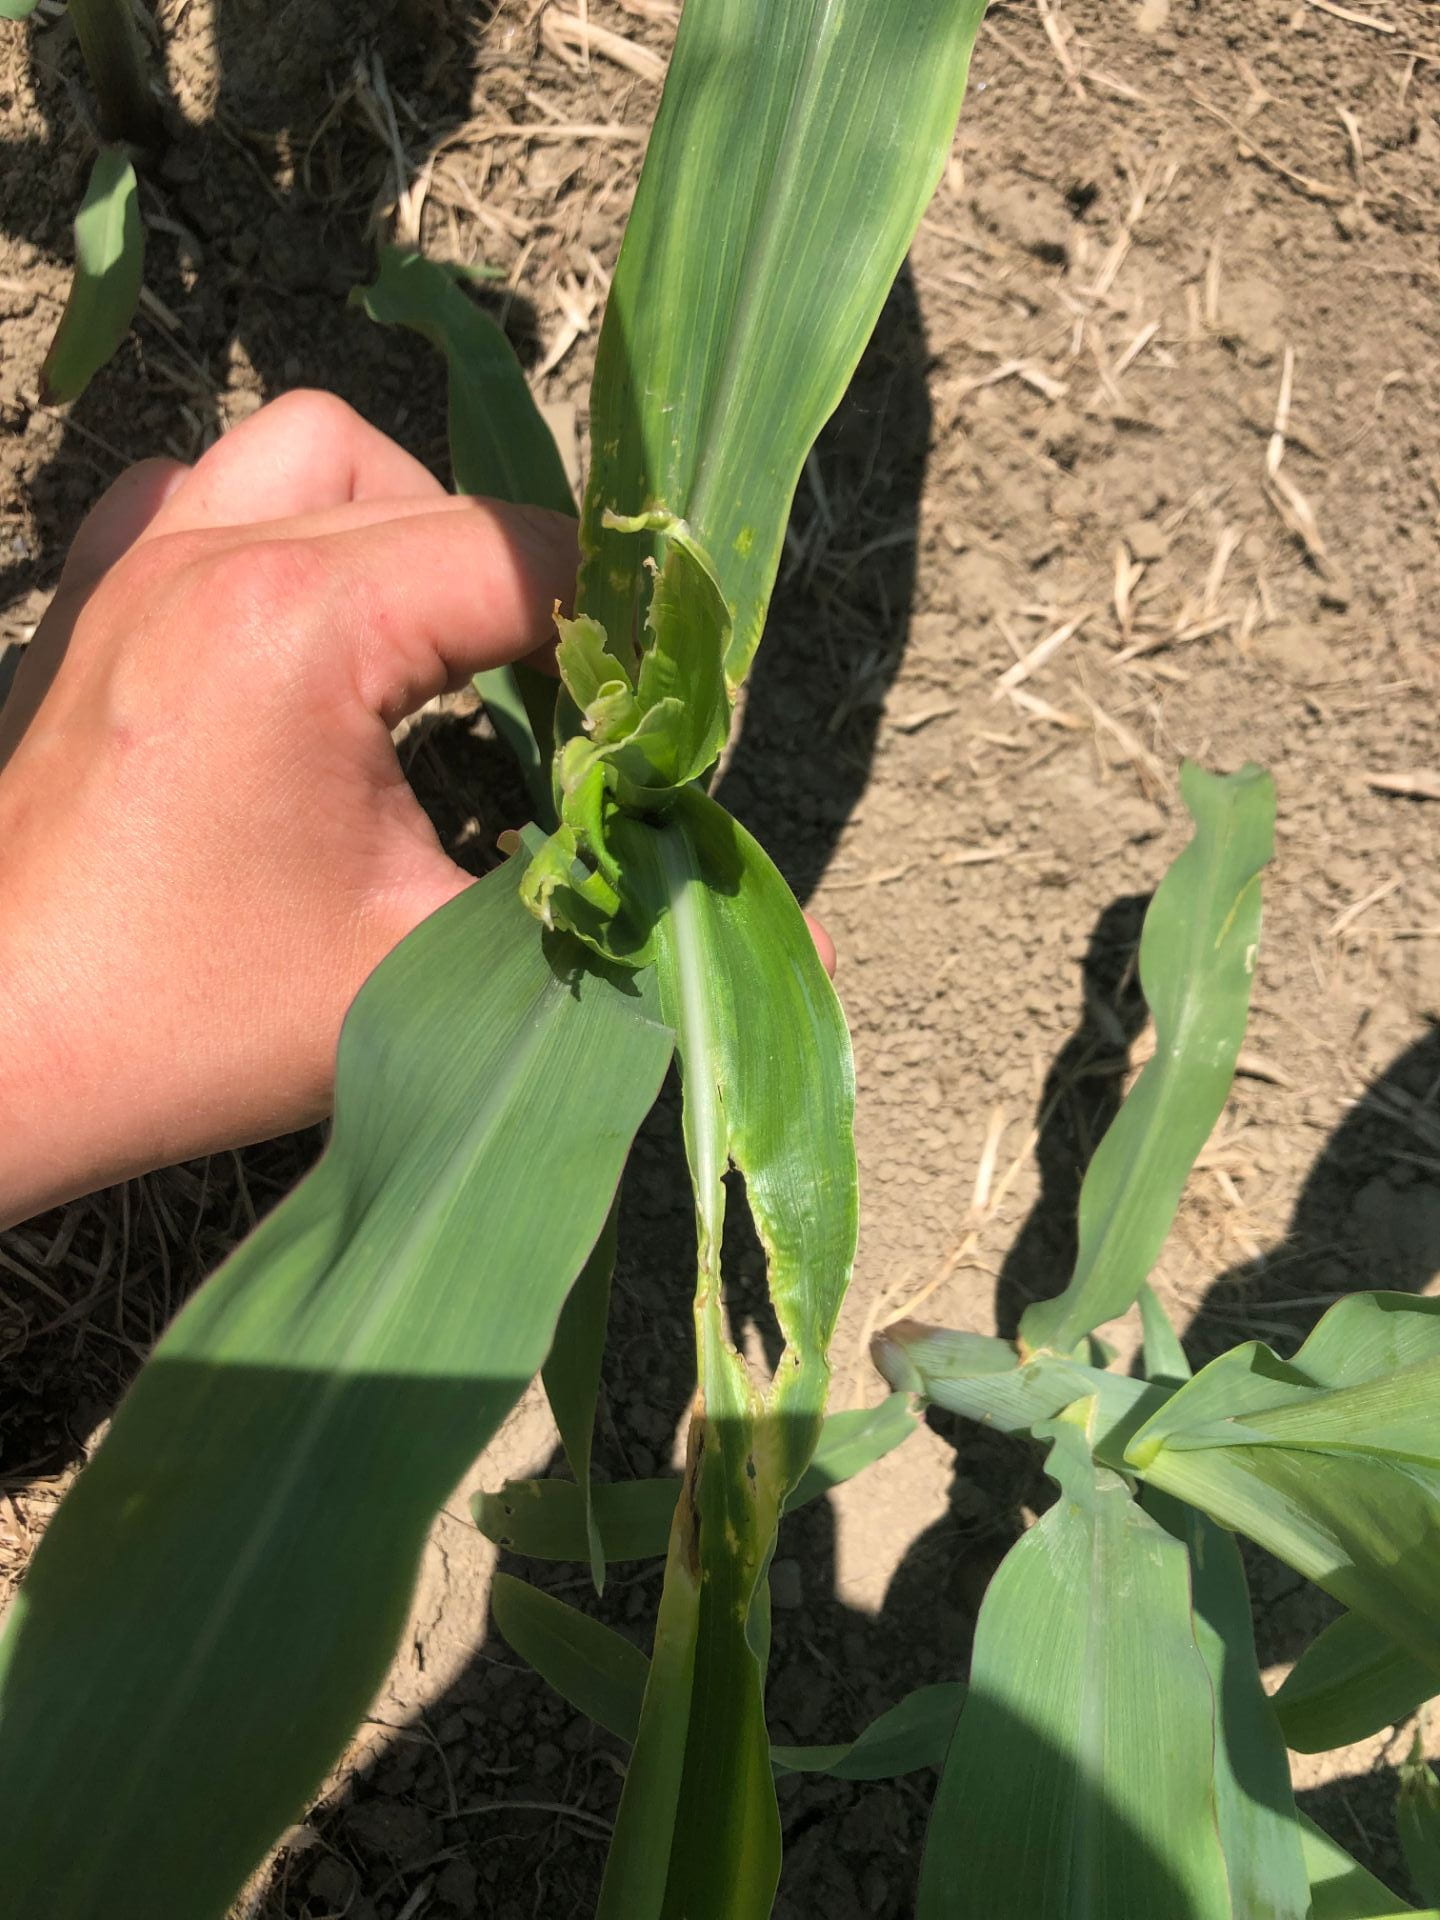
I also found some things that look like signs of pests but are deceiving! These cuts along the edge of the corn leaf look like very uniform bites but is in fact an instance of damage where the corn was growing too fast for the structures to keep up, resulting in damage.

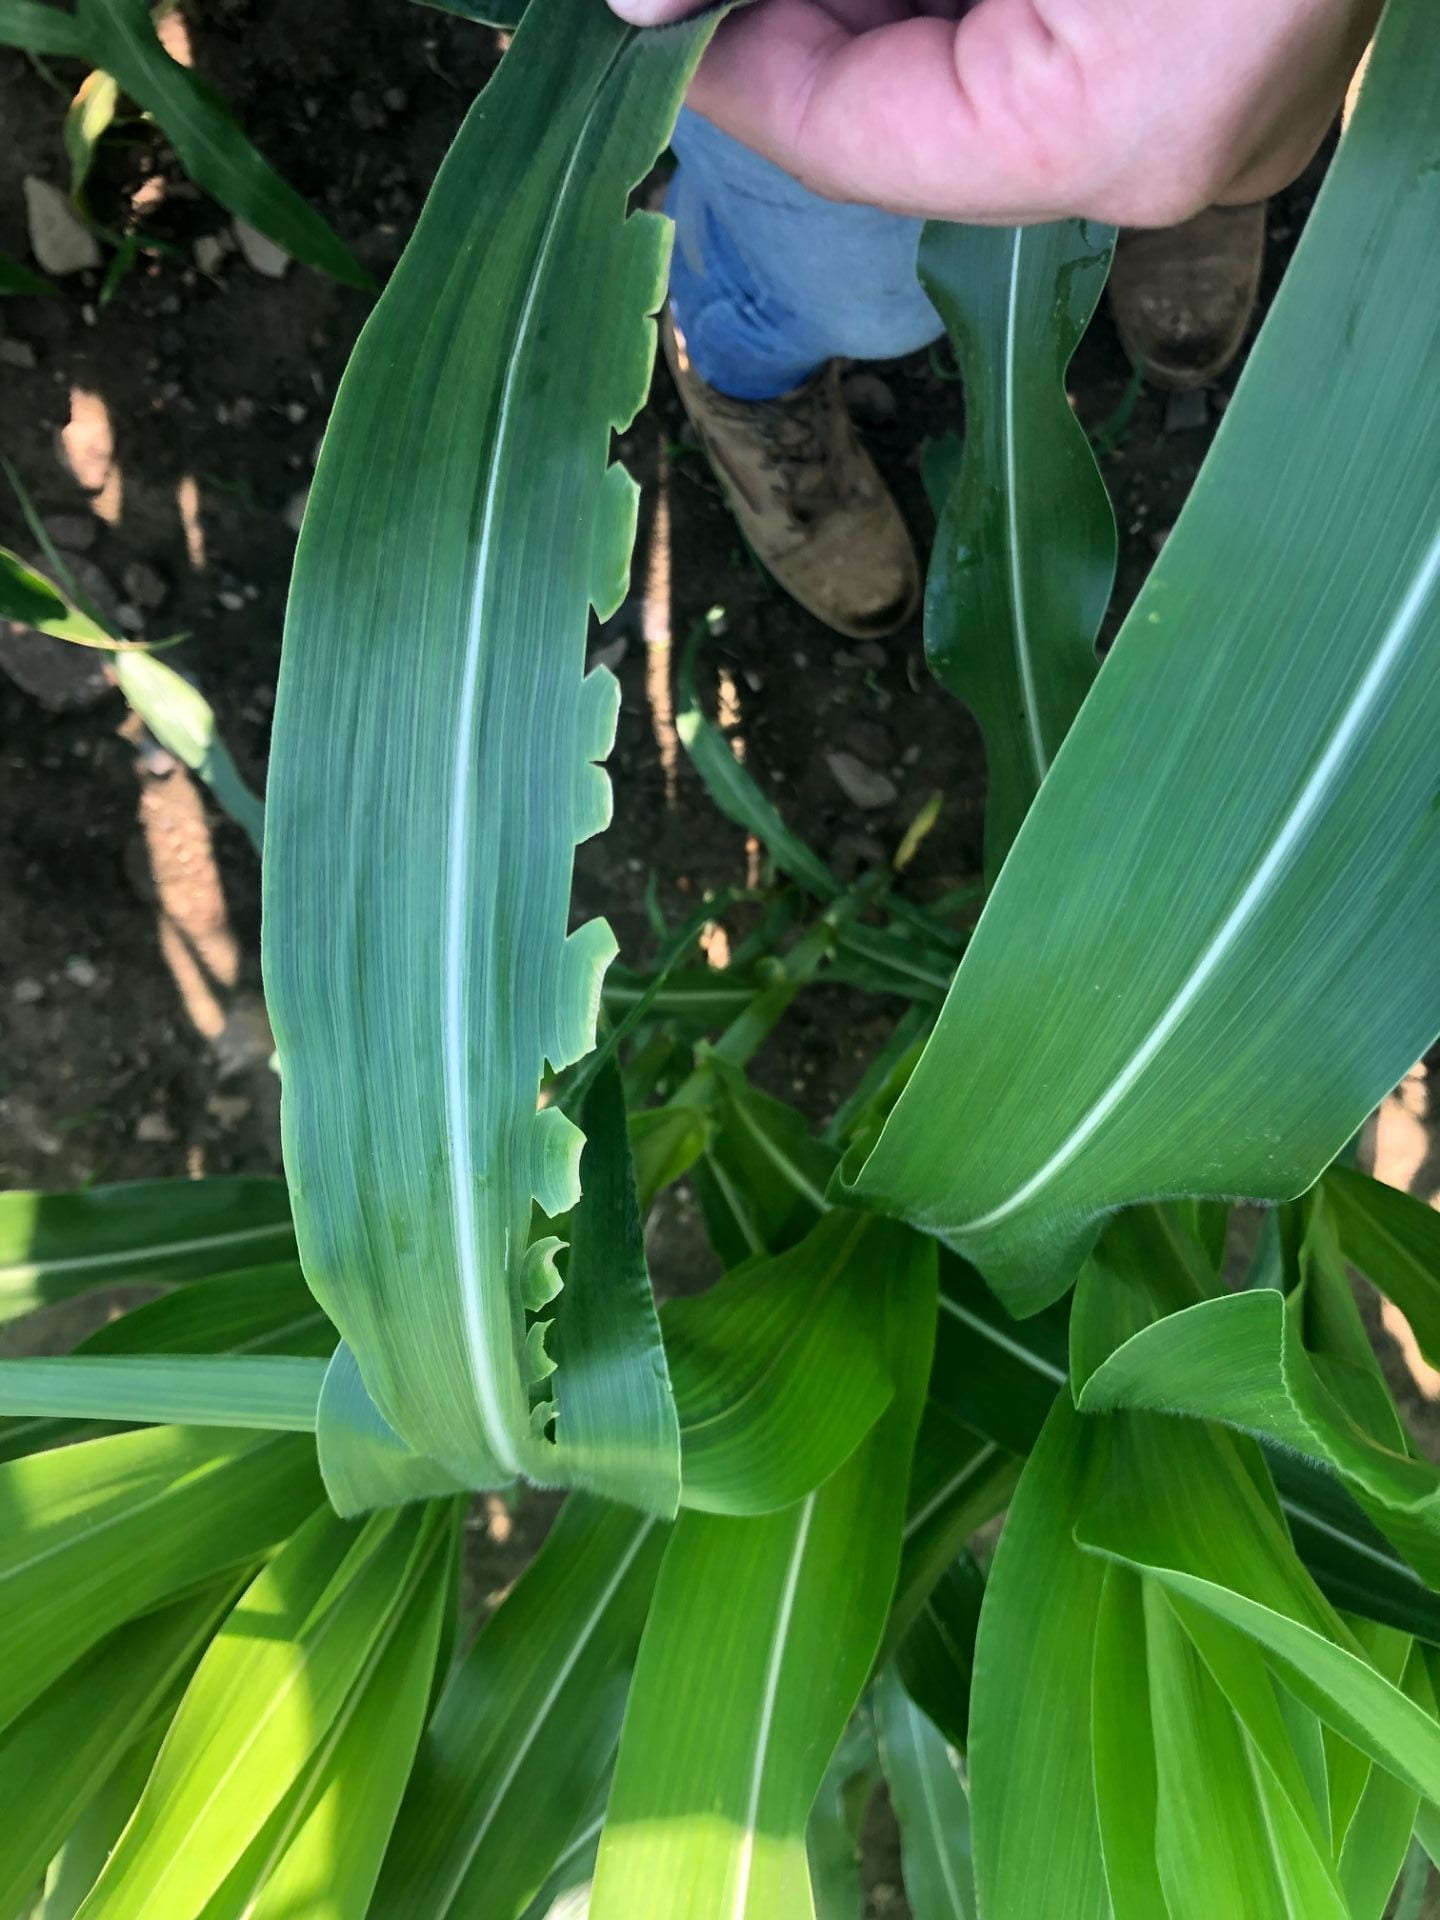
Damage from rapid growth

Also, some random and isolated signs of virus that can actually be very aesthetically pleasing.

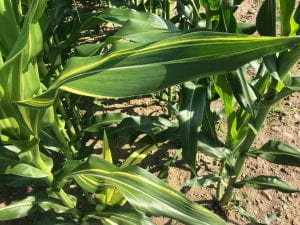
This virus gave the corn a vibrant yellow streaked appearance


And along the way taking soil samples for soil nutrient testing!

Soil sampling with a core

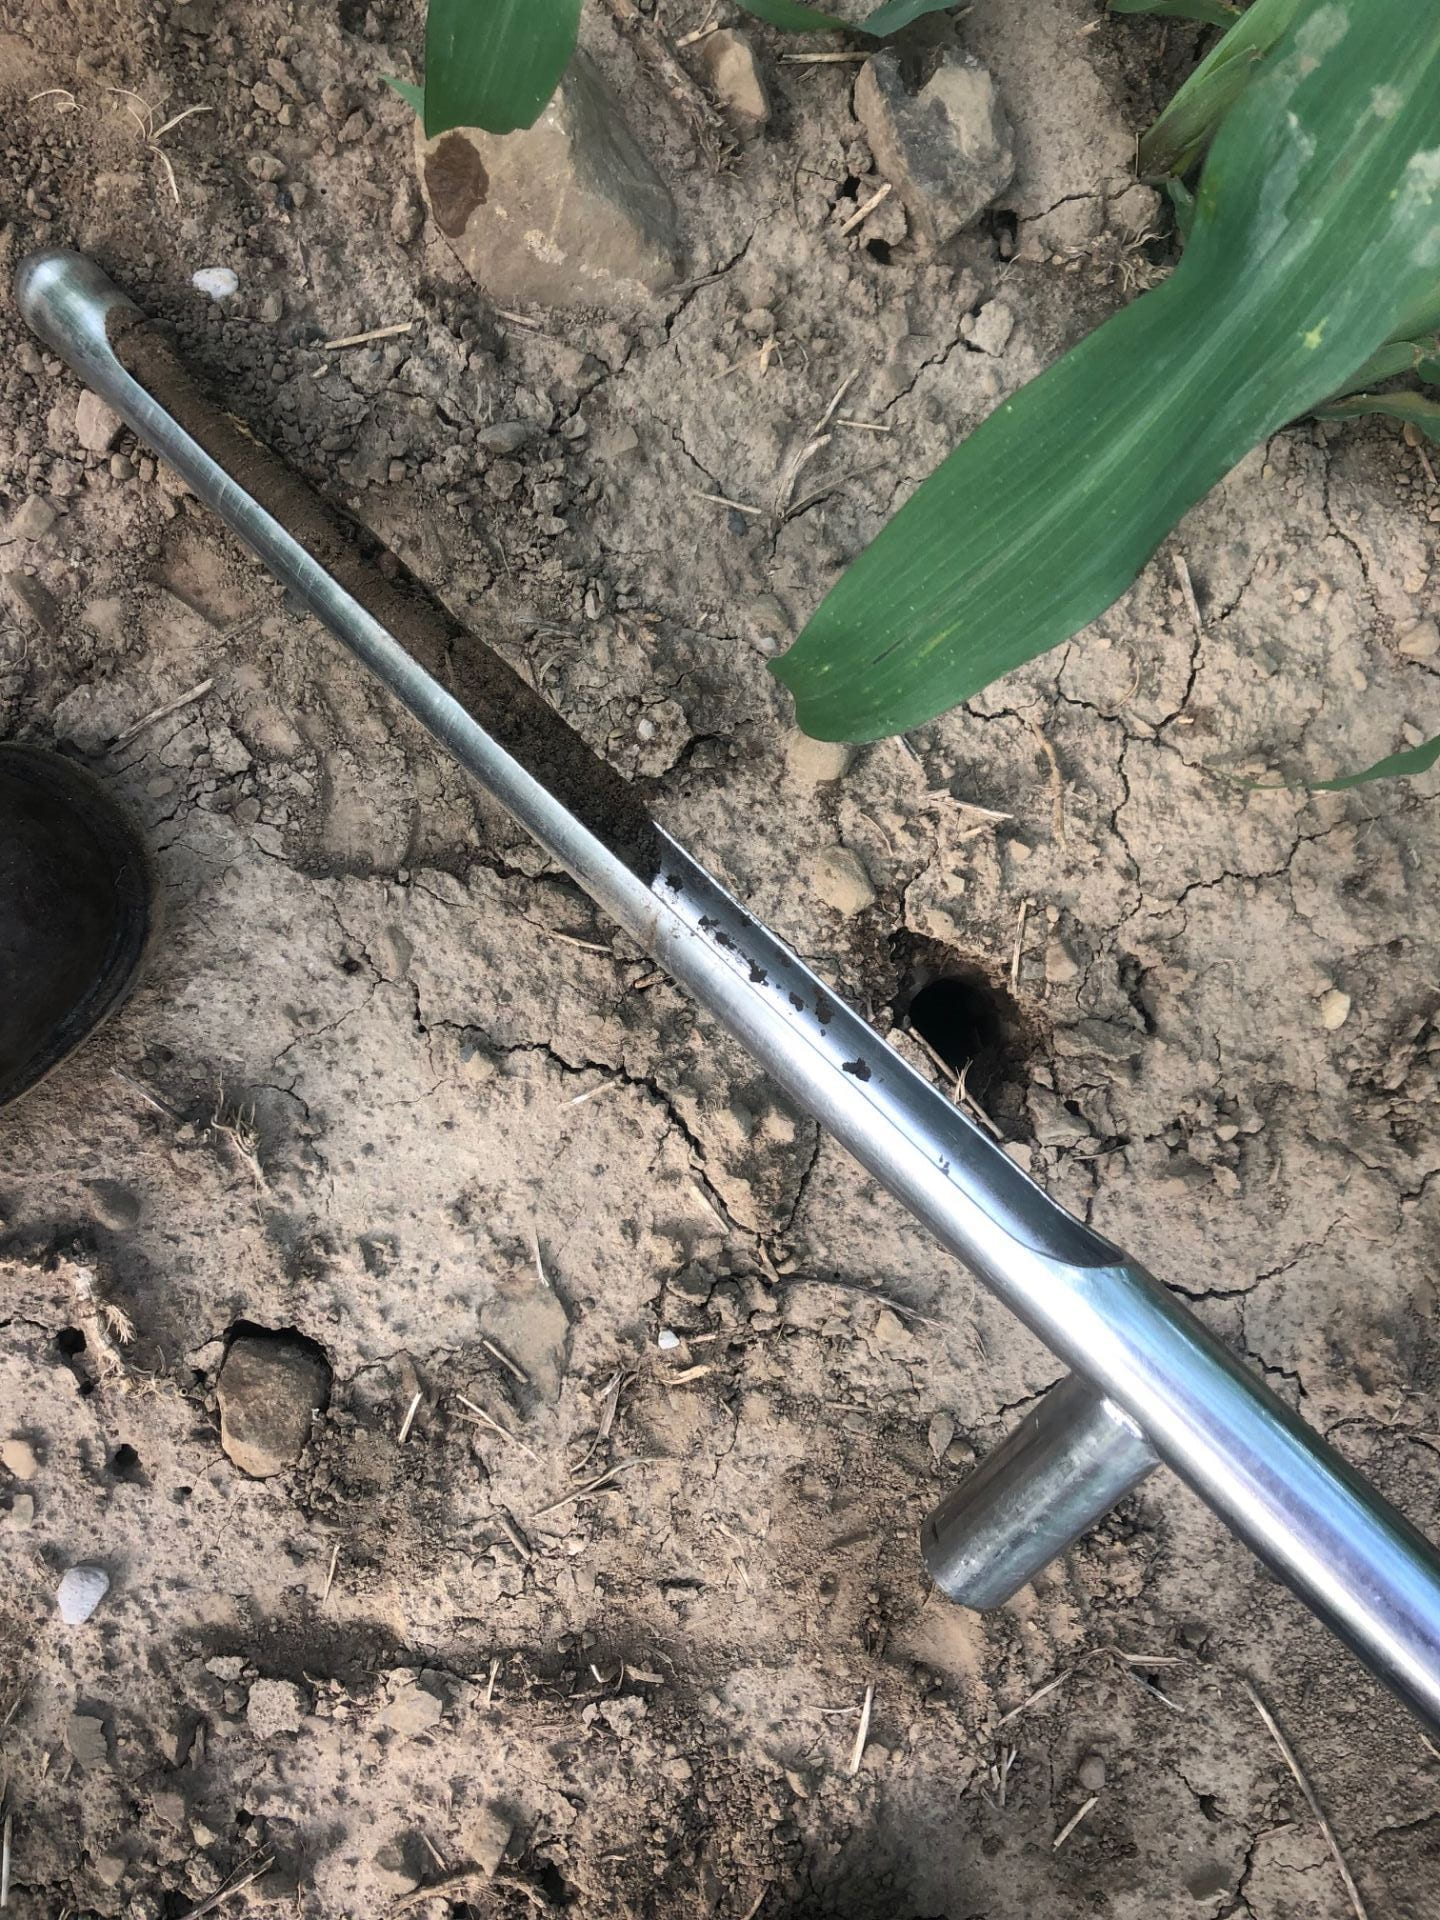
A 10-12 inch core is recommended for Nitrogen testing.


After looking at the field conditions, crop conditions, and the soil sample results, we will be able to manage the fields that need some extra attention. The one field with cutworm can be managed for pest control, and fields that result low in nutrients can receive some extra applications before the corn grows too tall. With these measurements and observations the farm can ensure they are doing all they can to achieve a productive yield.


Just in Time for Alfalfa Cutting

Just in time for Alfalfa Cutting
June 12th

Hi everyone!  I have joined the Osterhoudt team just in time for their second cutting of Alfalfa hay. Alfalfa is very rich and nutritious and high in protein which makes it an important feed for dairy cows, especially the ones actively producing milk.

Here’s a run-down of an alfalfa hay silage harvest: the standing hay is mowed and left to dry-down to an acceptable percentage moisture. A measure of around 40-45% dry matter (or 55-60% moisture) is reached, then the hay is merged, or raked, into windrows to be fed through the chopper.

(Because Osterhoudt Farms is a Custom Harvesting operation, they harvest fields all over the county. Above is a picture I took of the mergers raking on a beautiful hillside field with a view of Cayuga Lake.)

The chopper uses a giant fan to blow the finely cut hay up the chute and into the trucks. I rode with Walt, the chopper operator, and he even let me try my hand at it!

The trucks haul the haylage to the dairy farm bunk, where it is mounded and packed. The pack is important firstly to keep the product contained, and secondly to compress the hay together to rid the bunk of excess oxygen so it can ferment properly. For silage to ferment without producing a rancid or noxious acid, the microorganisms that perform the fermentation process require an anaerobic environment.

Before sending the choppers out, determining if the hay was at the appropriate moisture content was critical. Because silage is meant to be fermented, a much higher moisture content is acceptable than would be in bales of dry hay. This is an advantage for some farmers because the haylage process allows more days of possible harvest as many consecutive sunny days aren’t needed to dry out the hay. However, it is still important that even in haylage the moisture content is around or just below 60%, so the hay is sampled and tested before harvesting. The farm still checks the moisture through the old tried and true “cooking” method: drying a sample in the oven and measuring water component by difference in weight, but we also had a new moisture sensor that is being tested for use in New York by the Dairy One research lab. Dairy One loaned one of their portable devices to gauge its accuracy and gain information for their database.

And we will get to repeat this whole process a few more times this year! Alfalfa is cut 3 or 4 times per season depending on the weather. ‘Till next time!


And How…

And How…
January 18th, 2019

In the middle of frigid January, I would say I am coming around to this idea of working inside at the desk and not out in the barn or the field! This week I have been learning and doing more cleaning of yield data.

Using a USB drive, the data can be taken straight from the combine or chopper cab monitor and read into the SMS Software. On SMS the yield data is sorted using geospatial data from GPS locating into the farmer’s set field boundaries, also made using GPS systems. Information about the crop, growers, fertilizers, field history, and almost any other field attributes can be added too.  Once the data is in manageable field-sized packages from fiddling around with it on SMS, the data can be sent into Yield Editor to be ‘cleaned’.  Yield Editor is where, by tinkering with and adjusting the settings of the machinery sensors, you can manually compensate for the error variables I mentioned last week (variable speeds, stops, wet/dry, flow delay, operators who get funky with it, etc.).

On Yield Editor, data fed in from SMS are laid out chromatically and sometimes vaguely discernible patterns of high vs. low values show up within the rainbows of color. Then, constants for the variables can be set so the patterns line up into more easily distinguishable features that can actually be attributed to something such as slope of the field, a wet/dry spot, a tile line, a common traffic path, etc.. The picture to the left shows some of the variables for which constants and limits can be added to manipulate the data. Below, an example from the NMSP Protocol “Processing/Cleaning Corn Silage and Grain Yield Monitor Data for Standardized Yield Maps across Farms, Fields, and Years”* shows the change in the data points when a flow delay is accounted for. A pattern of a low yielding zone becomes more linear, and perhaps lines up with a wet spot, different soil type, or tile line on the field.

This cleaned data from Yield Editor can then be read back into SMS, which can be used as an extremely beneficial tool for crop planning and management by the farmer. With cleaned data to work with, management practices can be even more targeted and precise.

This type of diagnostic can prove useful to a farm. If a low yielding zone, upon further investigation, is found to have a drainage or erosion issue, measures can be taken to fix the problem. Furthermore, if there is an issue like a soil type that perhaps needs to be fertilized/treated differently, it is easier for the farmer to make zone prescribed planting or fertilizer prescriptions to optimize production in each zone. Along the same lines, if the farmer sees that sections of his field year after year are extremely high yielding, they may change their population density to better utilize the area or reduce their fertilizer expenditure on that zone save money and be economical. By cleaning the data, it allows for accurate measurements and clearer boundaries that can lead to clearer management zones for the farmers to work with. I hope to explore this kind of management on the farm at Osterhoudt Farms this summer. The NMSP Lab has given me so much information to work with and explore on the farm!

*Official Reference:
Kharel, T., S.N. Swink, C. Youngerman, A. Maresma, K.J. Czymmek, Q.M. Ketterings, P. Kyveryga, J. Lory, T.A. Musket, and V. Hubbard (2018). Processing/Cleaning Corn Silage and Grain Yield Monitor Data for Standardized Yield Maps across Farms, Fields, and Years. Cornell University, Nutrient Management Spear Program, Department of Animal Science, Ithaca NY.


Getting Started With Some Data Crunching

Getting Started With Some Data Crunching
January 10th, 2019

Hi everyone! The first increment of my agricultural internship is off to a running start in the NMSP where I am learning more than I had ever imagined I would about data processing. Right off the bat, I would be the first person to shy away from A: simply sitting at a desk all day and B: the idea of crunching numbers through a computer. However, in this case, what the numbers have the potential to tell you is so incredibly interesting (but maybe that’s my personal bias towards any and all things agriculturally related talking)!

So, to break it down, many farms are equipped with harvesting machinery that has a wide variety of sensors to help keep track of and measure yield. GPS guidance and positioning, speedometers, crop moisture sensors, width of the section being harvested, flow or the thickness/amount of the crop being pushed through the feed rolls, and many other bells and whistles that give off readings.

Many variables go into just simply measuring yield. Take this idea for instance: a bushel of corn has been standardized to a weight of 56lbs, however as a unit of measurement a bushel is actually a volume of something in its dry capacity (8 gallons of that ‘something’ in imperial units). But corn can be dried to different moisture contents, and some corn kernels can be on average denser than others even at the same moisture capacity! Now, add in a giant machine rolling through a field of corn, speeding up and slowing down, flow delay (A.K.A. the time it takes for the crop to be cut and pass through the chopper/combine head to get the sensor and be measured, but now the chopper is 20 feet further down the pass!) missing the perfect swath, a wet vs dry spot, or any other number of crazy things the machine operators do, and you have a huge number of variables that can affect how much crop is actually coming off the ground as opposed to what yield the sensor is reading off the field in a given spot. Now you have a mess of numbers that are all jumbled around when all the poor farmer wants to know is a round-a-bout idea of how his land is producing, and maybe which spots on the fields are the good spots or the bad spots.

Using two kinds of software, the NMSP has been working on fine-tuning a way of “cleaning” all this data that is recorded by the machine sensors and turning the numbers into a usable data set that farmers can work with.

USDA ARS – Yield Editor

SMS by AgLeader


…And the ins-and-outs of those whole concepts was about as much as I could learn in one week! You’ve got the “why,” coming soon—the “how” data is moved around and cleaned.

Some Interesting Connections!

Some Interesting Connections!
December 27th, 2018

Hi everybody my name is Hannah! I am a sophomore, soon-to-be Junior (by the time I finish this blog), in the Agricultural Sciences Program at Cornell. My agricultural internship experience is a little unique as it has been split up between the winter of 2018-19 and the summer of 2019. Over the winter intercession, I will spend around three weeks in Dr. Quirine Ketterings’s lab in the Nutrient Management Spear Program (NMSP) learning about digital agriculture—specifically crop yield data information and data cleaning. This summer, I will be working at Osterhoudt Farms in my lovely hometown of Genoa, New York.

I am very excited to be spending the summer in my happy hometown!

Osterhoudt Farms is a custom planting/harvest operation of alfalfa and corn. These products are mainly sold to dairy farms in the area. Osterhoudt Farms has around 2,000 acres of privately-owned ground in production, and custom plants and harvests an additional approximate 4,000 acres of corn and 2,000 acres of alfalfa/grass hay for a grand total of worked ground falling around 10,000 acres spread throughout the entire county!

Working closely with Osterhoudt Farm’s on-staff crop consultant, Andy Miller, I hope to learn some of Andy’s roles and responsibilities in advising and helping manage a large farming operation, and will also be connecting the winter portion of my internship by observing some practical on-farm uses for digital agriculture and yield data information. We also hope to be doing some rather large-scale field trials to test some crop and nutrient variables, but more to come on that topic this summer! Hopefully, the unique in-lab to on-farm leap can provide some useful information to the farm as well as some feedback for the NMSP. 

Osterhoudt Custom Harvesting’s employee and fan favorite picture (from the 2014 Silage harvest)

Skip to toolbar