
John Harvey

Yield Data Cleaning and Taking Flight


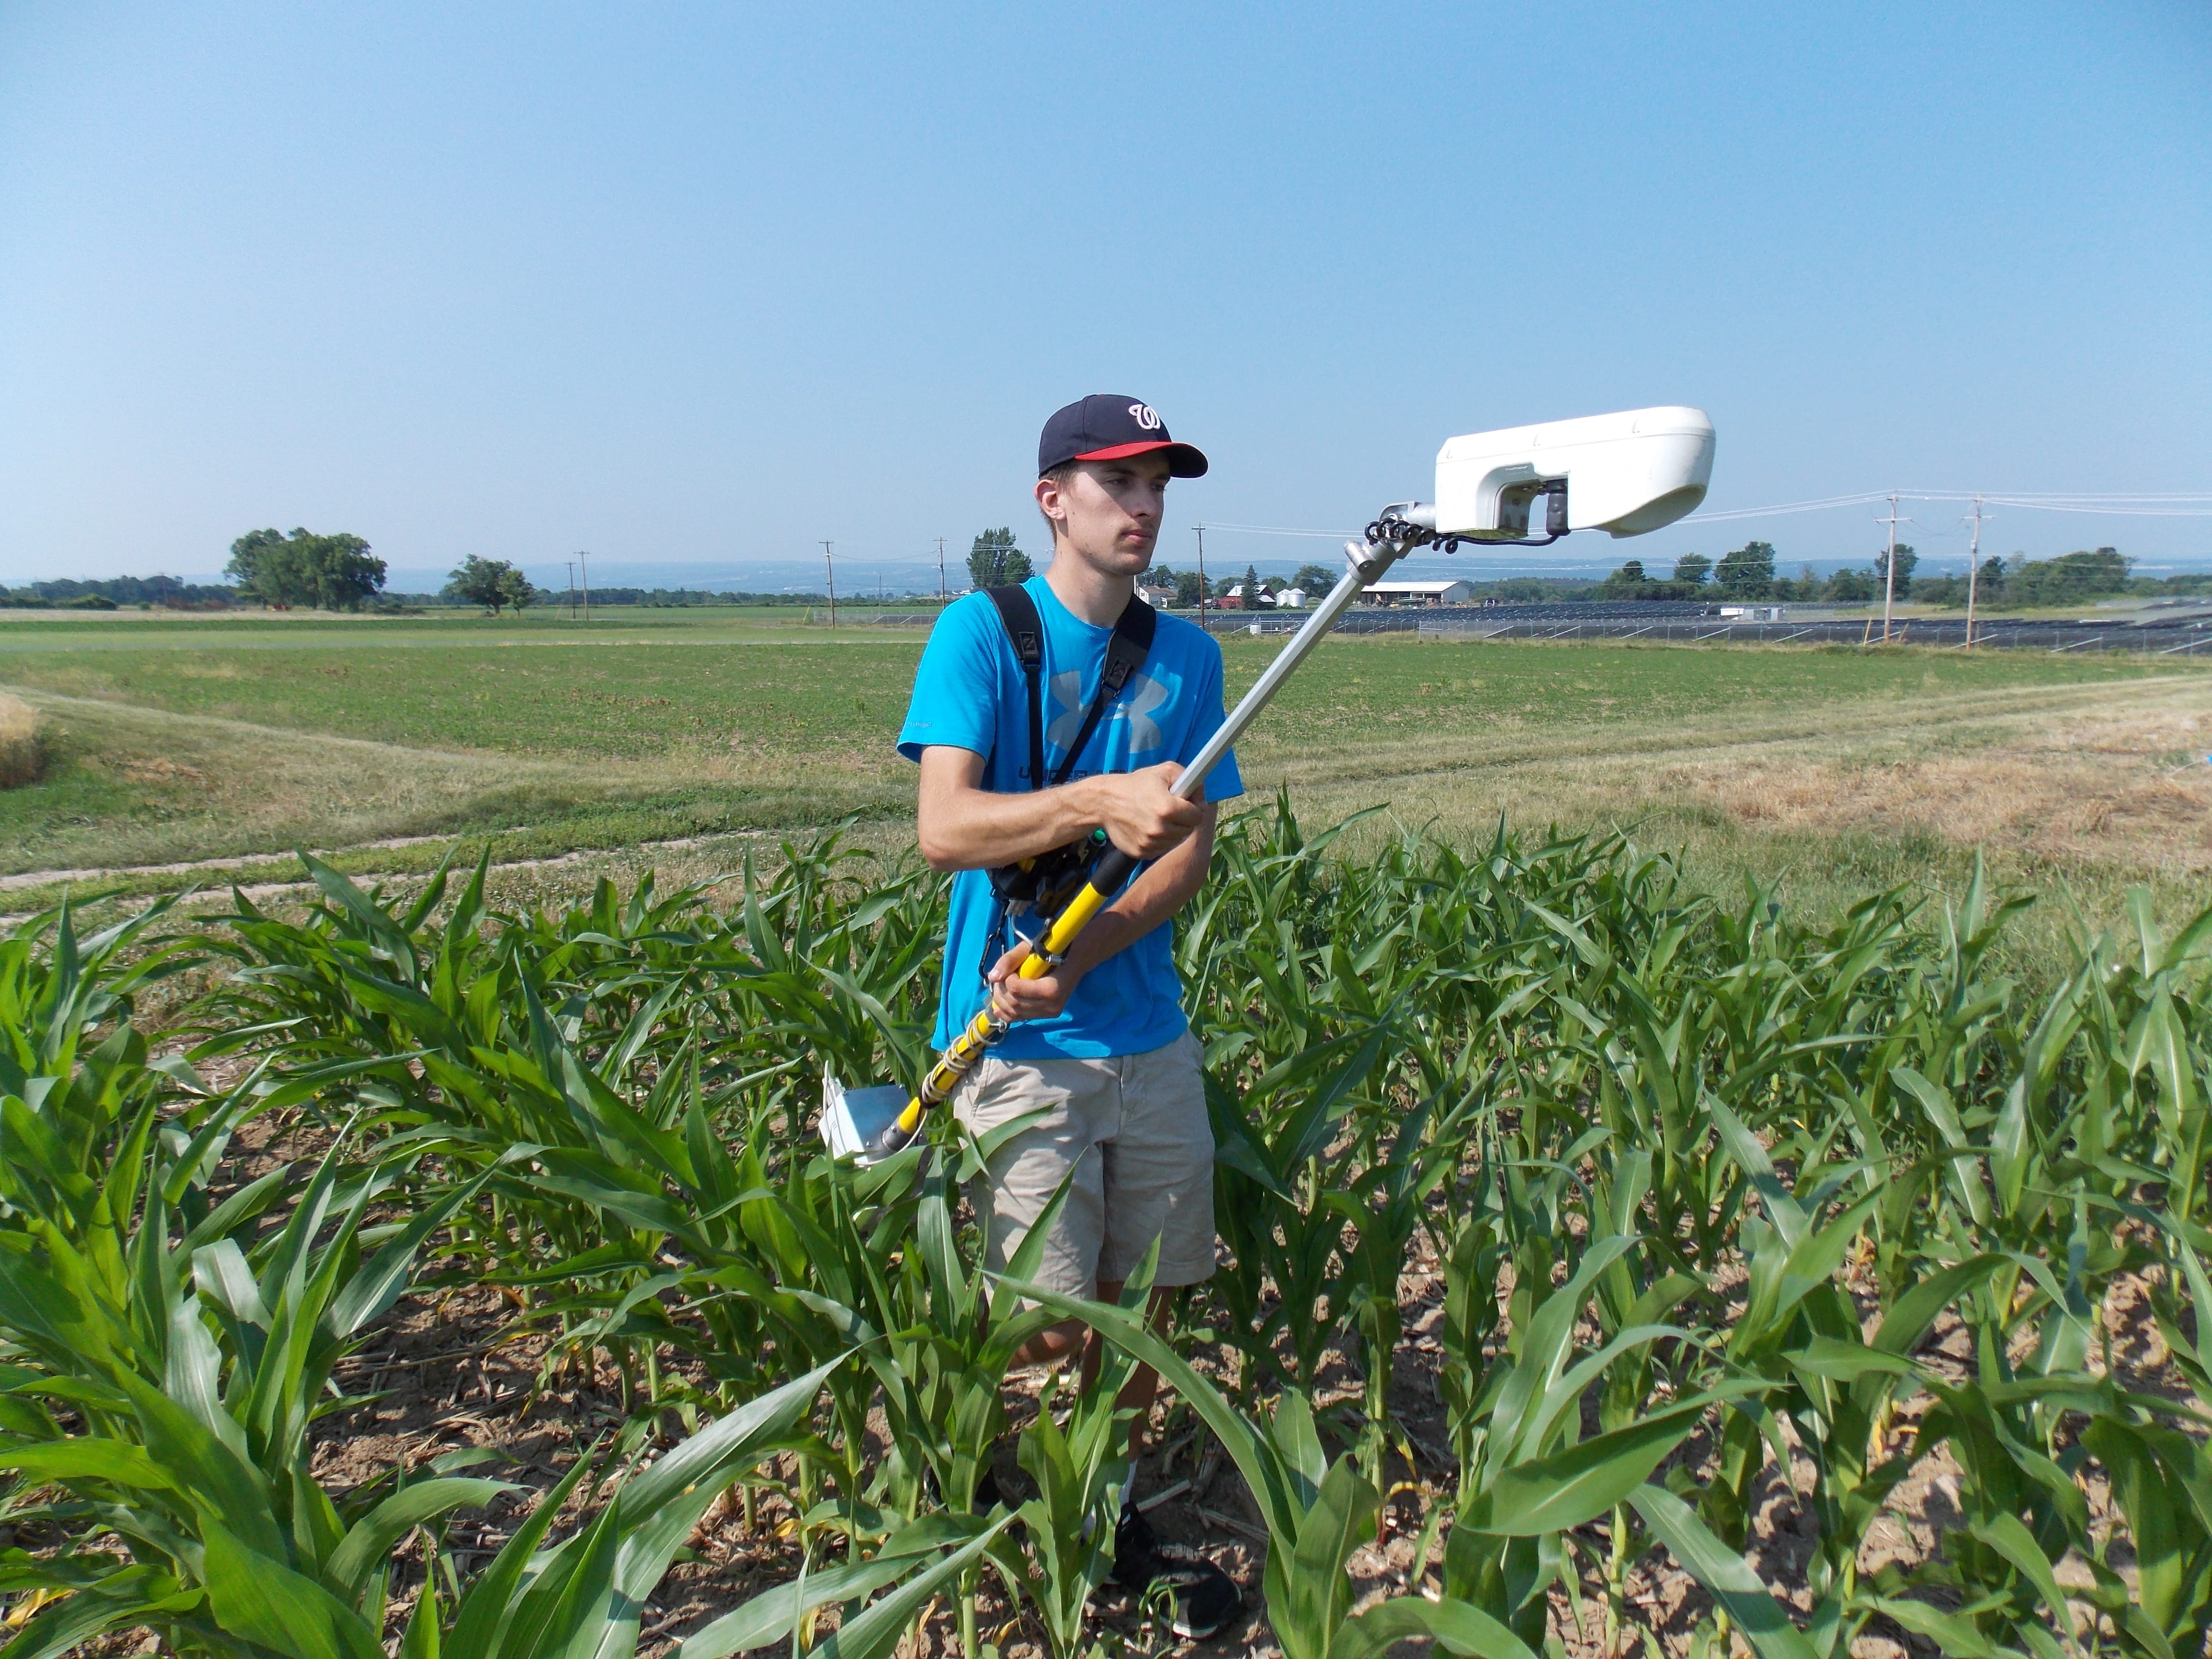
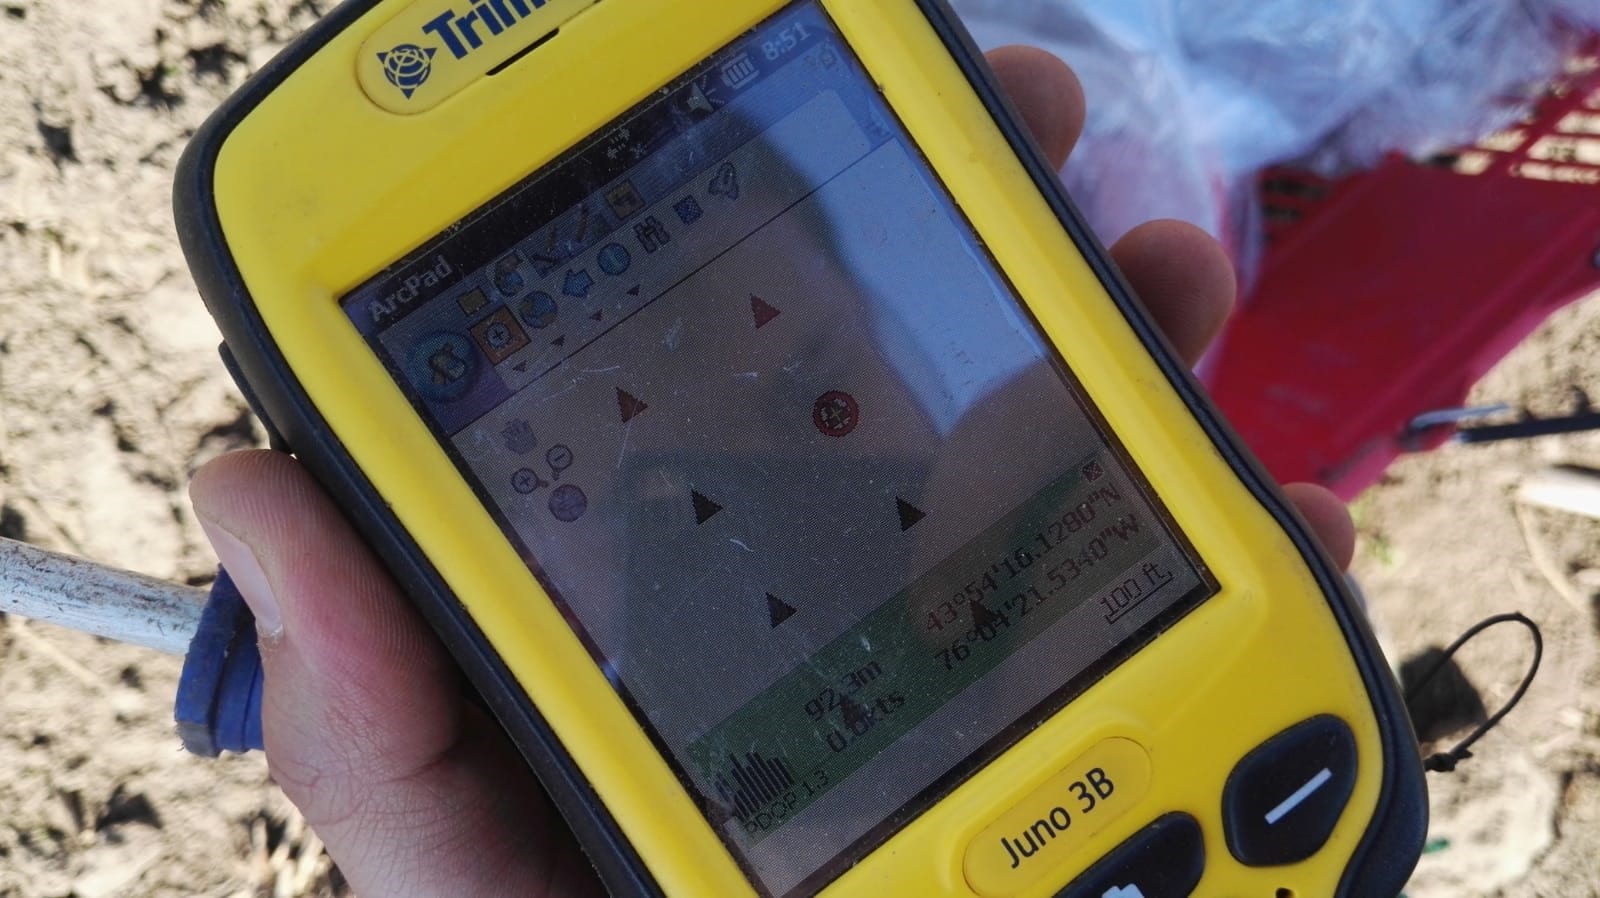
A picture of what working in SMS looks like.

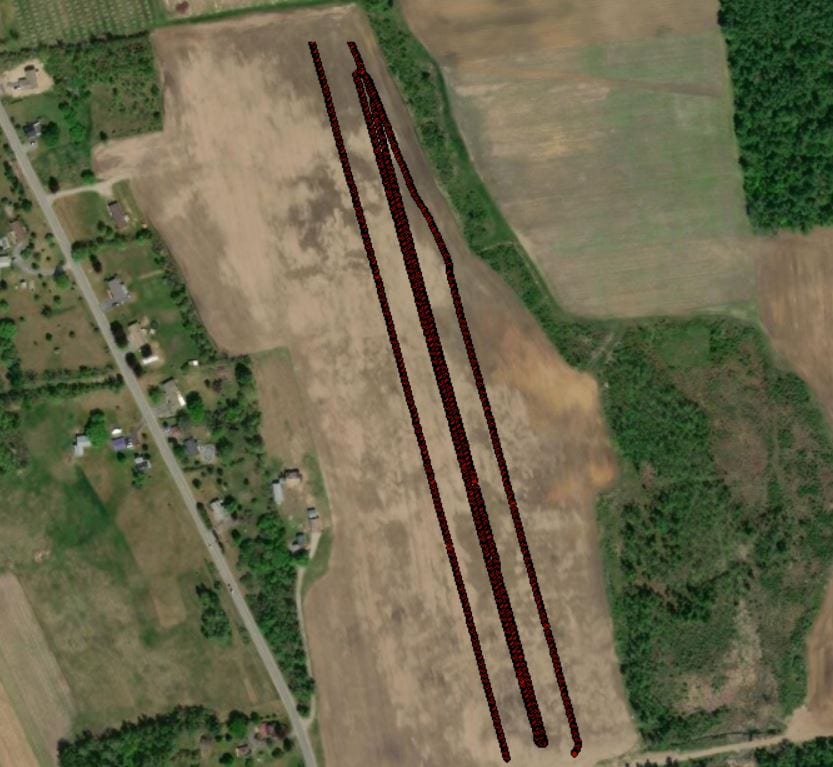
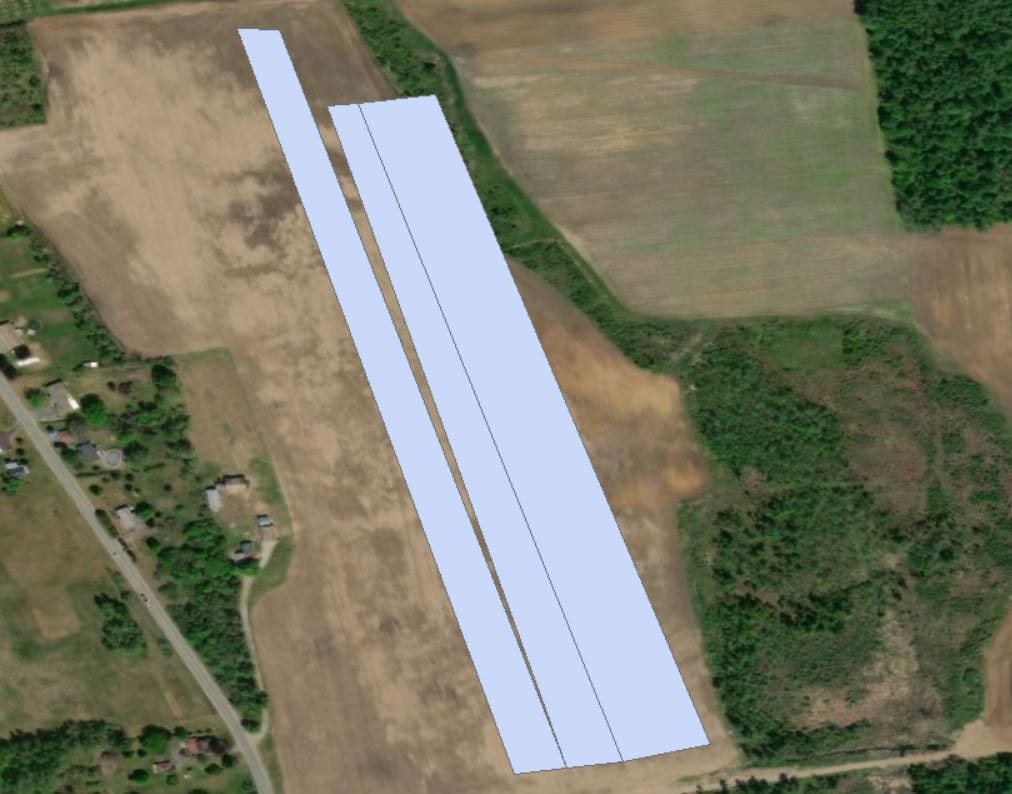
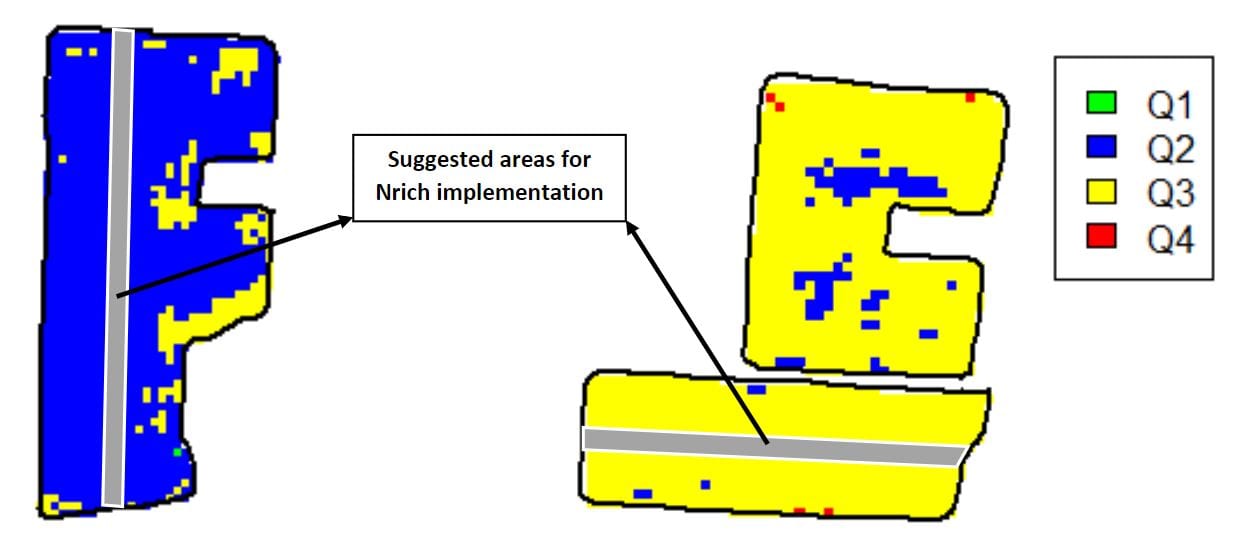
In working along with my supervisor, I have been able to get a feel for yield data cleaning. It is a very important part in the Nrich strip project. A yield monitor is used on the harvester to record the information. But the yield is not totally until it is cleaned. The raw data arrives from the farm and is then loaded into SMS.  SMS is the software that is used to configure the field boundaries.  The files are then transferred to a software called Yield Editor. The moisture and flow delays are checked and any outlying values are deleted. Once a field has its yearly yield data cleaned it is ready to be used in Arcmap. By using classify and raster calculator tools, the quadrant is made to evaluate the best area for Nrich implementation.

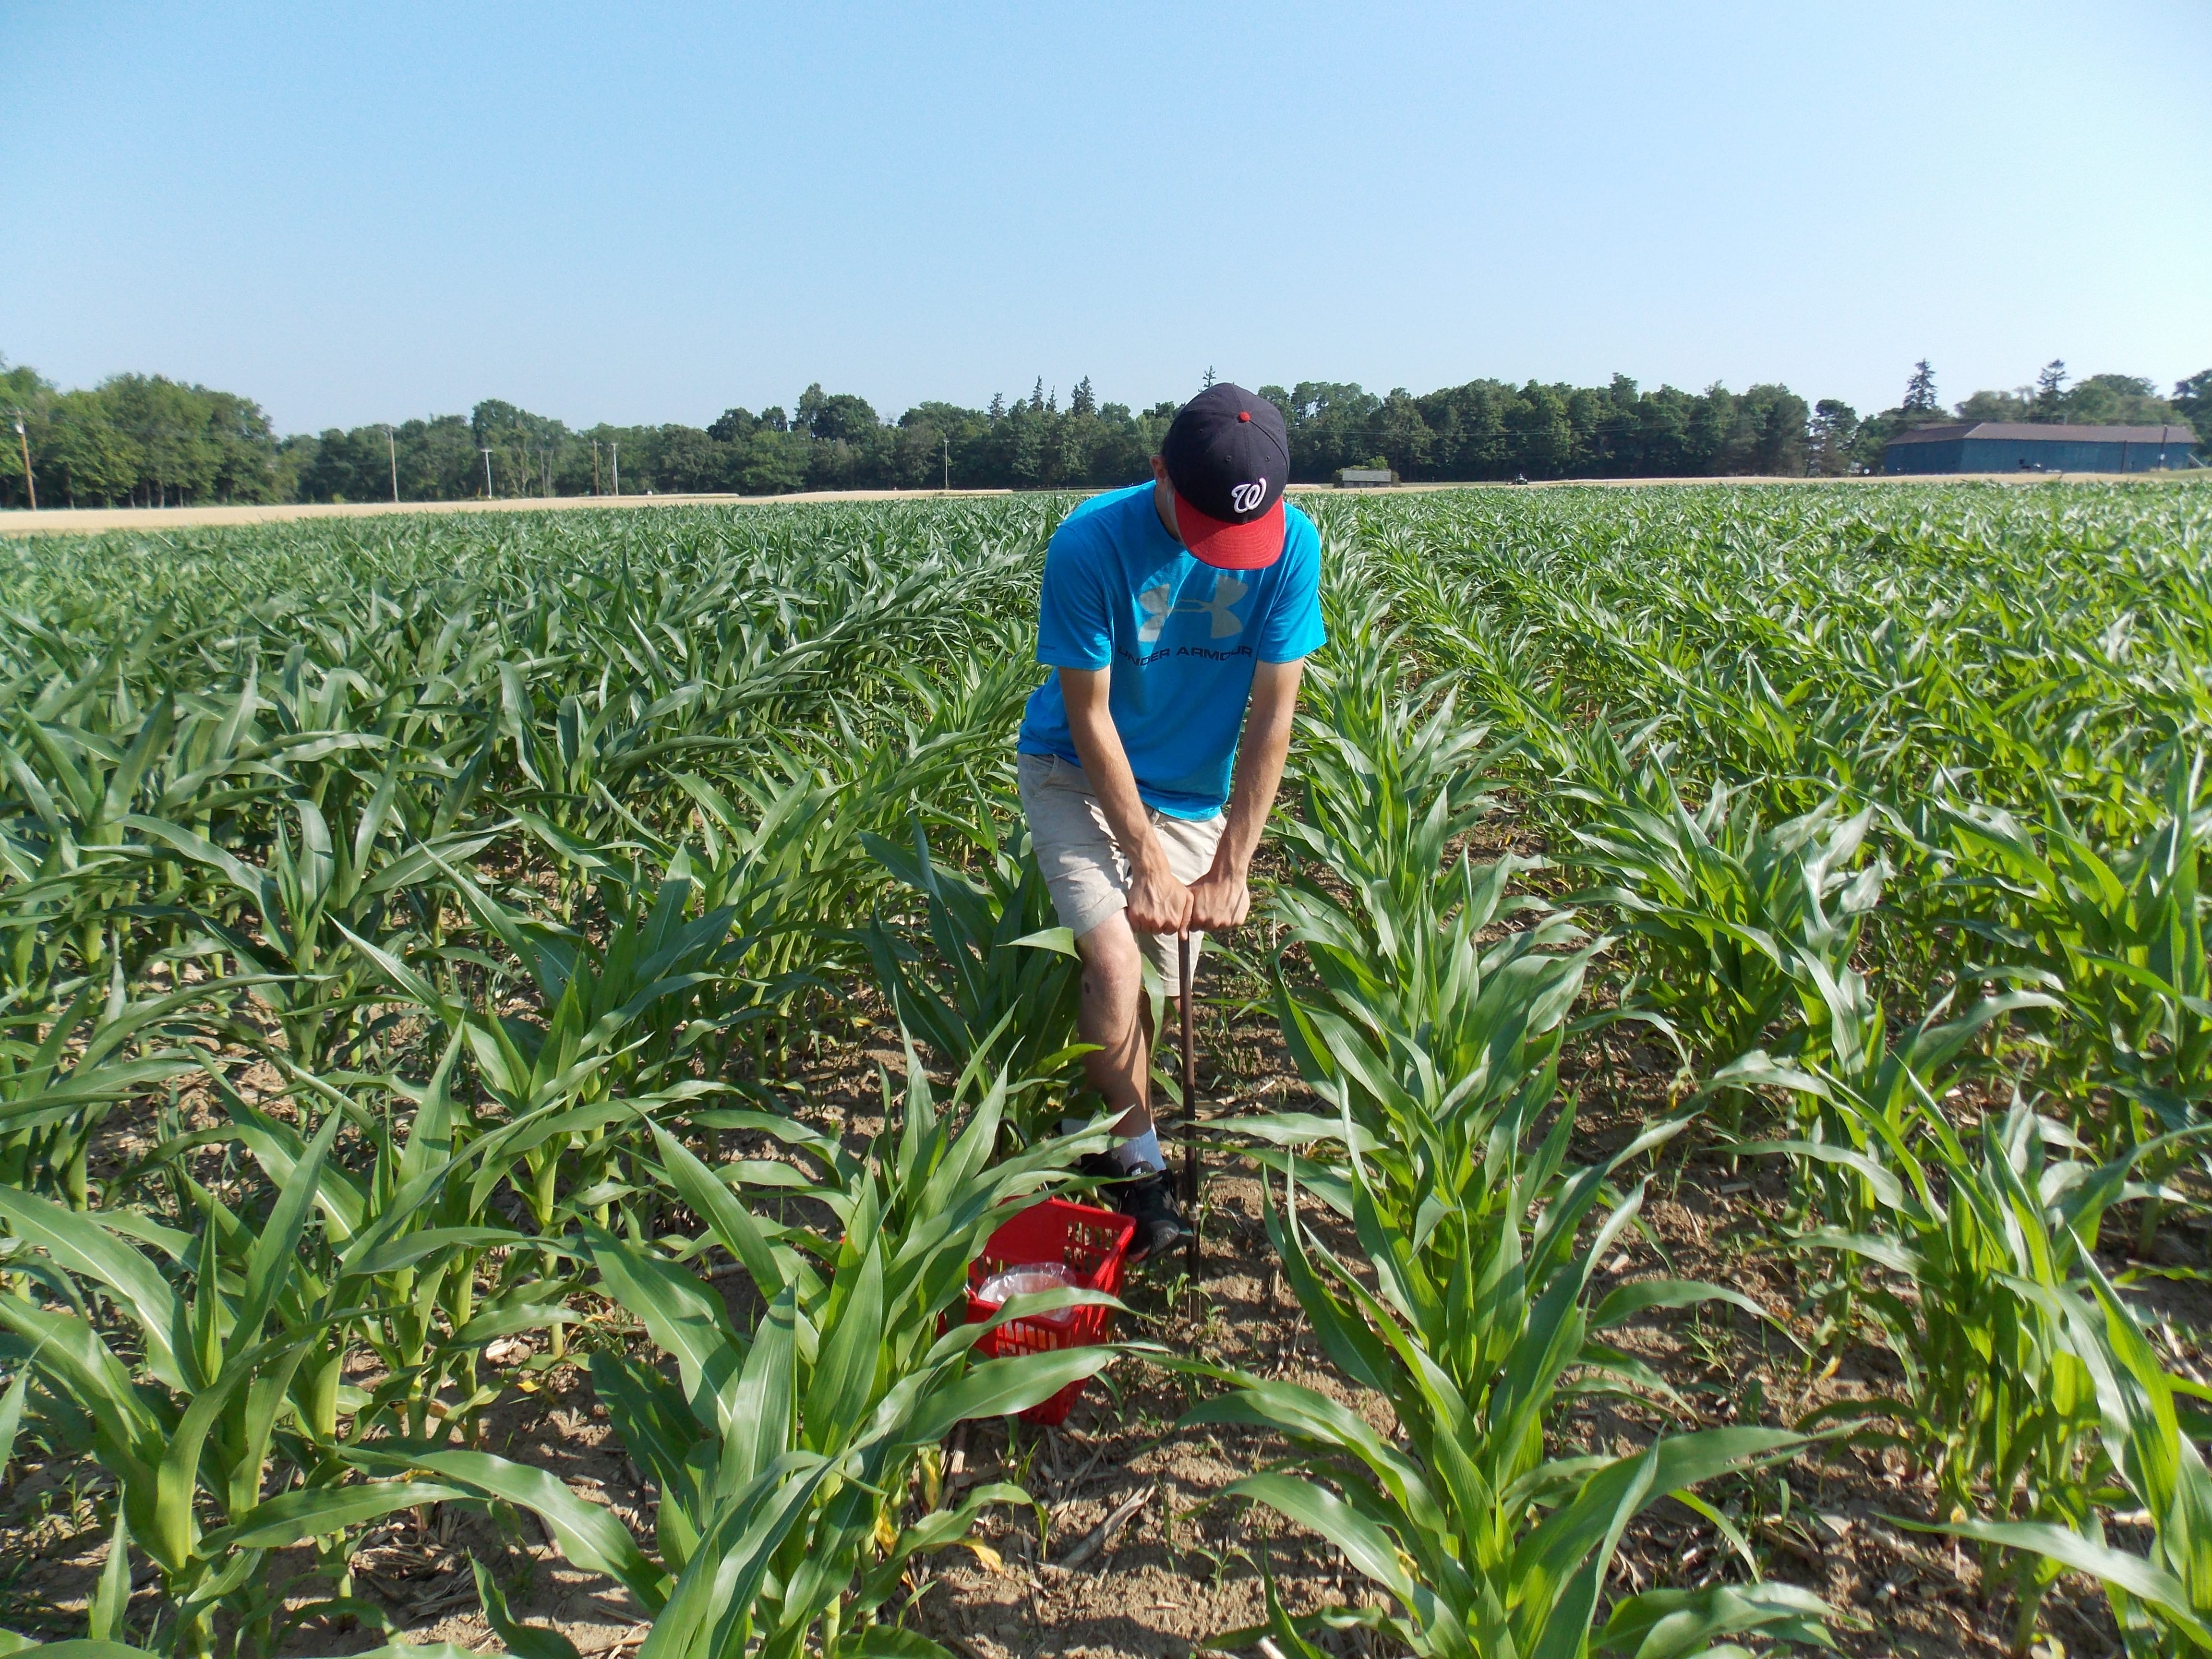
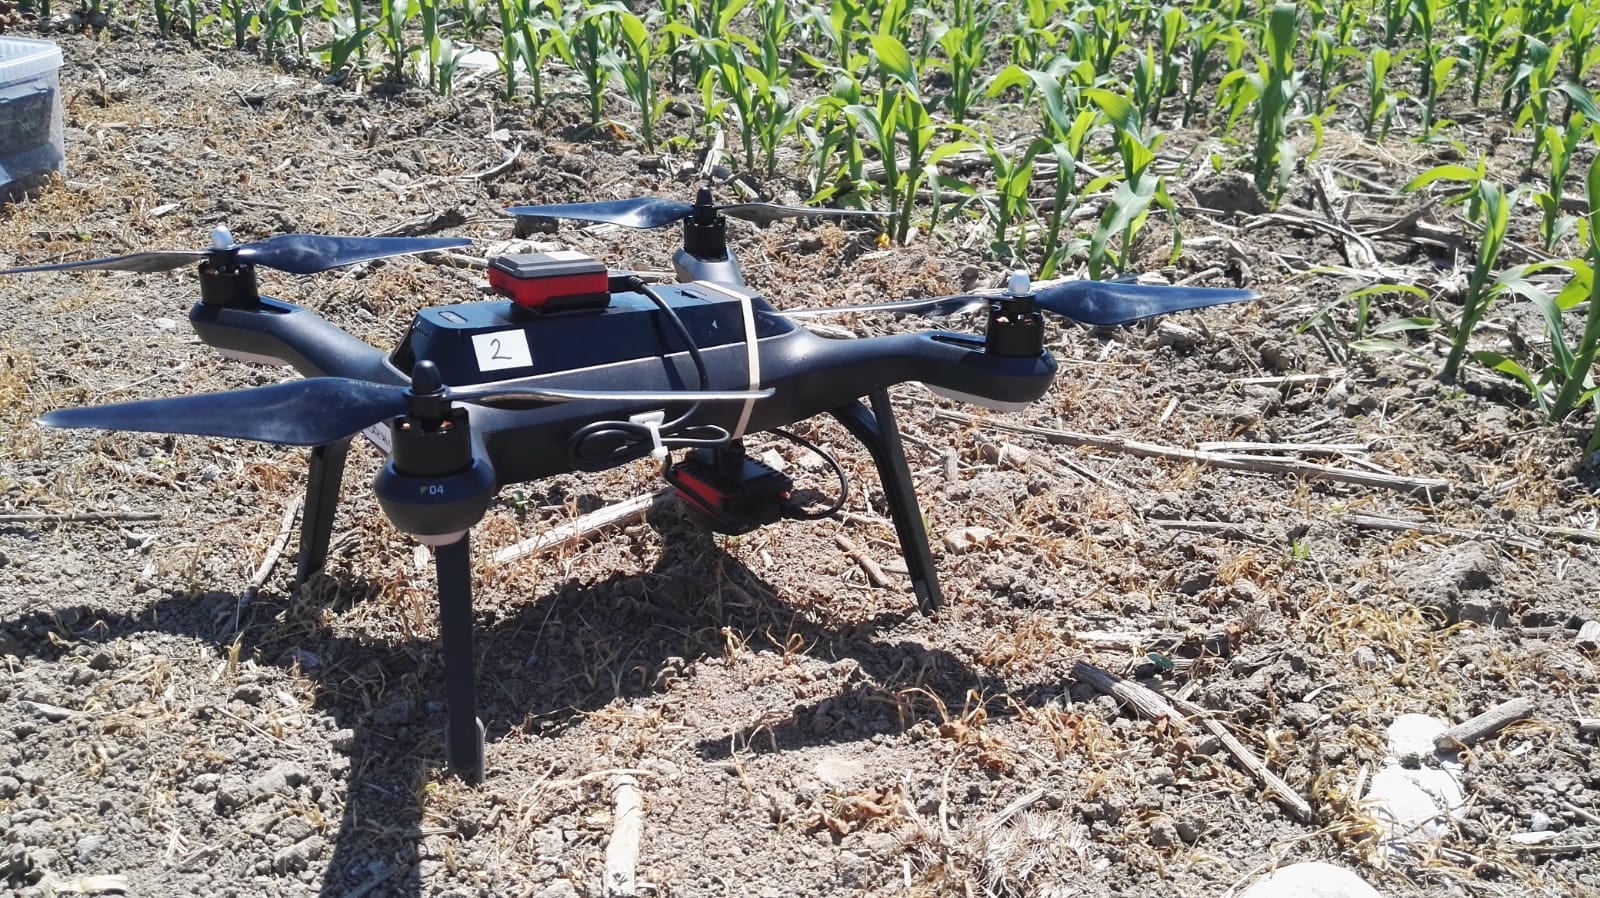
Showing the new drone before the first flight.

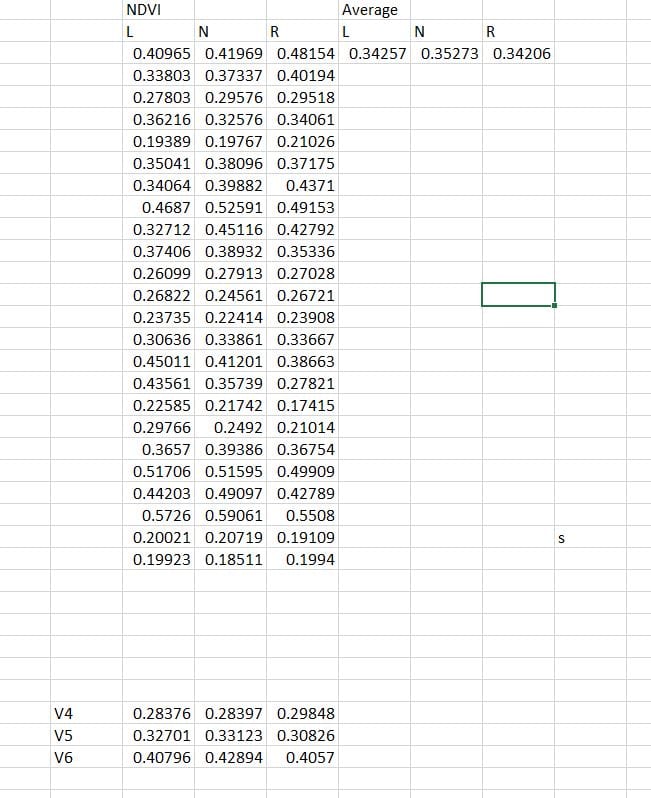
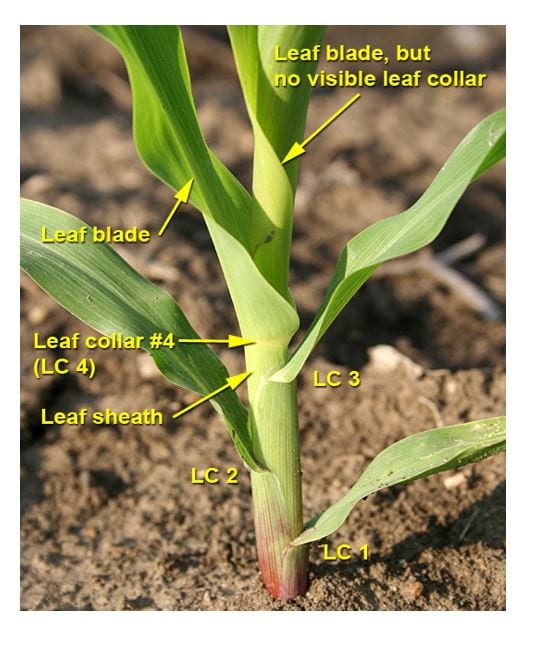
Well, a new drone finally arrived! It’s really exciting to see the new drone fly in the air. The speed is remarkable. It requires only a few presses of the button on the tablet to fly. It took eleven minutes to fly a 105 acre field. During the flights, the camera records Normal Digital Vegetative Index. The values will be used in a formula to predict yield. The best time for flying is when the plants are at stage V12 in order to draw the most accurate estimates.

Data Processing

A picture of what the greenseeker data looks like once it is loaded into ArcMap. Each line accounts for the L,N, and R strips.

Once the data is collected, it is time to make use of it. The NDVI  data from the greenseeker is put into ArcMap. ArcMap is a software program that allows for the spatial analysis of relationships. It is extremely useful not in gathering information but in manipulating it in order for conclusions to be made.

First, the data is cleaned and trimmed so there are no outlying values present. Points are added to make the the polygons that will create the final data set. Once the polygons are made around each strip, the join function will be used. The join tool uses one data set’s attributes to and fixes that to another’s location. Each strip gets its one attributes. Then from that the difference in NDVI can be determined between each strip.

A picture of the data set from the joined data sets. It may not look like much, but it holds lots of important information.

This is done for each and every field. A report is made of all the fields. The increased NDVI in the Nrich strip supports that the corn is healthiest where it has sufficient nutrients. It is also worth noting that the average NDVI for all fields that were recorded at V6 is higher than the other fields at V5 and V4. This type of approach can give us insight on what areas of the field are the healthiest in order to manage accordingly.

A picture of the final report of the NDVI for all fields including the average, and the average according to the stage when the data was collected.

Data Collection

A picture of myself taking soil samples in a strip.

Just before the side-dress nitrogen fertilizer is applied to the corn fields, it is time to do a lot of field work. To begin, the PSNT (pre-side dress nitrogen test) is taken. They are soil samples taken in relation to the GPS points in the field. It requires 8 cores of soil from 12 inches deep. Along with that is sample of 8 cores at 8 inches deep to measure the concentration of other macro nutrients like potassium and phosphorous. Each field has a L, R, and an N strip. The N strip is where the extra fertilizer is added to. Depending n the size of the field, the number of points vary. In some fields there may be up to 19. That is 114 soil samples for one field!

Another job is to walk the greenseeker. The greenseeker is a device that measures Normal Digital Vegetative Index (NDVI). It is used to quantify vegetation by measuring the difference between near-infrared (which vegetation strongly reflects) and red light (which vegetation absorbs). This is one way to estimate the potential yield.

ndvi formula

The formula for NDVI. NIR stands for the near-infrared light reflected and Red is the amount red light absorbed.

Covering each strip does take a long time since there is only one greenseeker. It’s especially grueling during the heat and humidity of summer while keeping at a constant speed at 3 feet above the canopy.

A picture of myself walking the greenseeker at Aurora.

Drones flying can be very challenging.  Weather and surrounding objects play a large role in the success of a drone flight for a particular field.  The drone is responsible for taking multi spectral satellite images that measures the amount of reflected light by the plants from the sun.

A close view of the drone used to take light images.


It has been an insane period of time traveling across the New York from Peru, to Hudson Falls, and to Perry. In total 30 fields and 5 research plots were soil sampled, had greenseeker data, and drone images taken. A total of 3147 soil samples! The next part of the project is processing the data in order to make sense of it all.

Nrich Strips

Corn is an extremely important crop to agriculture in New York State and nitrogen is the most limiting nutrient. The work being done my supervisor in the Nutrient Management Spear Program is to study how added nitrogen affects corn yields. The studies are called Nrich strip trials.

In order to begin the study, fields with at least three years of yield data are selected, preferably large ones since they typically have more variability. The yield data is arranged to represent 4 different quadrants in the field.

Quadrant 1- High yielding, low variability

Quadrant 2- high yielding, high variability

Quadrant 3- Low yielding, high variability

Quadrant 4- Low yielding, low variability

A week after planting, a strip spanning the length of the field is laid out. It is where the extra nitrogen fertilizer is applied at side dress time, usually 75 lbs. more per acre. The strips are about two chopper or combine passes wide in order to draw accurate conclusions.


A quadrant map of two fields selected for this project. The gray marks indicate the area for extra nitrogen fertilizer.


Once the trial is set up, GPS points are taken in the field. The points are the locations from where the pre-side dress nitrogen test (PSNT) will be taken. A PSNT measures the amount of nitrate (NO3-) in the soil. Nitrate is an inorganic form of nitrogen that plants most readily take up. Along with the PSNT, drone images, and green seeker data is taken when there are six collard leaves on the plants, otherwise known as V6 stage. That is where I will begin my next post.


A hand-held GPS.

GPS points taken from the field are downloaded into Arc Map to create a map like this. The white rectangle represents the Nrich strip.


This is a diagram explaining what collard leaves on a corn plant look like.

The Nutrient Management Spear Program

Hey everyone, I’m John Harvey, an Agricultural Sciences major. I would like to talk about my first weeks as an intern with the Nutrient Management Spear Program.

Honestly, I had never worked outside of the family farm for the summer. I previously would be on the farm in an environment that I had been accustomed to being in. Same people. Same location. The day I first arrived at Morrison Hall, I was caught in a whirlwind. Not a person that I had ever seen before. Reality hit me of how much of a different setting this was from what I had been used to. I realized how little I knew about data collection and precision Ag. I knew from then on what it would take to help the program in as many ways as possible.

From soil sampling to flying drones, there is always something to do. Everyday there are hands on learning experiences. Somehow, I am able to manage the many tasks that I have to do within the program. Most importantly, the major benefits of being part of the NMSP is the people.

It is an honor to work with this team. We share common goals and interests. I realize good laughs is the way to form close bonds between one another.  Everyday, I look forward to what not only the NMSP has to offer me, but what I have to offer the NMSP.

Hanging out with the team in Canton, NY From Left to right: Me, Dillip, Greg, Tulsi, Angel

Skip to toolbar