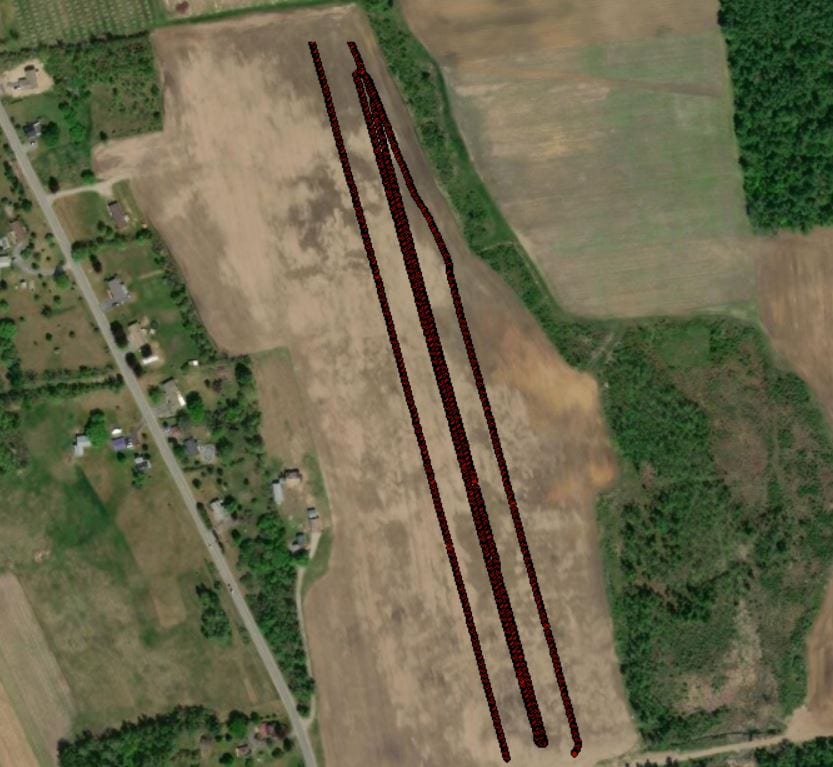
A picture of what the greenseeker data looks like once it is loaded into ArcMap. Each line accounts for the L,N, and R strips.
First, the data is cleaned and trimmed so there are no outlying values present. Points are added to make the the polygons that will create the final data set. Once the polygons are made around each strip, the join function will be used. The join tool uses one data set’s attributes to and fixes that to another’s location. Each strip gets its one attributes. Then from that the difference in NDVI can be determined between each strip.
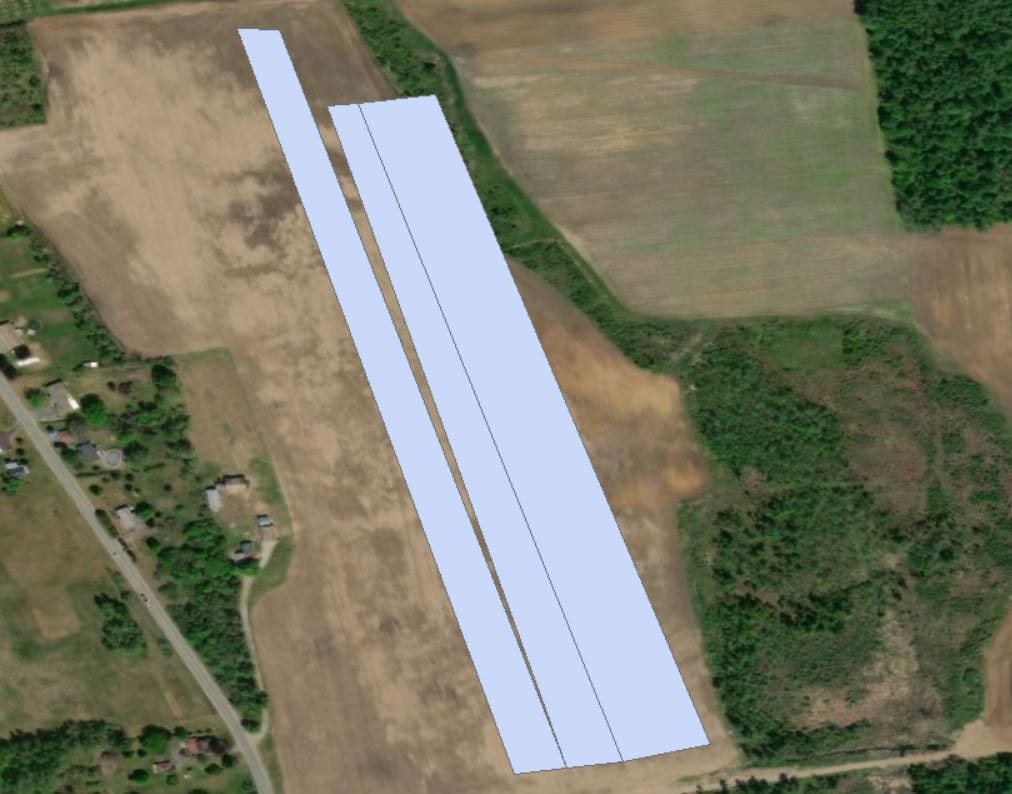
A picture of the data set from the joined data sets. It may not look like much, but it holds lots of important information.
This is done for each and every field. A report is made of all the fields. The increased NDVI in the Nrich strip supports that the corn is healthiest where it has sufficient nutrients. It is also worth noting that the average NDVI for all fields that were recorded at V6 is higher than the other fields at V5 and V4. This type of approach can give us insight on what areas of the field are the healthiest in order to manage accordingly.
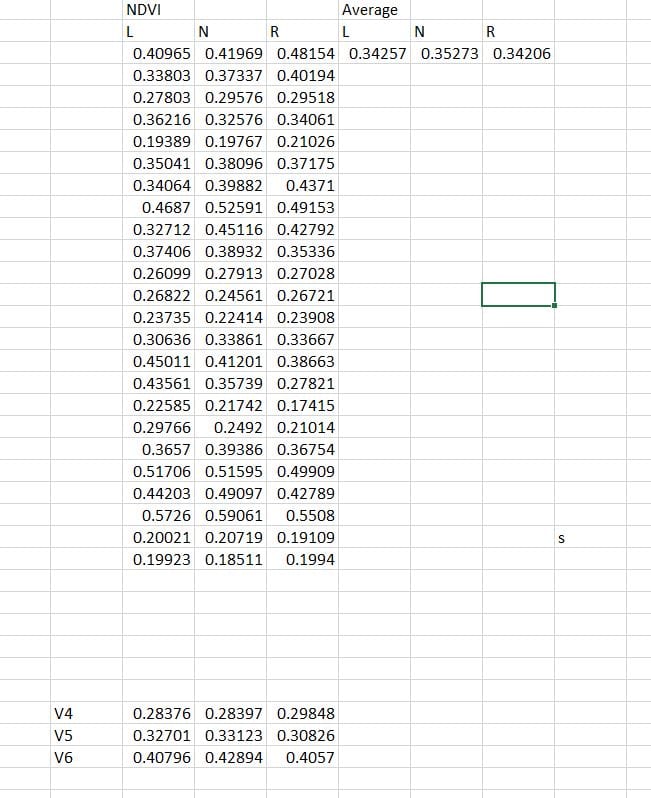
A picture of the final report of the NDVI for all fields including the average, and the average according to the stage when the data was collected.