
Benjamin Lehman

Week Ten: Road Trip to North Country

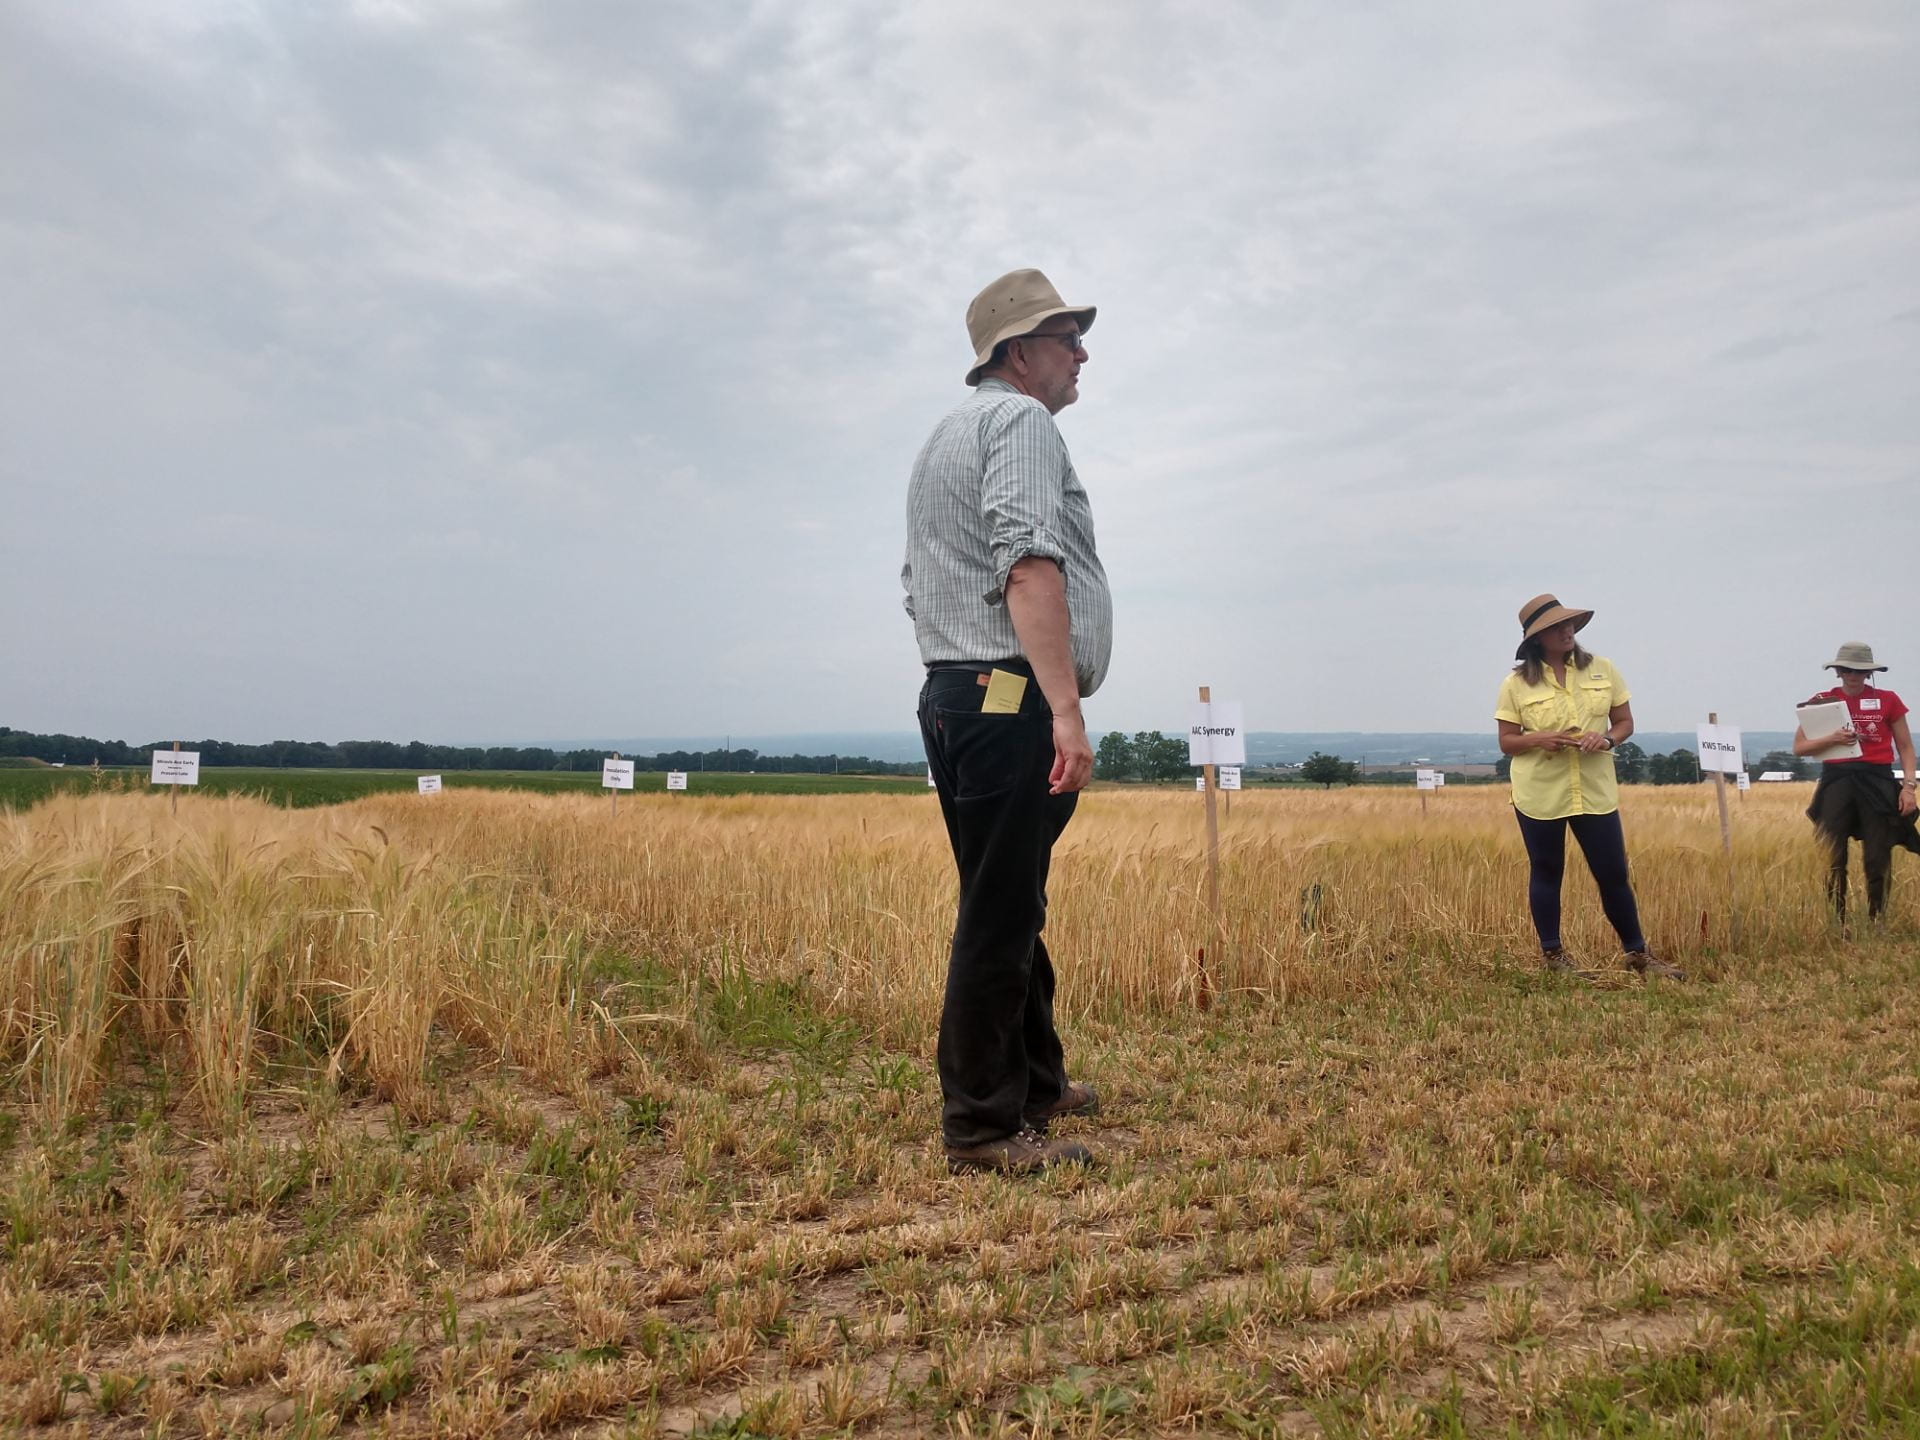
This week I got to spend even more time with extension agents in the field! I drove up to North Country to spend some time with Mike Hunter, a Field Crops Specialist with the CCE North Country Regional Ag Team. Mike led a field day that morning at some of his soybean herbicide plots. Although most weeds are still pretty well controlled by glyphosate, Mike is working hard to develop strategies for farmers to deal with the relatively new challenges presented by herbicide resistant weeds. Tall waterhemp, Palmer amaranth, and glyphosate-resistant marestail are all large threats to crop production in this region of New York State.

Marestail in soybean field

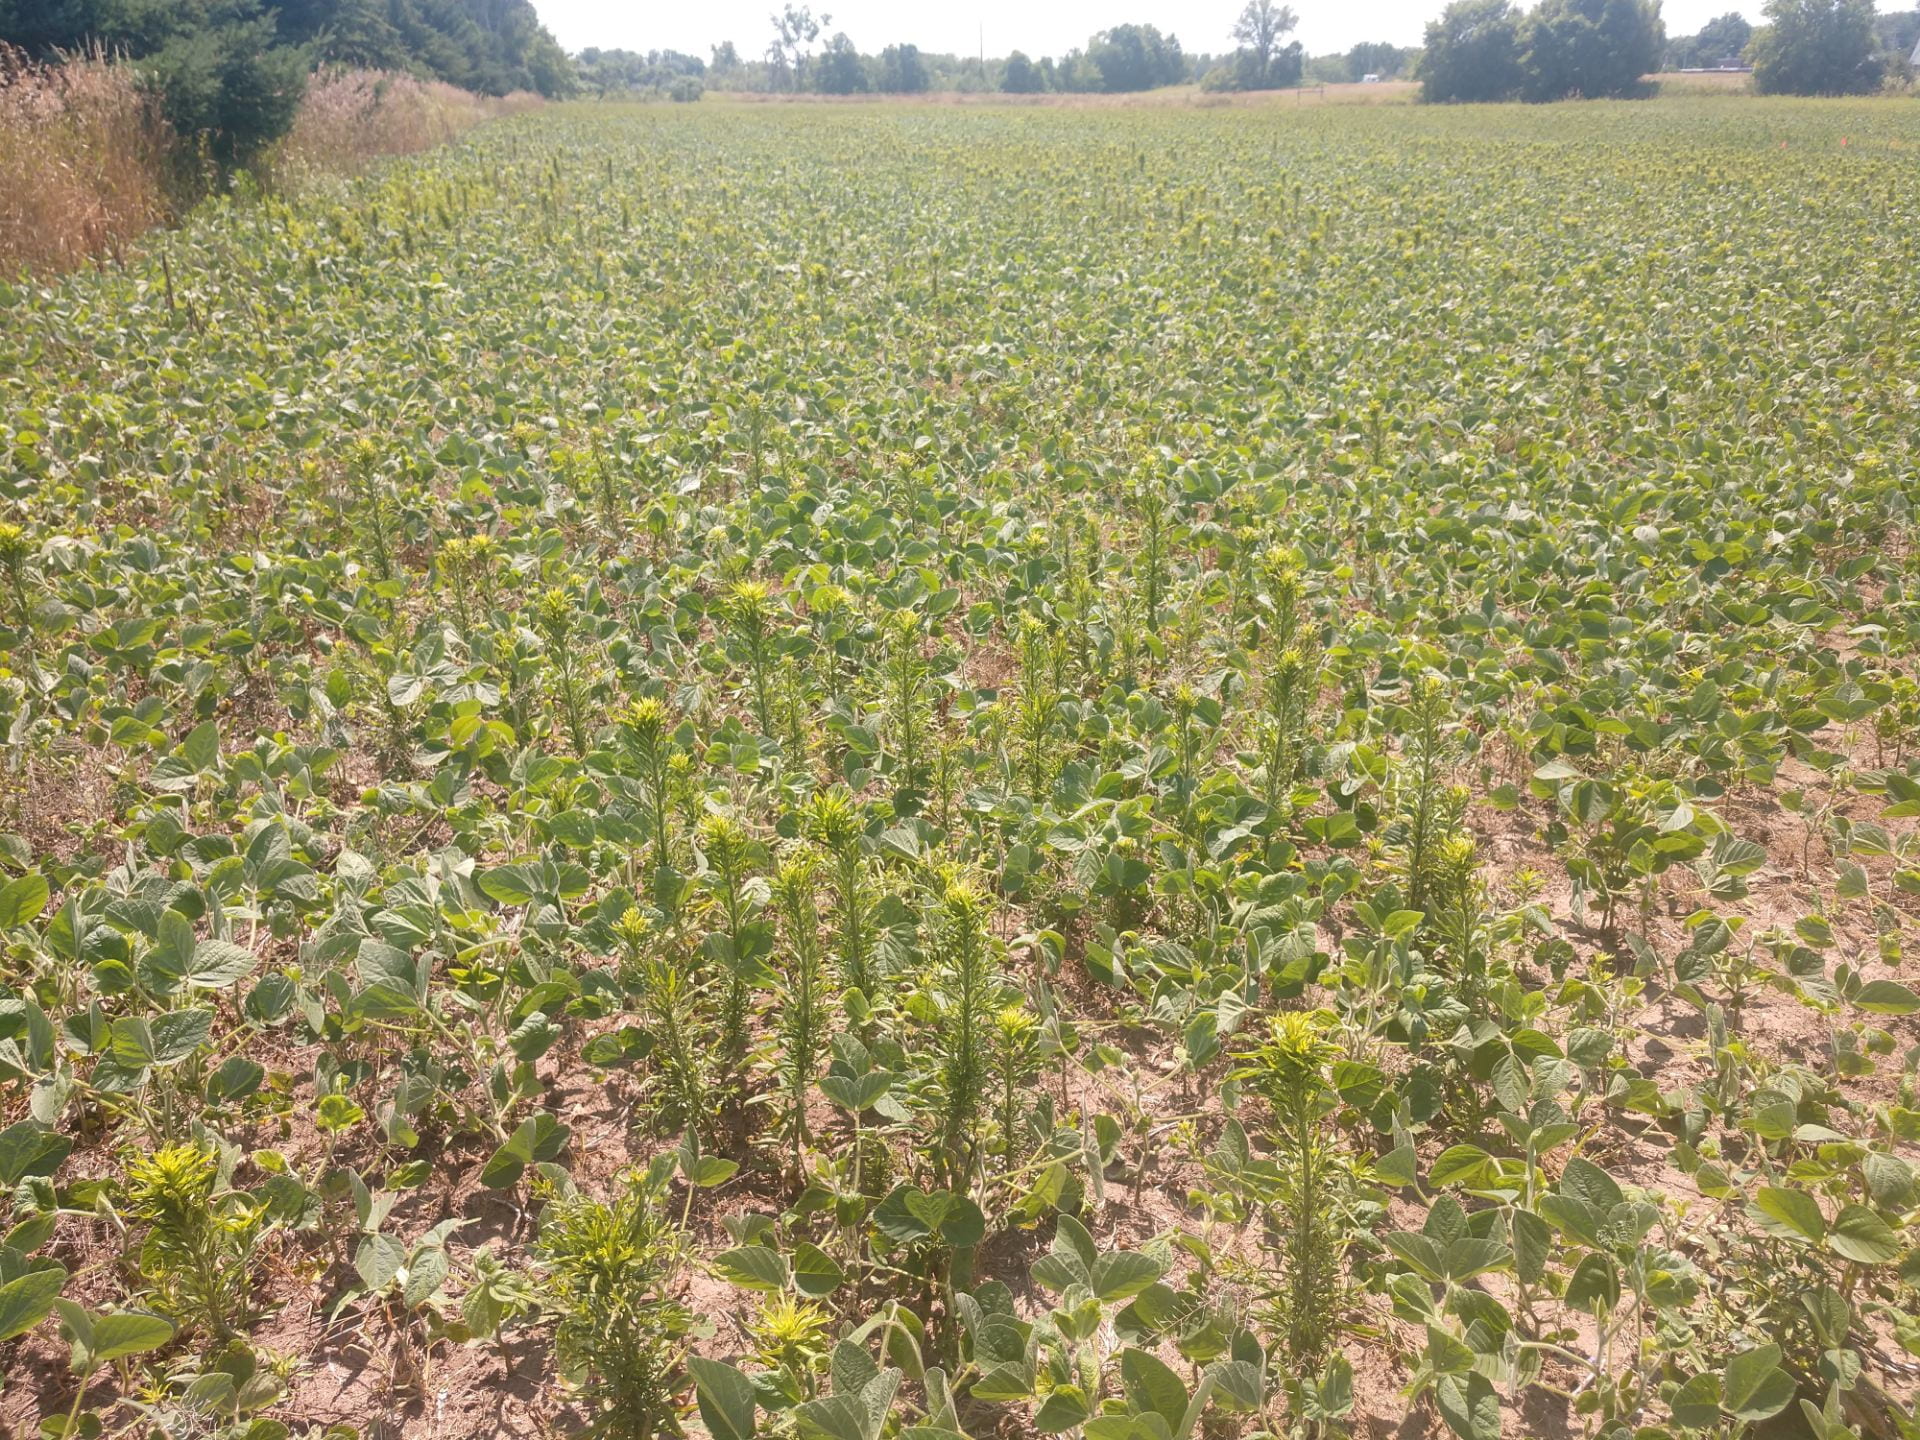
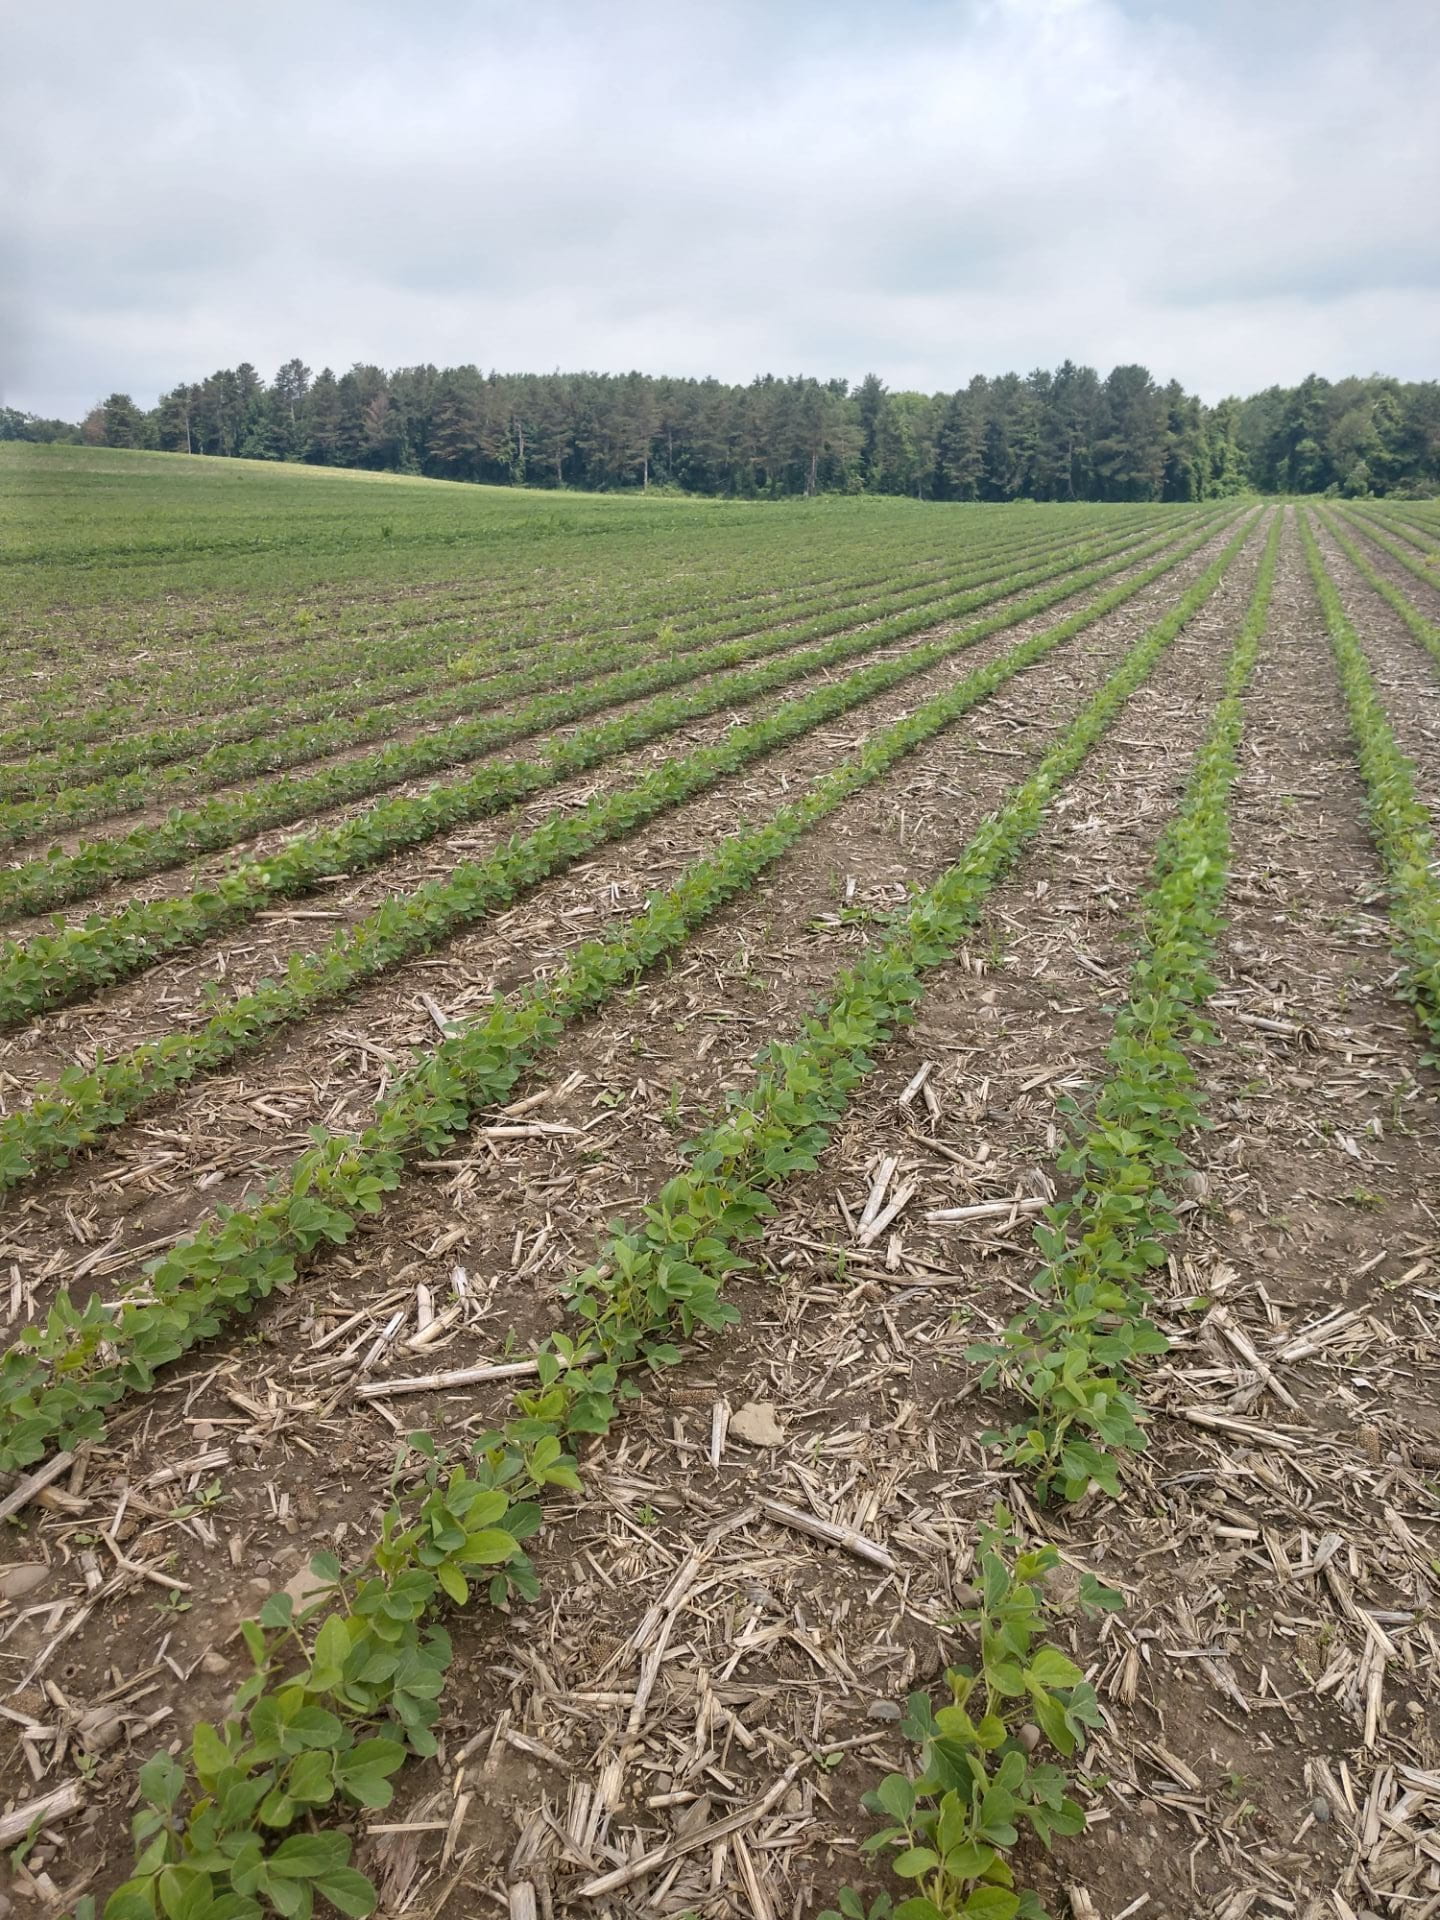
Mike took me out to a couple of farmer’s fields to look for possible signs of herbicide-resistant weeds. This soybean field has already been sprayed with glyphosate, but the marestail is is rampant! If the marestail goes to seed, it will be very difficult to control here for years to come.

Maintaining good relationships with local farmers is also an important part of Mike’s work. He has to be able to communicate the results of his own test plots along with other new science in a way that makes sense and is applicable to each farmer that he works with. One example of this is Reed Haven Farms. The farm produces around 1200 acres of crops to feed their dairy herd. Getting to tour their farm gave me an opportunity to see how technology and science can help farms of all sizes.

Alleyway and cows

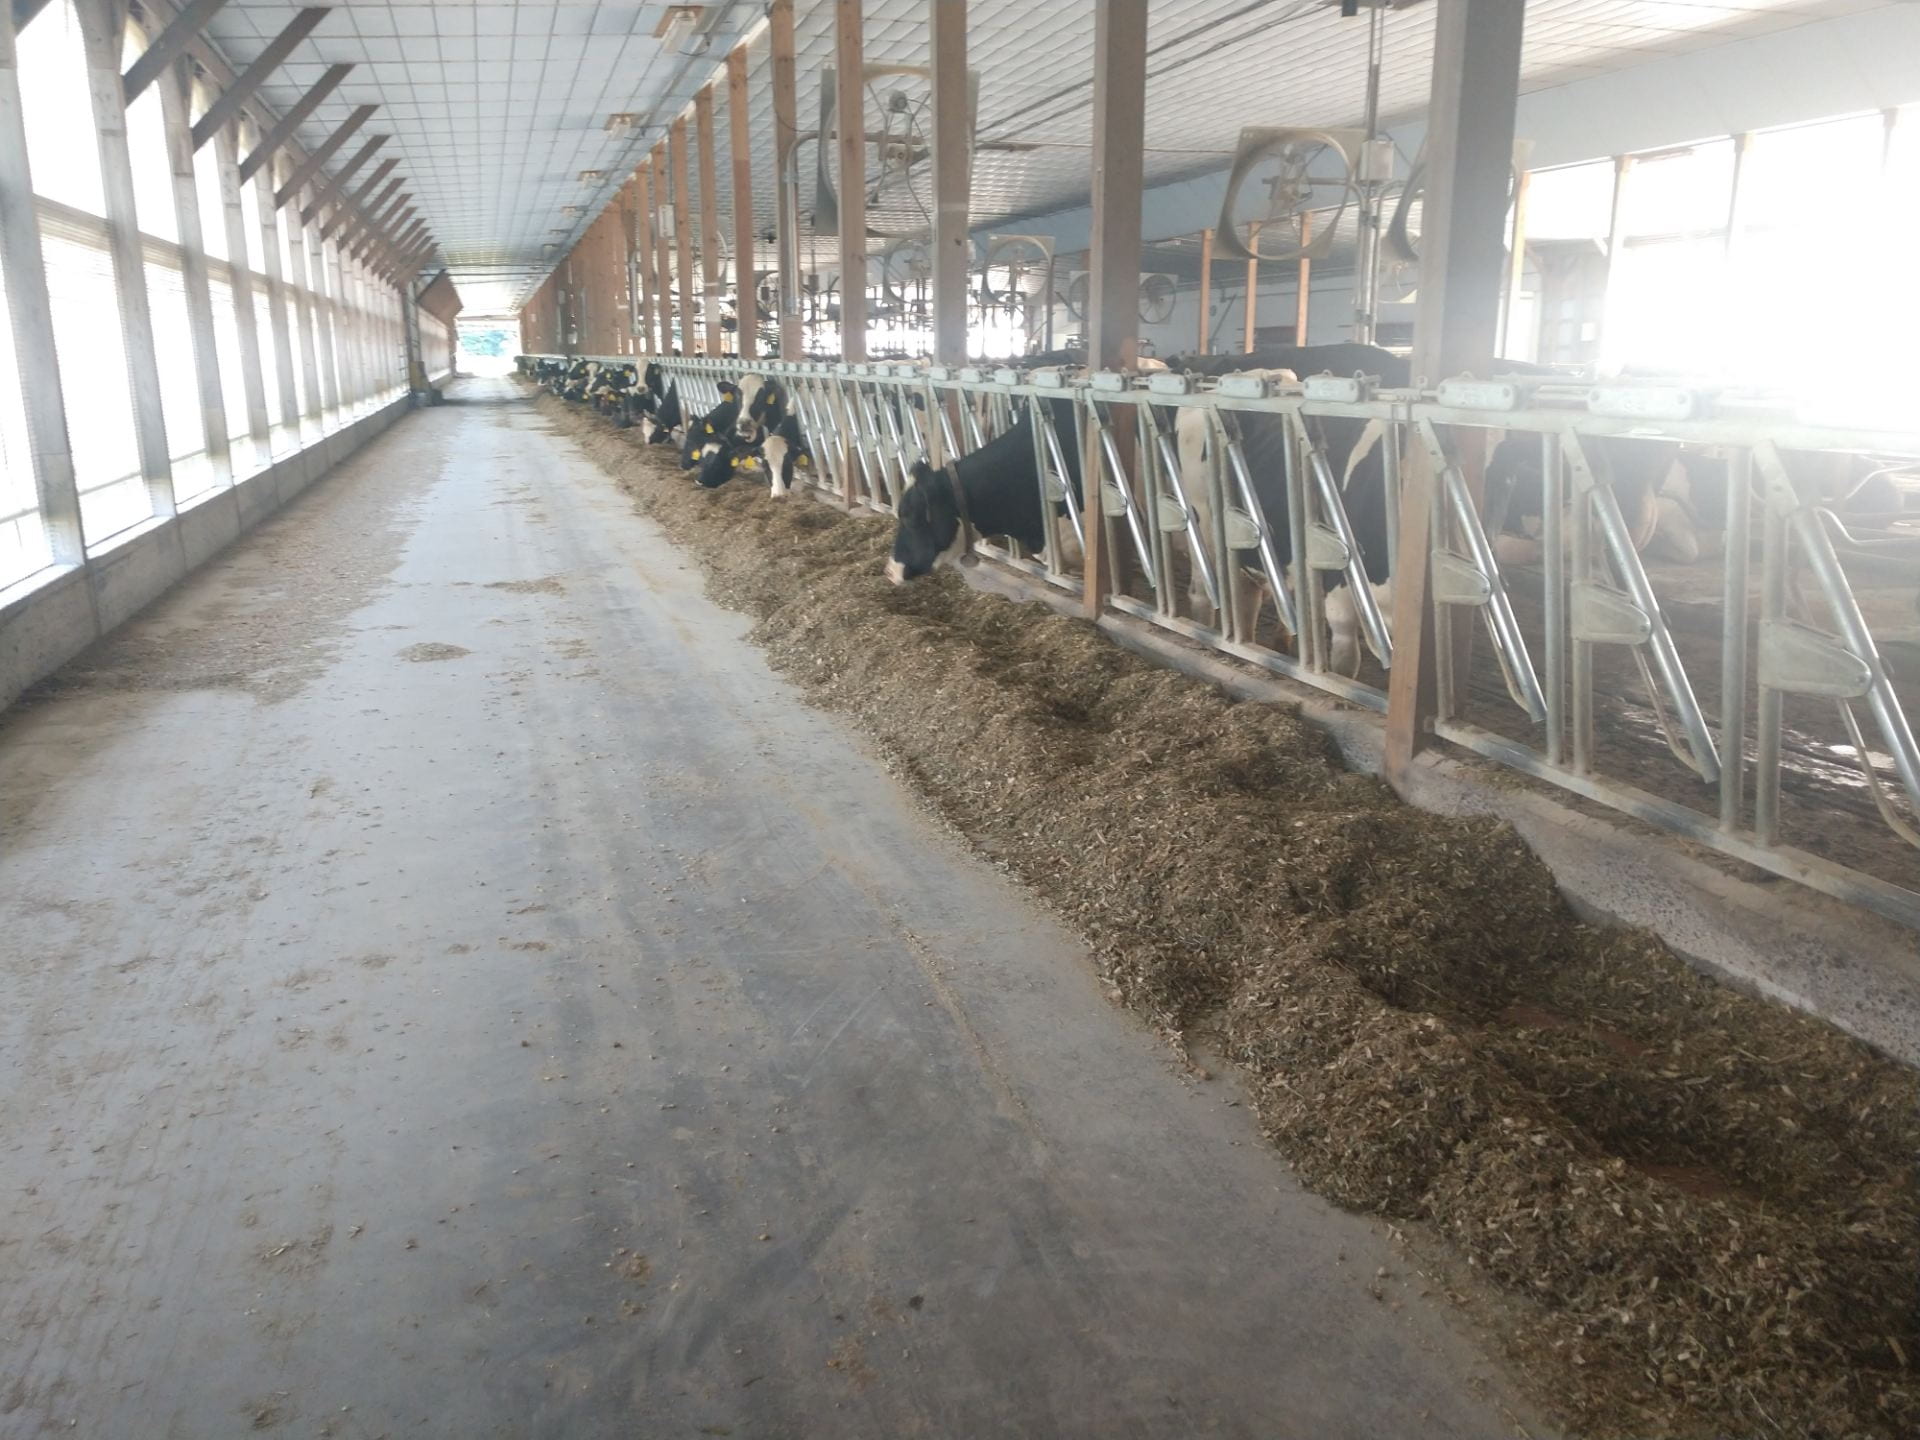
At Reed Haven, most of the cows are milked by robotic milkers. This cuts down on long term labor costs and volatility, allowing the farmers to focus more on other management aspects of the farm. Pictured here, an alleyway has also been neatly swept by a robotic feed-pusher.

Using laser guidance to attach milk cups to the cow, the robotic milker lowers stress for animals and has helped the farm achieve low somatic cell counts. The cow is able to quickly and comfortably be milked out on her own schedule. Tons of data gets collected from each cow, including the number of chews per day as well as the amount of milk delivered from each quarter of the udder. I posted a video of the milker in action below. The farm currently has 3 milking robots, with the infrastructure in place to add 2 more milkers to their main barn soon.

Week Nine: Work with Extension

Soybean field

This was one of my favorite weeks field-work wise. I got to drive out to meet with Jodi Putman, a Field Crop Specialist with the Northwest New York Dairy, Livestock & Field Crops Team. Jodi stays incredibly busy. She works full time with CCE as well as taking classes and doing research through a Cornell graduate student program. I got to hear her talk about some of the history behind sulfur availability in the United States as well as current soybean crop needs at the Musgrave field day earlier this year, so it was really exciting to see more of her plots in action.

Josh and Jodi and weeds

Jodi and Josh, the new Field Crops and Forage Specialist with the Southwest New York Dairy, Livestock, and Field Crops Program, also took the time to give me some weed ID lessons in the field. Sedges have edges!

We started out the day sampling soybean trifoliates to be tested for sulfur content. It is very important for crops to have the right balance of essential nutrients available to try and avoid literally any shortage during the growing season. If plants have the right amount of each nutrient available at the right time of the year, not only will yields increase but possible nutrient losses are also greatly decreased. If soybeans don’t have enough sulfur at key points in the growing season, even large amounts of other nutrients will not be able to be used by the crop.

bean

To sample soybean trifoliates, we picked the youngest fully developed leaves off of the plant. We sampled around 20 plants per plot. There were 4 treatments and 4 replications, so in total we sampled over 300 plants in one field alone.

Jodi also took me out to a local farmer’s field to see some possible European Corn Borer damage. The farmer didn’t plant the field with Bt treated seed, so the corn was genetically vulnerable to ECB attack. This kind of scouting is a big part of Jodi’s job. The farmer needed help figuring out how much of the corn was damaged and whether or not it was worth using a chemical to treat the corn this late in the season. Although a lot of damage was already done, Jodi was able to give some advice to help avoid future infestation.

ECB damage

By scouting several sections of the field for damage, farmers and extension agents are able to determine the financial viability of chemical applications to control for pests like ECB.

ECB

After unrolling some leaves, Jodi uncovered this well-fed European Corn Borer. This told us that the farmer was correct in IDing the cause of the damage.

Week Eight: Field Day at Musgrave

Barley at the Musgrave field day

Several NMSP team members made the quick drive out the Musgrave Research Farm for their annual field day earlier this week. It was really exciting to see how scientists communicate the value of their ongoing projects with both other researchers and the general public. There were a lot of cool speakers and a great lunch featuring Cornell Chicken Barbecue Sauce.

Kernza growing with red clover

Pictured: Kernza®️ intercropped with nitrogen-fixing red clover. This trial aimed to see whether or not farmers could avoid using expensive nitrogen fertilizer while still harvesting a strong grain crop.

One of the most interesting plots was the full field of intermediate wheatgrass. This crop goes by the tradename Kernza® and is known for both its exceptionally large root system and its ability to perenially produce bread quality grain. This means that the need for tillage is greatly limited, and the long roots are believed to support healthy soil development even on marginal land. Unfortunately, low yields have been a large challenge with this crop. The trial at Musgrave found that the crop stand gets so thick after a few years of establishment that grain yield is limited by self-competition. The researchers were able to relieve some of this pressure by using strip tillage to lower the amount of plants per acre. This seemed to be very effective at increasing yield, but not to the point that Kernza® was competitive with wheat on a pounds-per-acre basis. However, Kernza® also provides high quality straw forage for livestock which could make it a suitable crop for farmers with land at risk for soil erosion. I will be very curious to see how researchers continue to develop these cropping systems in the future, especially if carbon marketing comes into play for American farmers.

Week Seven: Drones!

Quantix drone

In this image, Greg is inserting a fresh battery for a new round of flights. Quantix drones can survey up to 400 acres on a single 45 minute flight.


This week I got to see even more drone action in the field. Greg and I drove up to several farms and he walked me through the flight process in more detail. Greg is a FAA certified drone pilot and has been troubleshooting with our current drone lineup for quite a while. He has run into some issues with one of the drones, Quantix, which is almost too automated for its own good. The Quantix take-off and landing processes are fully automated, which means that the drone not only pilots itself but also sets its own take-off and landing flight path. Although the drone has a unique method of vertical take-off and landing, it is still at a relatively low altitude when it begins its second round of fixed-wing style flight while increasing or decreasing altitude. Quantix drones are considered “hybrids,” in that they combine the agile helicopter-style flight of quad-copters as well as the speedy and highly efficient cruising motion of fixed-wing planes.


Although it would normally be a big perk to have the pre-scan and post-scan flight paths automatically generated, the tree lines in New York State make this style of take-off and landing very risky. It would be too battery draining for the drone to use vertical take-off to reach its final cruising altitude, so Greg has been looking for new ways to manually alter the pre-scan and post-scan flight paths. These include selecting new initial take-off and landing zones for the drone, as well as modifying the area that the drone is set to actually scan in order to force a new overall flight path. Although it would probably be incredibly easy to use in my home state of Iowa, the massive tree lines and diverse landscapes of New York State provide an array of challenges for this drone.

Week Six: Soil Sampling

This week I got to help out with some soil sampling in corn fields. NMSP is working with farmers to do trials on N-rich strips, which are sections of a field that are given so much pre-plant nitrogen that sidedressing is unlikely to be necessary. These plots help farmers to estimate how much nitrogen they need in certain areas and guess whether or not larger applications of nitrogen would make sense economically across certain management zones.

Field technicians use soil probes to take core samples from two soil depths, 8″ and 12″. The 8″ samples are used for general soil fertility tests, while the 12″ samples are tested in-house for soil nitrate levels. Although the 12″ cores can be very difficult to take in rocky soils, it’s important for researchers to know how much nitrate is present throughout the entire rooting zone.

Bagged soil sample

NMSP uses a double bagging method to keep soil samples secured and organized. The outer bag contains a small ID tag with replication and treatment info, along with the inner bag which contains the actual sample.

Soil samples in a dryer

The bags are opened up back in the lab, where the soil samples and ID tags are placed into individual cups for further processing. Soil cups are then loaded into the 50 °C dryer in order to remove most soil moisture. Processing wet soils would be very messy and lead to less reliable data.

Week Five: NDVI for Nitrogen Management

This week was very exciting! I continued working with R and several yield cleaning projects, but also got to join Greg for a couple of rounds of field work. This meant getting to see two of NMSP’s drones complete NDVI scans of corn fields. NDVI scans are able to measure the vigor of plants in the field, either to estimate yield or to help farmers more accurately place sidedress fertilizer. The latter seems very interesting but also very challenging. NDVI works on a scale of 0 to 1, with 1 being very green and 0 being not green at all.

Quantix drone

Drones are the quickest way for farmers to accurately take NDVI readings over a full field.


The greener sections of the field are assumed to not be nitrogen deficient, and the less green sections are given extra nitrogen to address lower vigor. However, lower vigor could also be due to other factors like a wet spot in the field or a deficiency of nutrients other than nitrogen. As precision ag technology continues to evolve, it will be cool to see how companies and farmers address these issues. Looking for patterns in individual leaves is one solution, but it would require very high resolution cameras and advanced imagery technology. I will be excited to learn more about this quickly moving ag sector as the summer goes on!

Week Four: Fertilizer Trials

With the improved weather over the weekend, we were able to get into the field and place some stakes for nitrogen fertilizer trials this week! I attached a picture of the stakes below. They will be used as a reference for field treatments along with GPS coordinates to be taken at a later date. To place stakes, Greg and I followed a map indicating where each plot was located in the field. Plots have randomized locations over several trials in order to avoid environmental impacts from certain field sections influencing the final results.

Fertilizer stake and label

Top: Plot or treatment number
Middle: Pre-plant nitrogen treatment in pounds per acre
Bottom: Sidedress nitrogen treatment in pounds per acre


The trial features rye terminated at several different stages along with different volumes of both pre-plant and sidedress nitrogen fertilizer. Cover crops like these are important because they can improve soil health and increase soil organic matter, both of which provide a ton of value to New York State farmers. It was really cool to see the corn poking out from under the rye stubble, especially considering the difficult planting and field work conditions that farmers have faced this year.

Week Three: Extension and Communication

This week, several technicians from a NYS digital agriculture company came in for a yield cleaning training session. This was the first time that I have had a major role in a training session so I was a bit nervous. Using Yield Editor, I walked one technician through the initial settings selection process. There are 4 distinct settings used by Yield Editor to clean harvest maps. Flow delay (as pictured above) is caused by the gap in time between the actual harvest of the crop and the moment when the crop is massed by a sensor. Moisture delay is caused by a similar issue, and is especially important when cleaning silage data (as the moisture of silage is significantly higher and more variable than corn grain moisture). Start Pass Delay and End Pass Delay are both caused by the slowing down and speeding up of the harvester at the edge of the field, which often leads to unreliable yield data.

This is an image pulled from a PowerPoint presentation that I created to help farm consultants learn the data cleaning process. As more and more farms in New York State get yield monitors on their corn harvesters, it will become increasingly important for consultants to feel confident working with that data.

This is an image pulled from a PowerPoint presentation that I created to help farm consultants learn the data cleaning process. As more and more farms in New York State get yield monitors on their corn harvesters, it will become increasingly important for consultants to feel confident working with that data.


By using both the Automated Yield Cleaning Expert (a Yield Editor feature that estimates the proper delay settings) and a more guess-and-check method, yield cleaning technicians are able to determine the proper initial settings after manually examining only 10 fields from each farm annually. After finding the proper settings for the farm, technicians are able to use low-level programming to automatically clean the harvest data from the remaining fields. This saves farmers a lot of time working with data and still provides the high level of accuracy needed for yield estimation.

Week Two: Intro to R

This week, I spent a couple of days working with Dilip to learn the process for creating farm reports from yield data sets. This is the way that NMSP shows farmers what the program does with donated harvest data and makes it easier to understand the impact of the data cleaning process. Using RStudio (pictured below) and the R programming language, I am now able to take cleaned yield data files from Yield Editor and quickly create graphs that illustrate which parts of the field contained the best data and which sections had to be removed (commonly called headlands). The reports also contain several interesting pieces of analysis. The average yield for each soil type in each field is listed on one page, with the average yield for each soil type across the whole farm listed later in the report. This information helps farmers to better understand why certain fields are high yielding and other fields continually underperform compared to the whole farm average.

Example of R code

This is an example of R code. I also went to a free R coding workshop put on by the Cornell Statistical Consulting Unit this week which was very helpful. There are a lot of good resources to start learning R, but practice is key!

Week One: Yield Editor

My first week was a bit of a rush! I started out using Yield Editor (a free software published by USDA-ARS) to clean corn data from a farm that works with NMSP on a couple of projects. Cleaning harvest data is important because it allows farmers to know exactly how much they are able to produce in certain fields. It is also important to have very accurate data for making decisions about which fertilizers to use and how much of each nutrient to apply in different sections of the farm.

Example of flow delay correction in Yield Editor

Left: Raw corn harvest data. Right: Data cleaned following the Kharel et al. protocol


Data technicians at NMSP follow the yield cleaning protocol written by Dr. Tulsi Kharel, one of my supervisors at the lab. The manual is very helpful because it’s easy to forget steps in the yield data cleaning process if you are just working from memory. Following the protocol also ensures that data sets cleaned by different technicians will still be consistent and highly accurate. Tulsi is leaving for a position with the USDA in Arkansas soon which will be sad but he has already taught me a lot about working with agronomic data. Dilip, the lead data analyst in the lab, has also been very generous with his time and has started to teach me how to use the programming language R. This will hopefully allow me to start creating farm reports based off of the cleaned yield data, which would be a new and exciting skill!

Skip to toolbar