
Painting the Roses Red, Painting the Apple Trees White

Hey y’all, welcome back to the blog! This week, I wanted to take a moment and discuss/write a list of all of the odds and ends kind of jobs to keep the FREC orchards running.

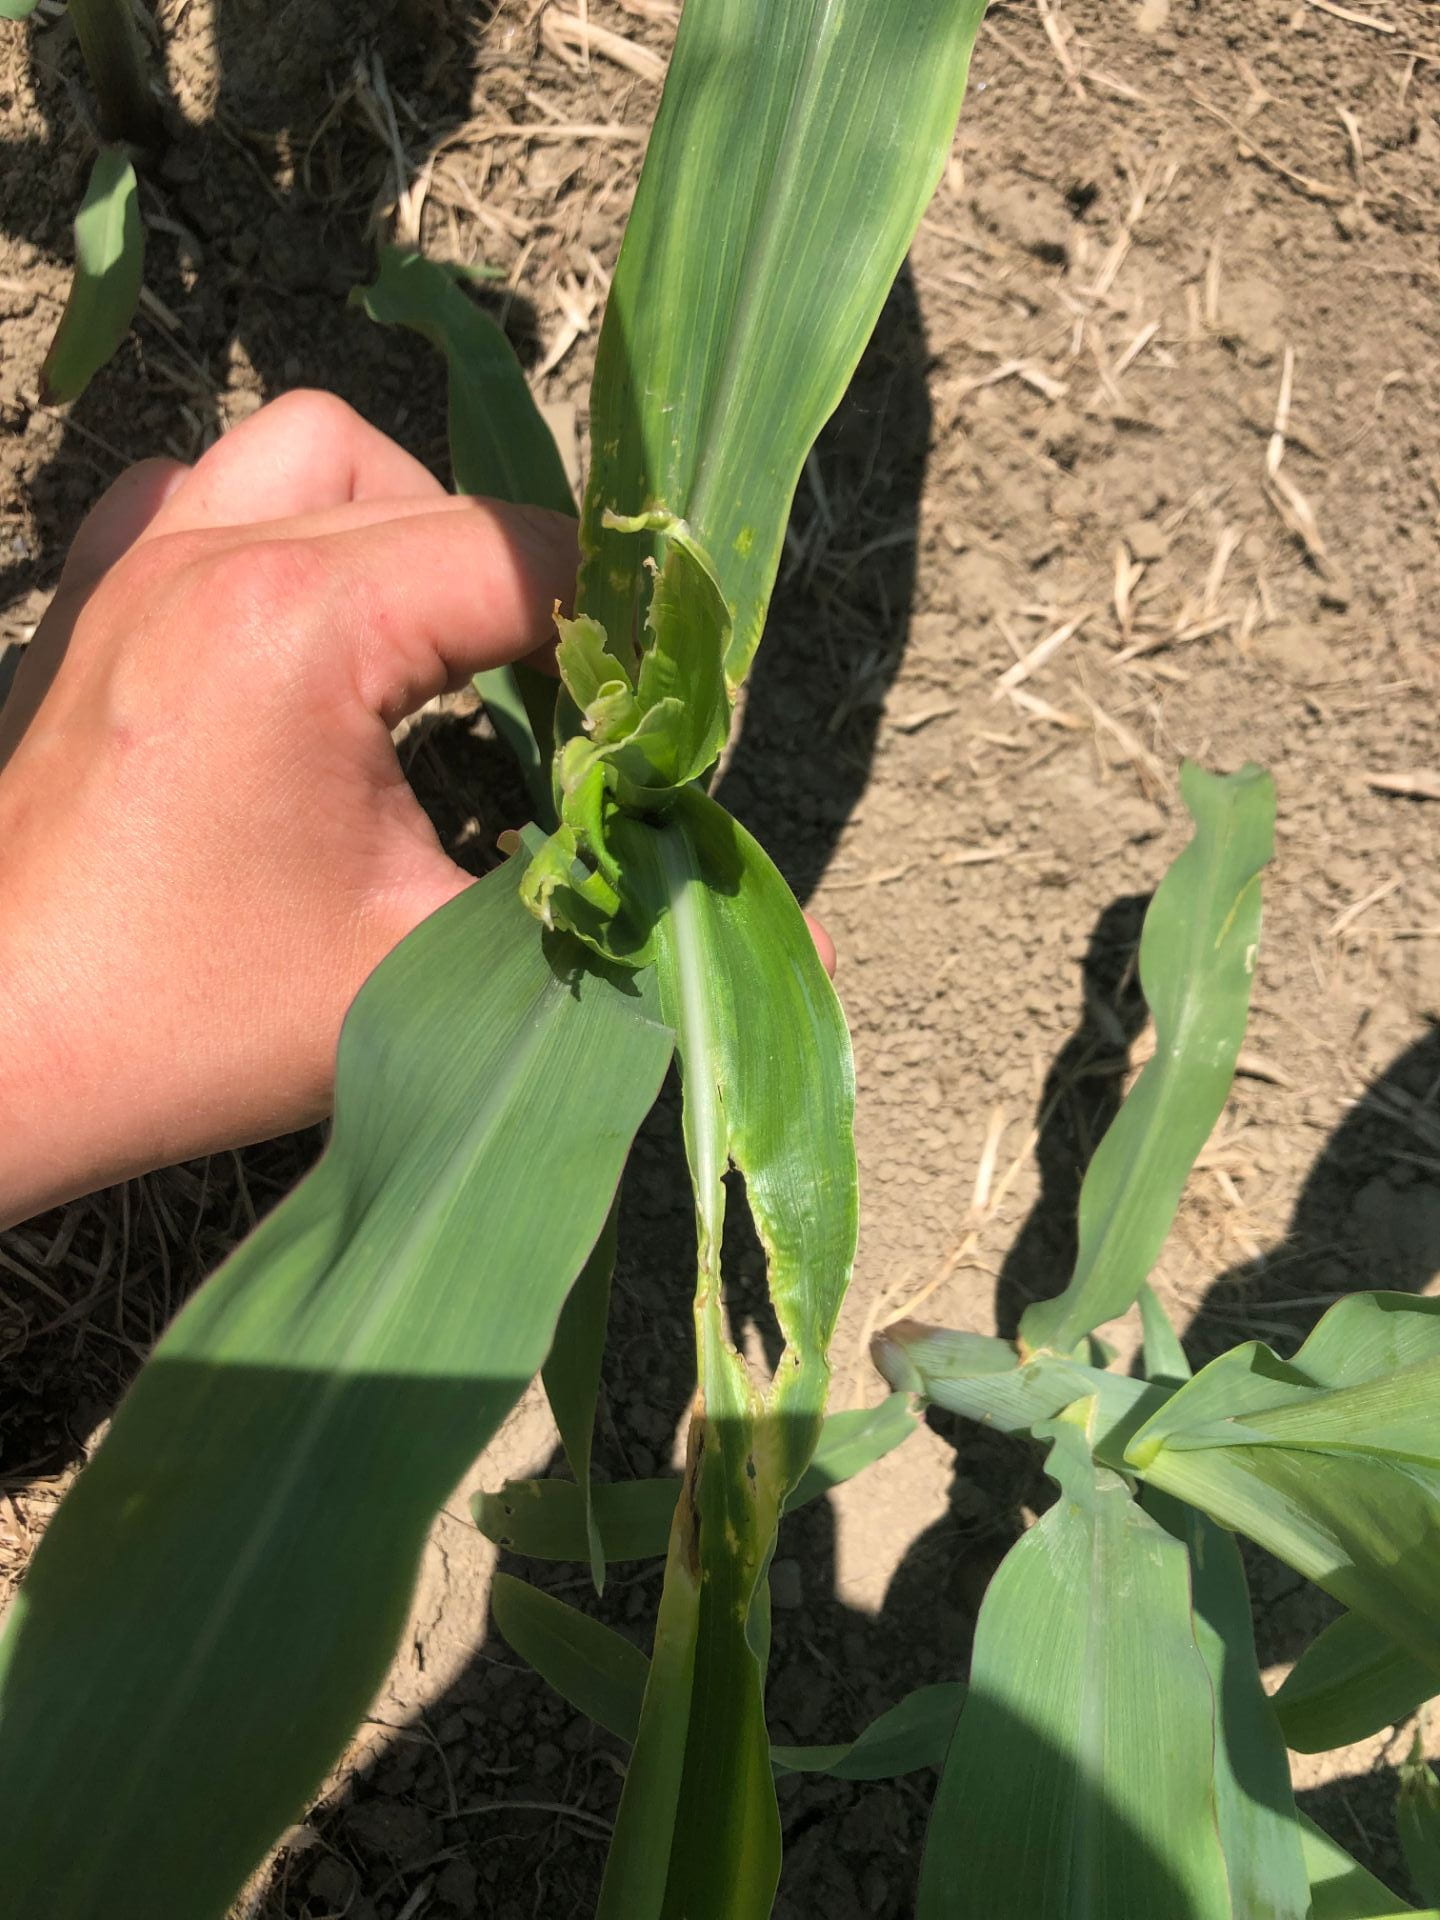
1.) The first task I wanted to talk about was tree training. It was the task that I feel like we did the most of throughout different parts of the orchard. Tree training was used to keep the trees growing in the correct direction. We would use a variety of different tools to get the trees growing correctly. This usually included tree tension clips, CEP tape, a thinner red tape, electrical tape, bamboo sticks, pruners, and a lot of patience. I will include a photo below of Megan and I tree training. This was also one of my favorite tasks because you could always find cool looking bugs or birds nests with eggs (and sometimes baby birds!).

2.) The next task was a real cow and probably one of my least favorite tasks: pruning trees. This was especially awful in a large block of peaches because it felt like it would never end. The trees were five years old and had been trained into a quad-V formation, meaning they had four scaffolds tied to trellis wires. The trees needed to be pruned on both side of the row because of this type of training and because they were tall, they needed done on both the tops and the bottoms. Additionally, the trellis wire was plastic, not metal wire, so it was very easy to cut and break with your pruners. Unfortunately, I did that twice.

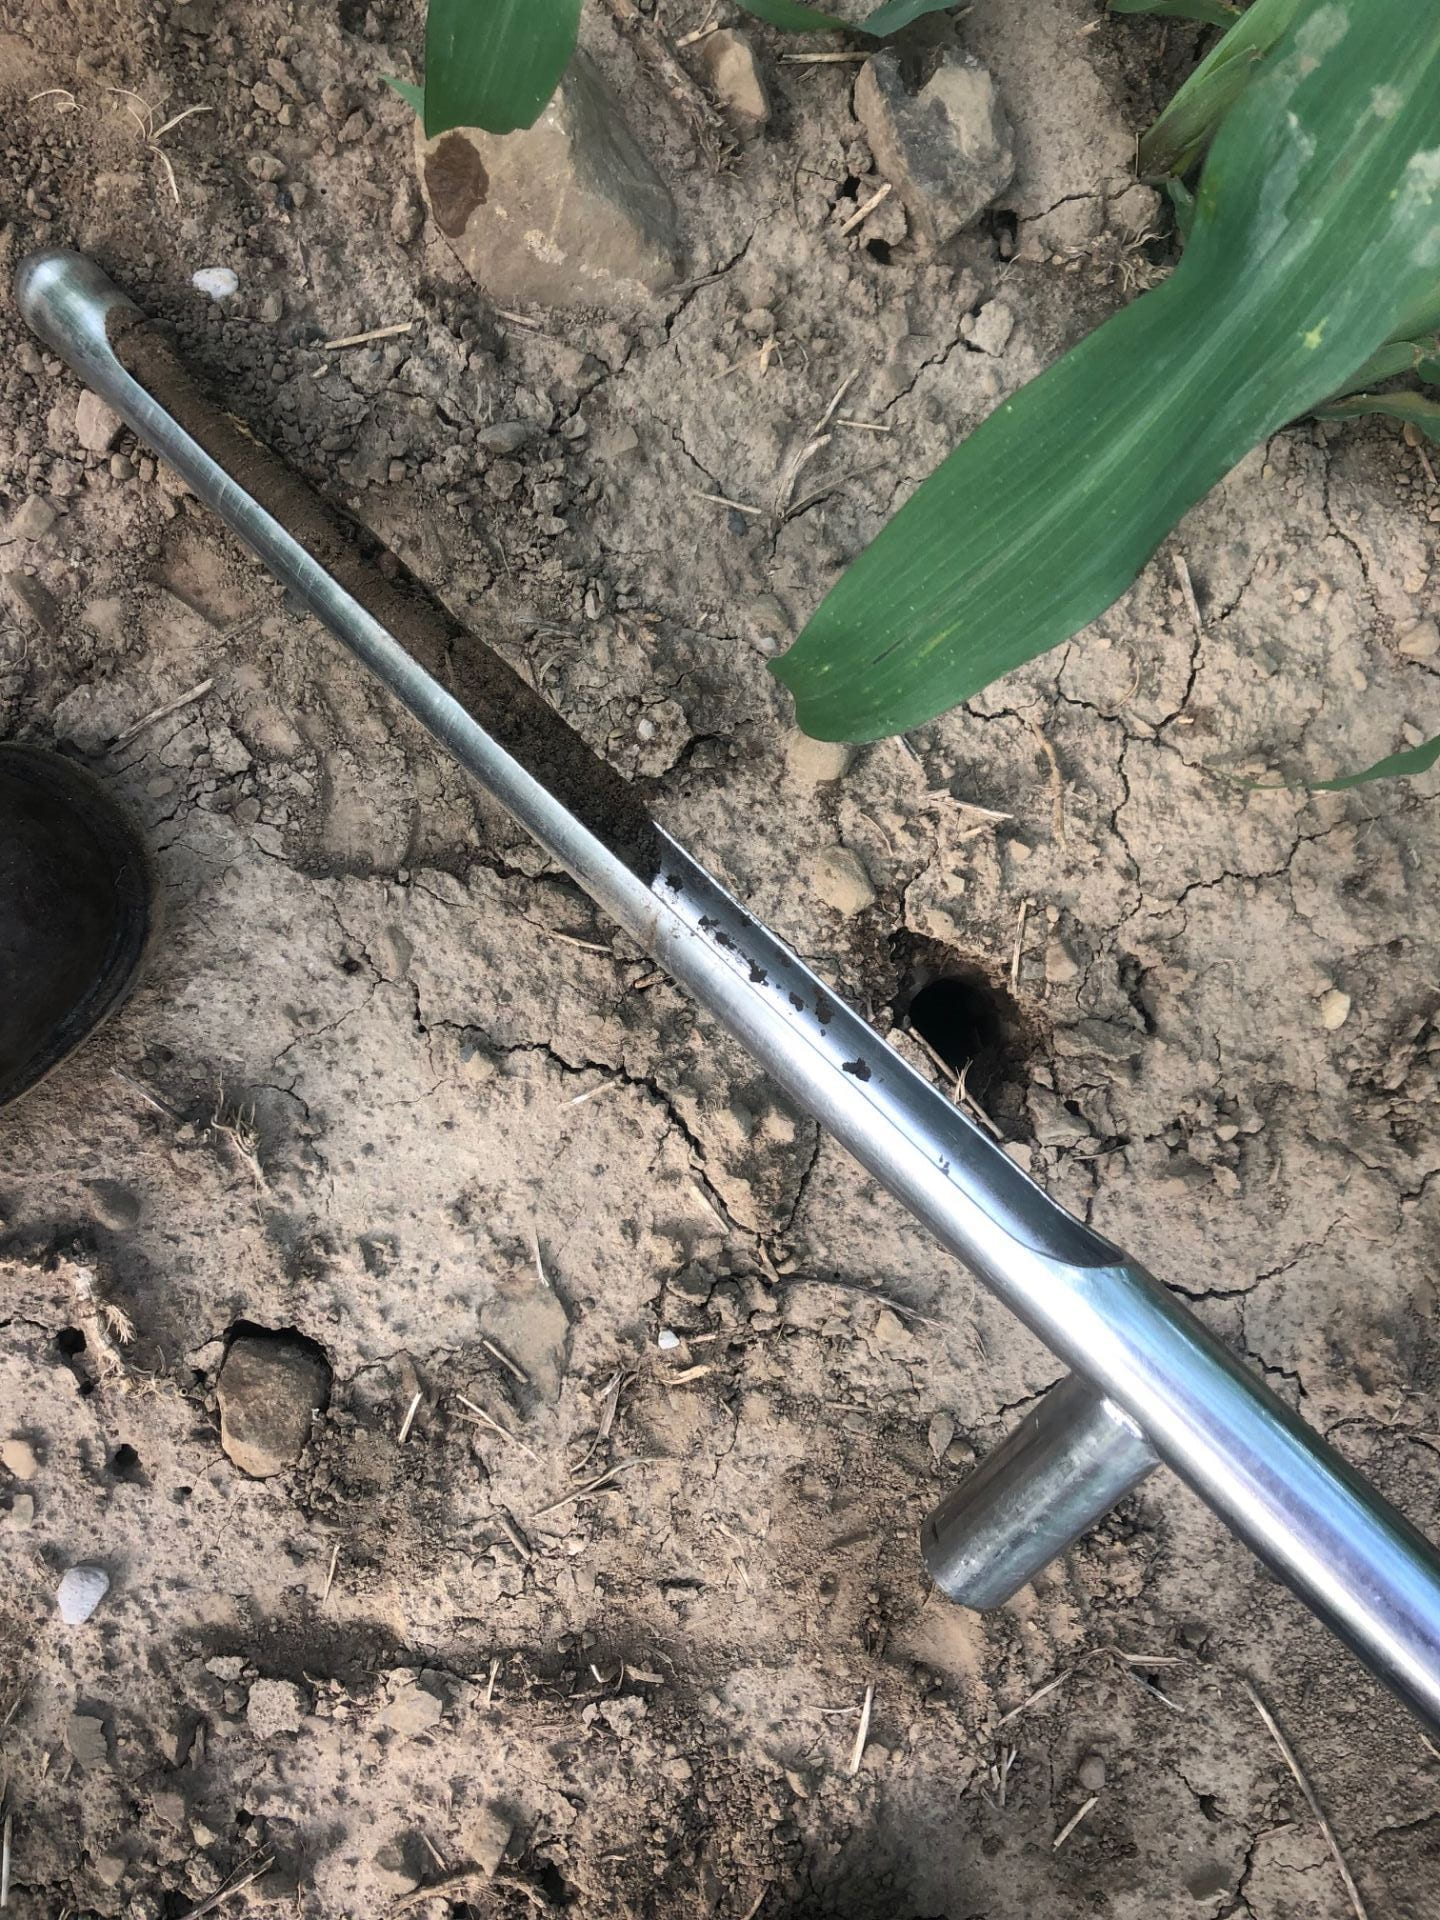
3.) The third task that I did was also quite painful and also in the same aforementioned block of peaches. I had to take soil samples of the different plots of trees. There were seventy five plots of five trees each and I need to get a soil sample from each tree. That’s 375 samples, 375 holes in the ground. Additionally, the soil probe is ineffective in the soil we had because it was so rocky, so I had to use a shovel. Ever since I did that, I have compared every other task we did to that one.

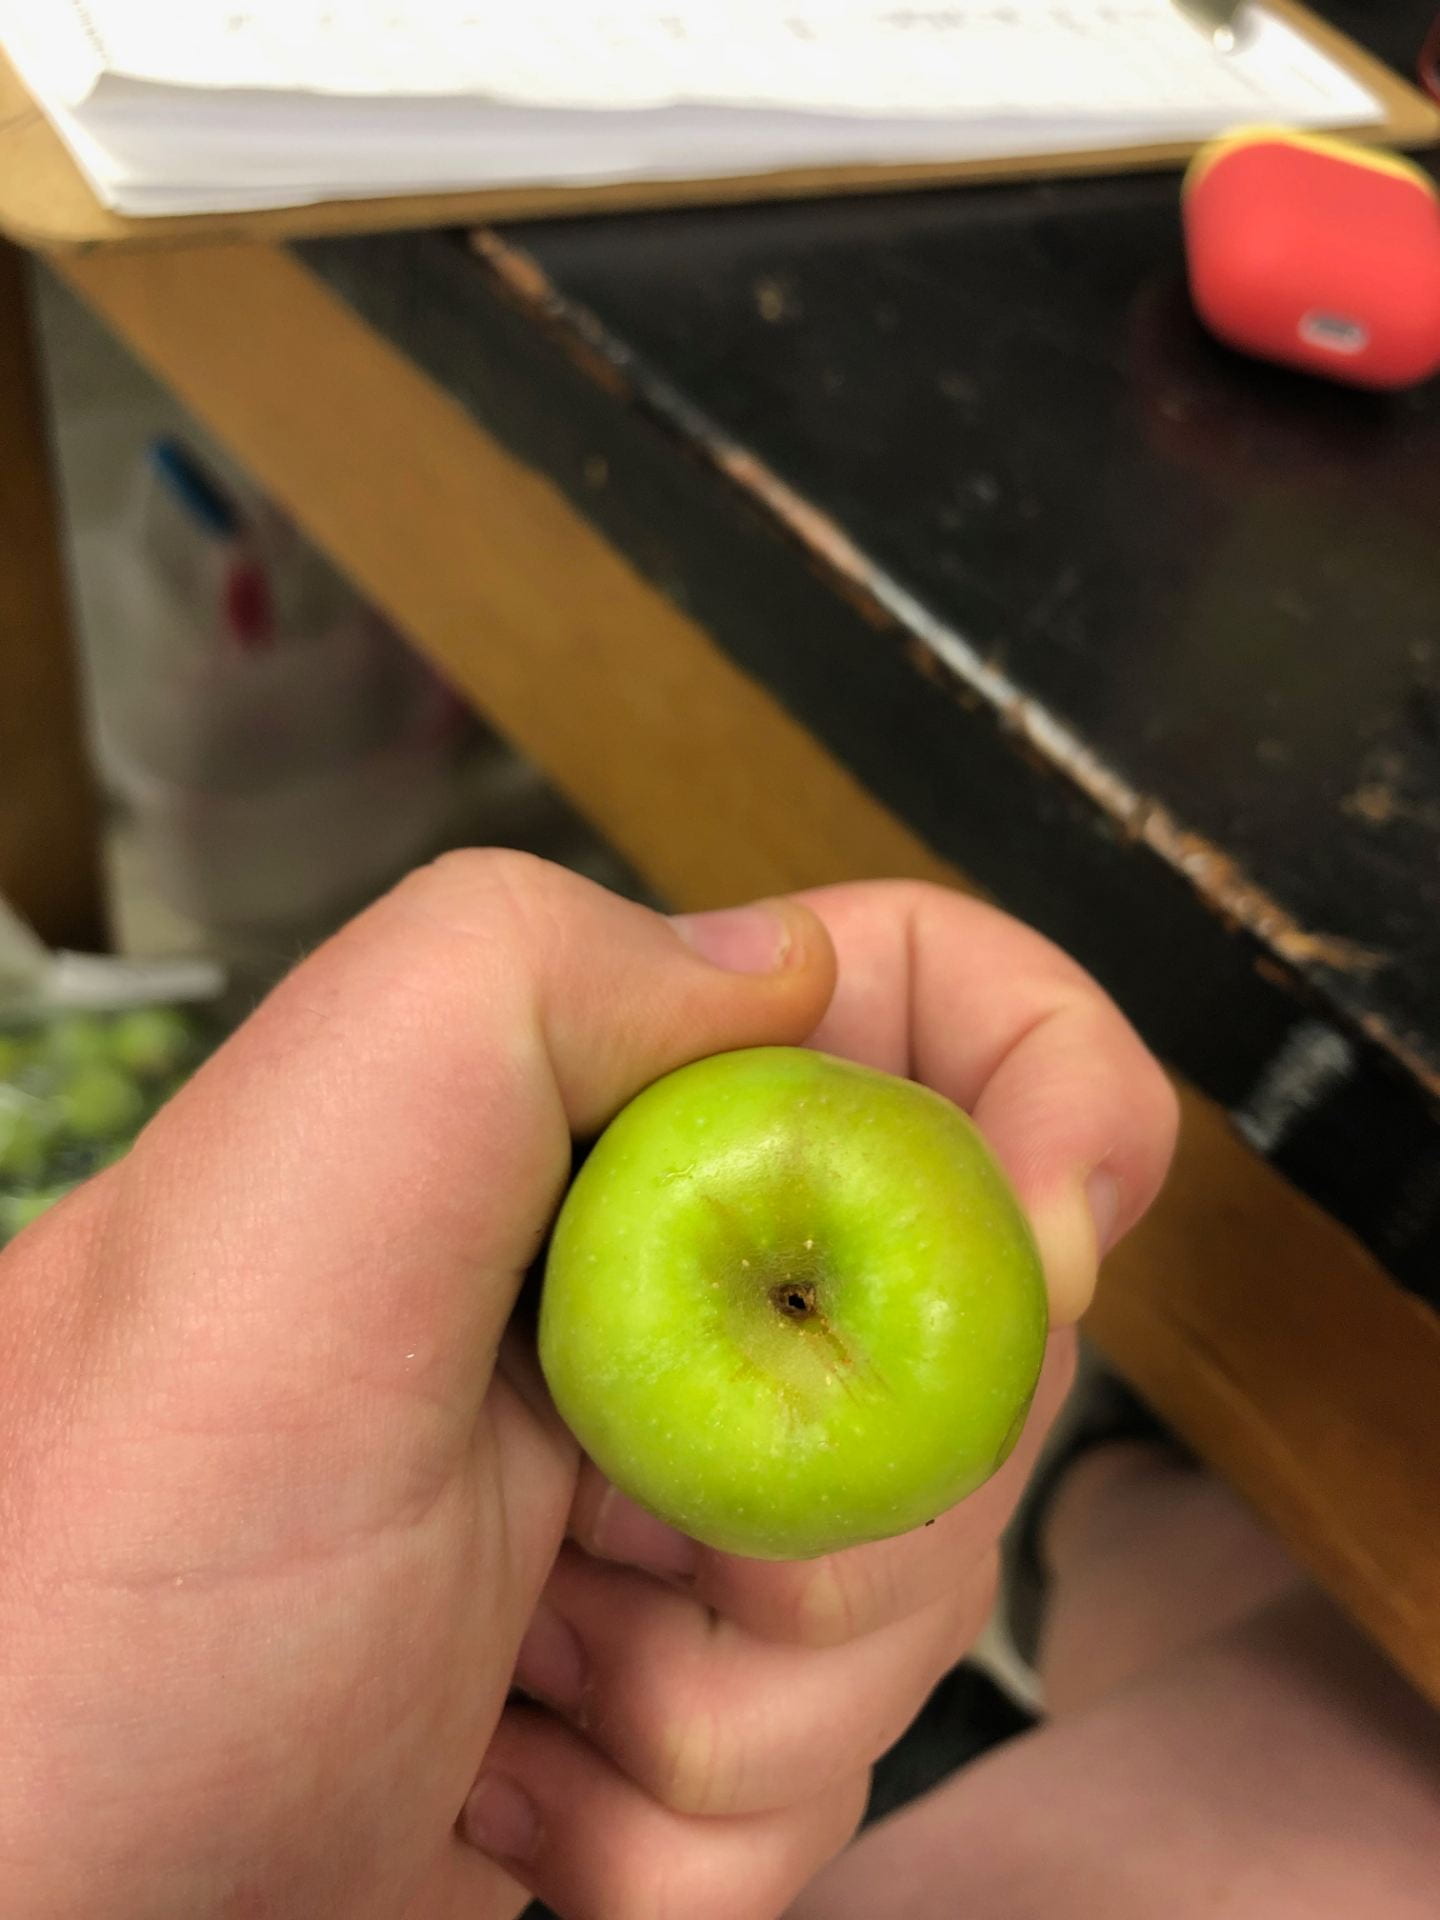
4.) This next task was pretty fun. I was helping work on a chemical thinning experiment and I had to take the sample apples and collect data on them. I had roughly seventy apples where I had to weigh them and take their diameter. Then, I had to cut each one open and count their viable seeds. I was given a very large knife, a very small knife, and an envelope opener to complete the task. I had fun! I have attached a picture below.

5.) One of the other fun things I got to do was paint our new baby trees! We have a new block of apples of roughly 1300 Premier Honey Crisp apples and 400 EverCrisp apples. They are painted white to protect from herbicide and sun scald. We used outdoor latex paint and painted them all in a day. In addition to this, all tenth trees are painted specific colors so when you are out there it is easier to know what tree you are on. For example, every tenth tree is yellow, but the 30th is painted red, 60th is blue, 90th is purple, and 120th is orange. Any tree that is out of the study due to illness or replacement is lime green. This was done in more than the new apple trees, but also in any block that needed it. Below is a not-so-great picture of the newly painted baby trees.

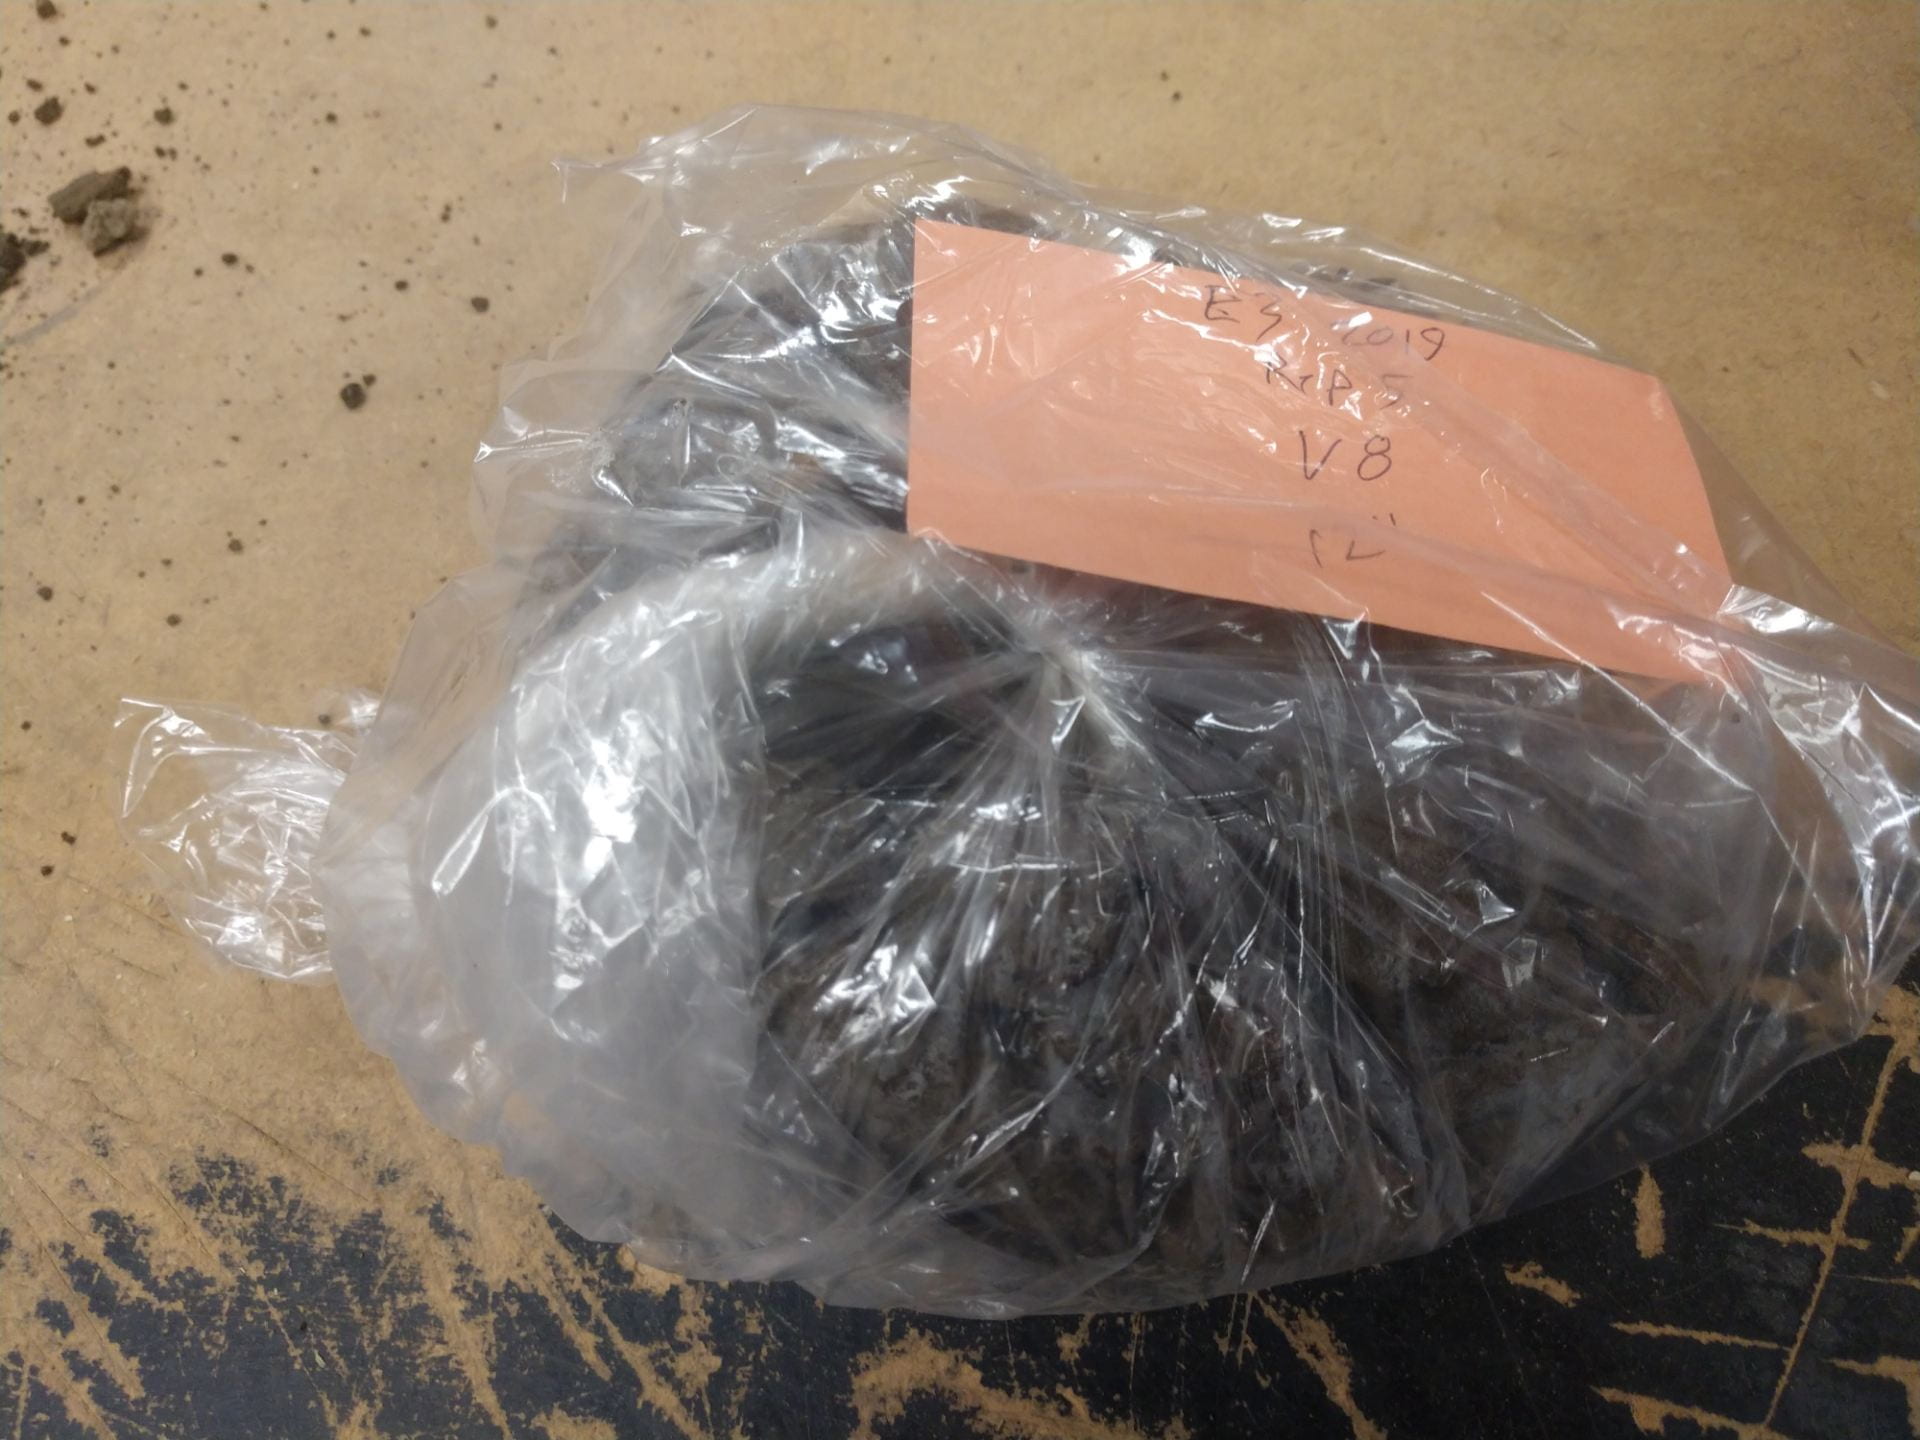
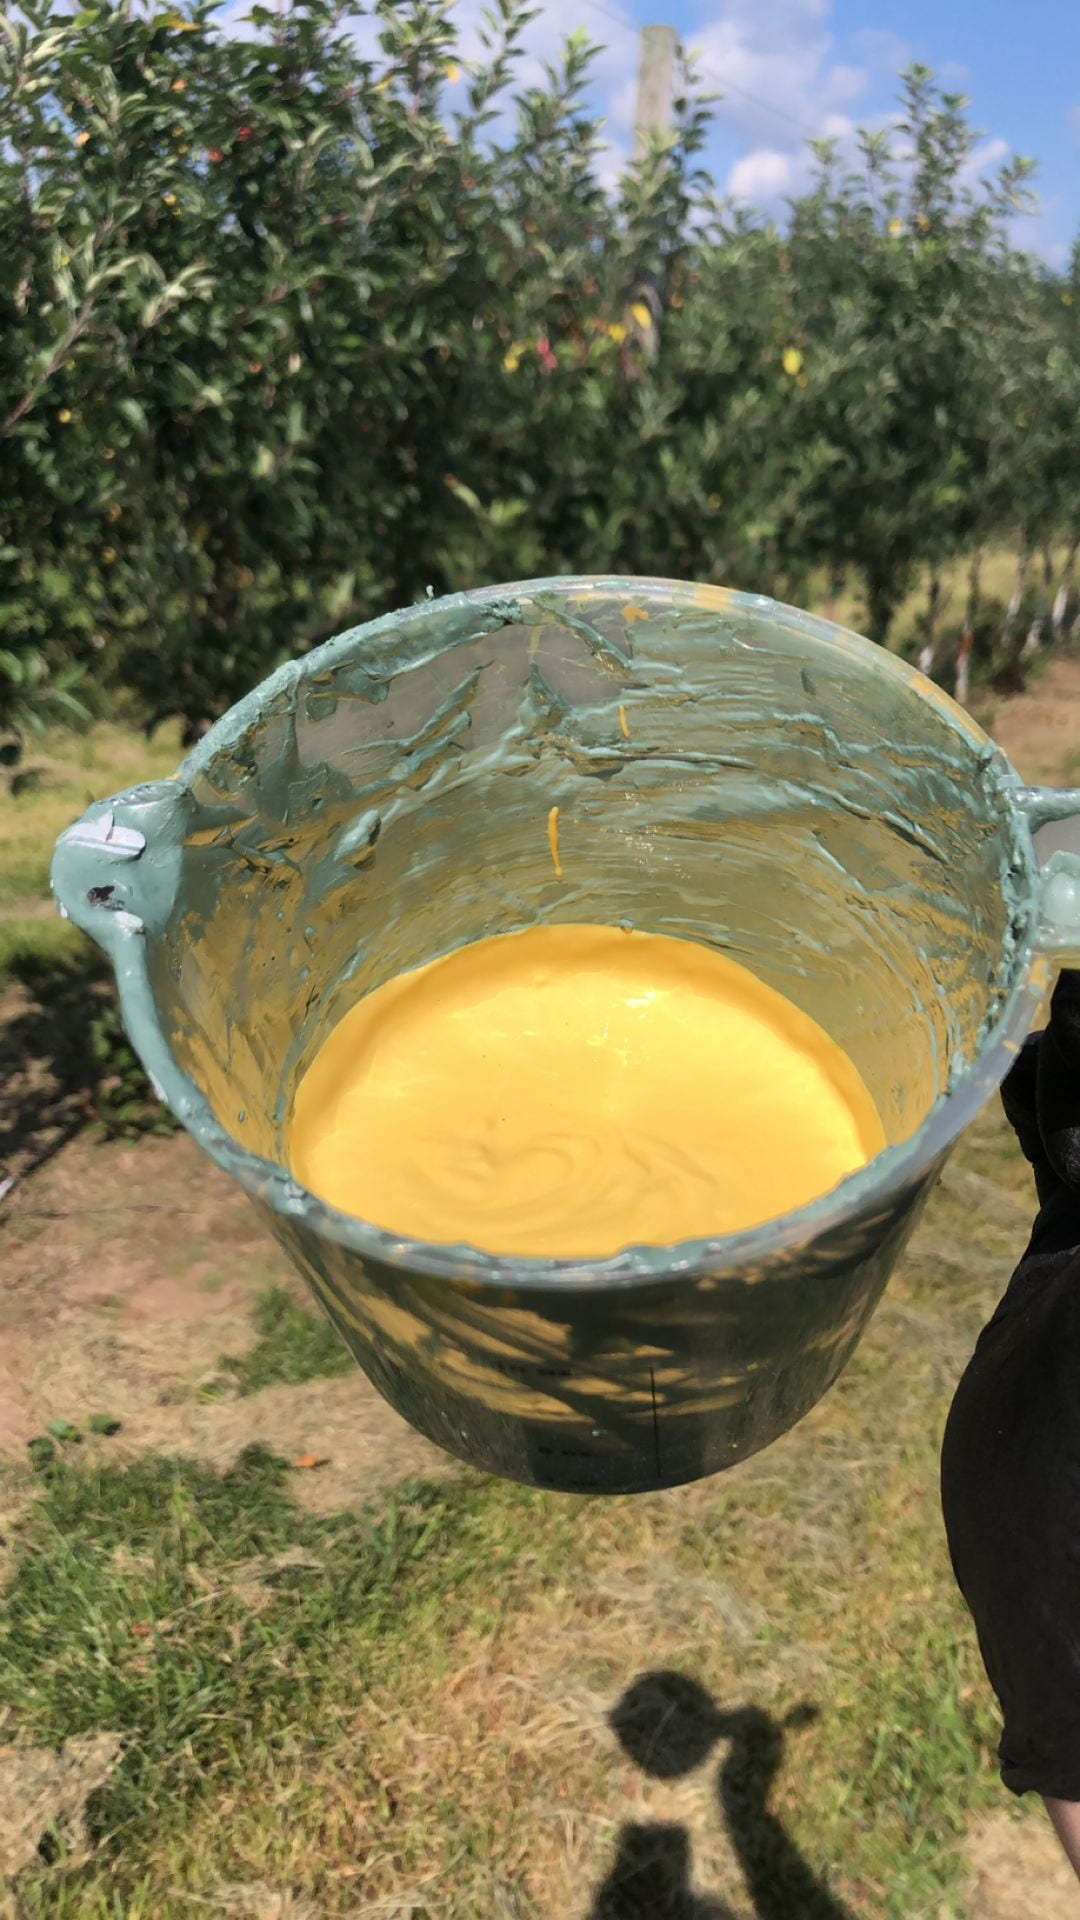
6.) The next job is repainting the graft union of top-worked treed with sealant. We have a few rows of trees that have been top-worked, meaning that they grew an apple tree normally, then decided they wanted them to be a different variety, but wanted a quick turn around. In order to do this, they cut off the tree where the scion joined the rootstock and grafted new healthy buds of a different variety there. to ensure they stay, they wrap it in grafting tape and come back later with an antibacterial sealant to ensure it stays. The sealant need reapplied about once a year, so this year Megan and I got the joy of reapplying it. The sealant had the color of Kraft mac and cheese, and an absolutely awful smell. Unfortunately technology has not advanced to allow you all to smell it, but I will post a picture of it below.

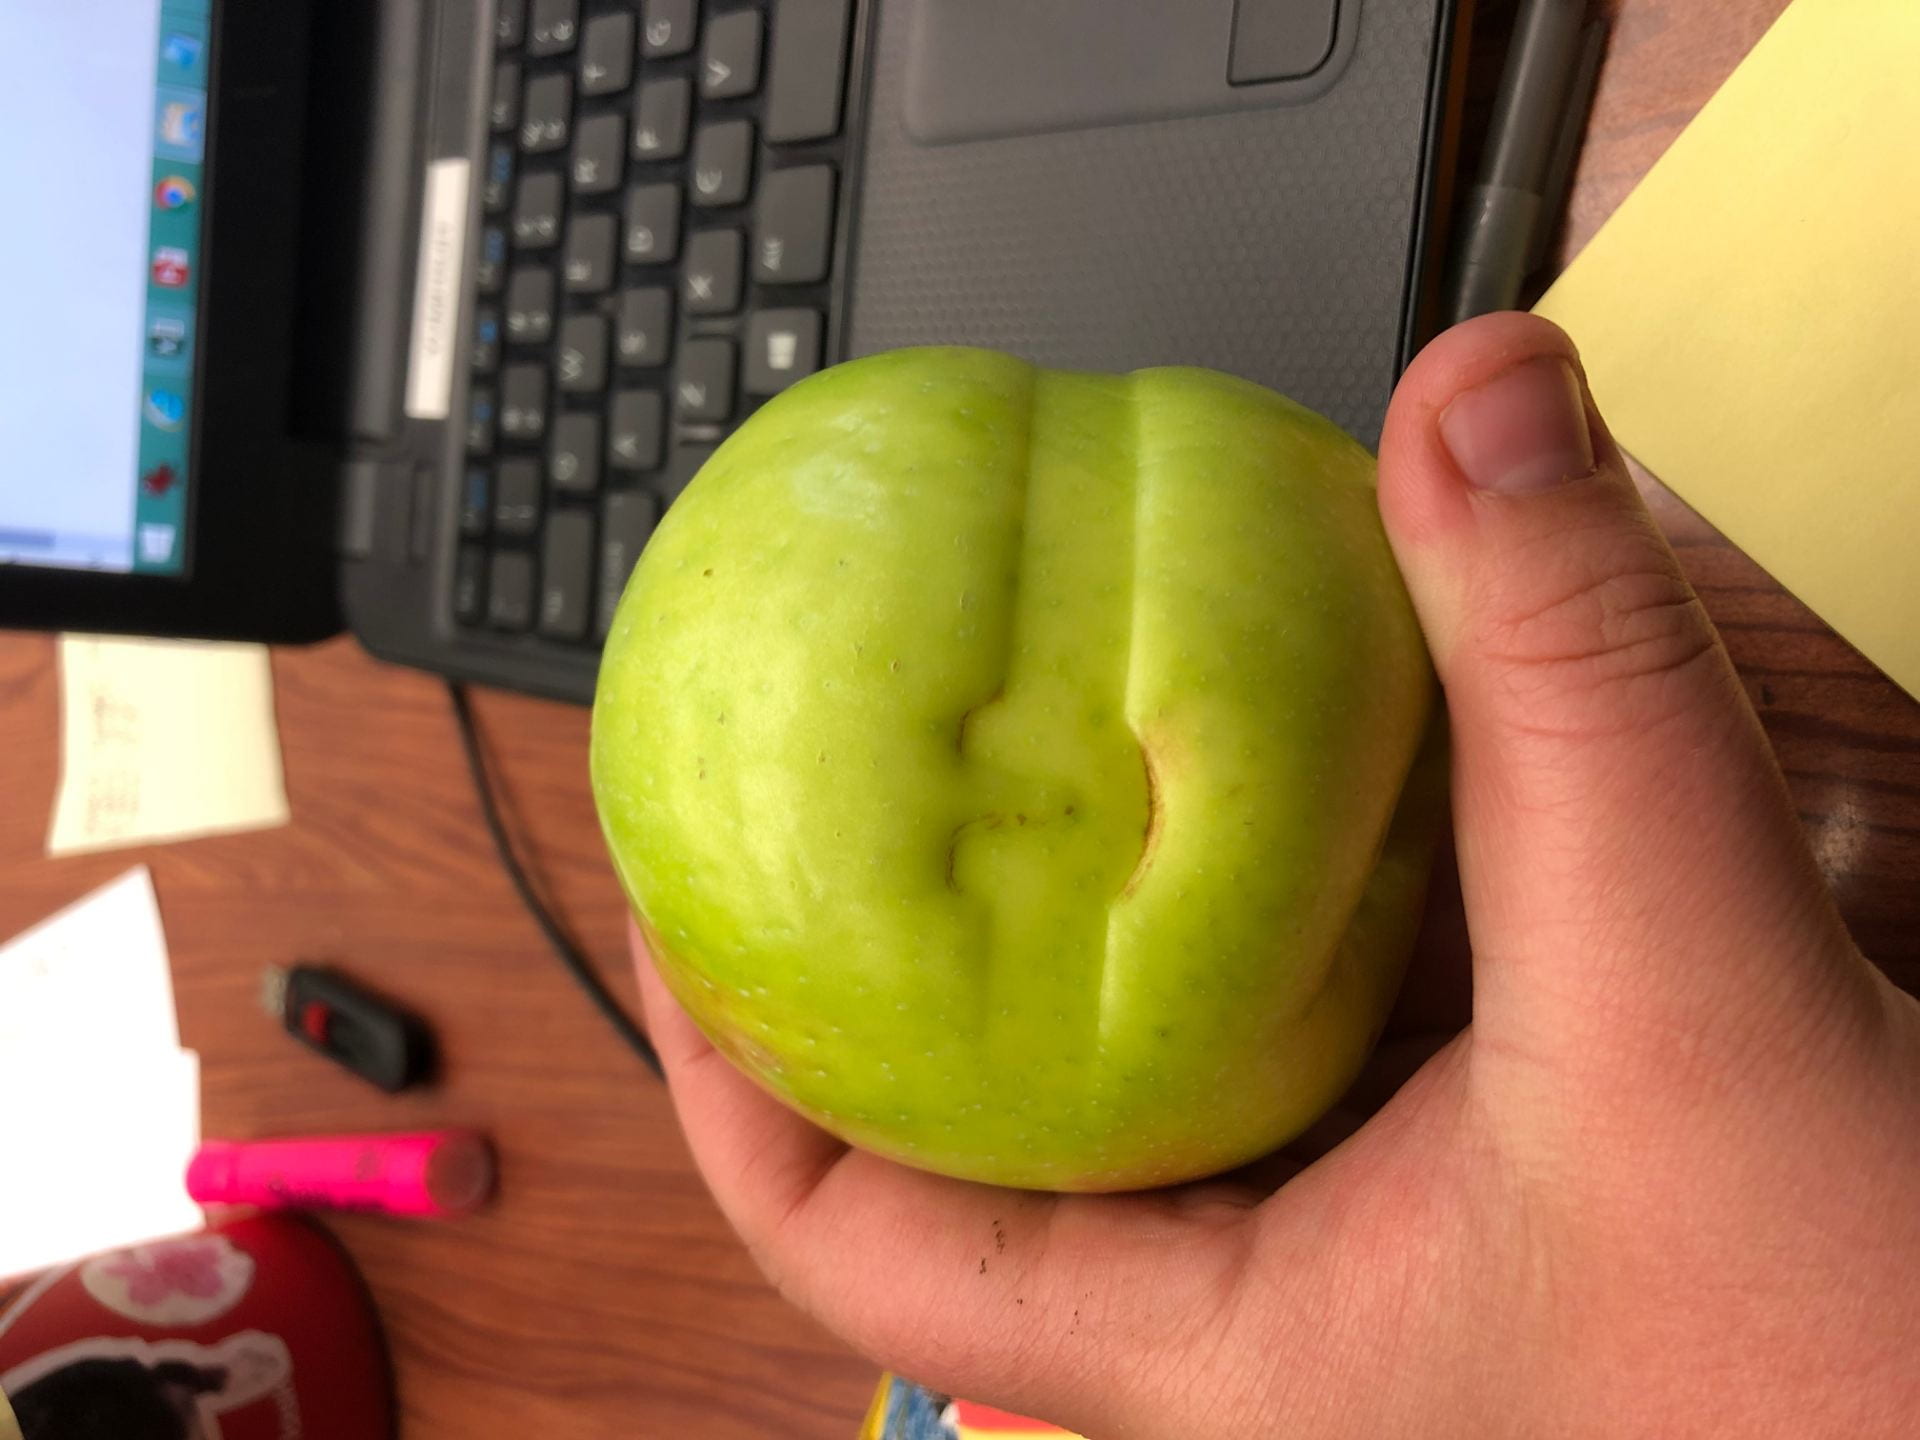
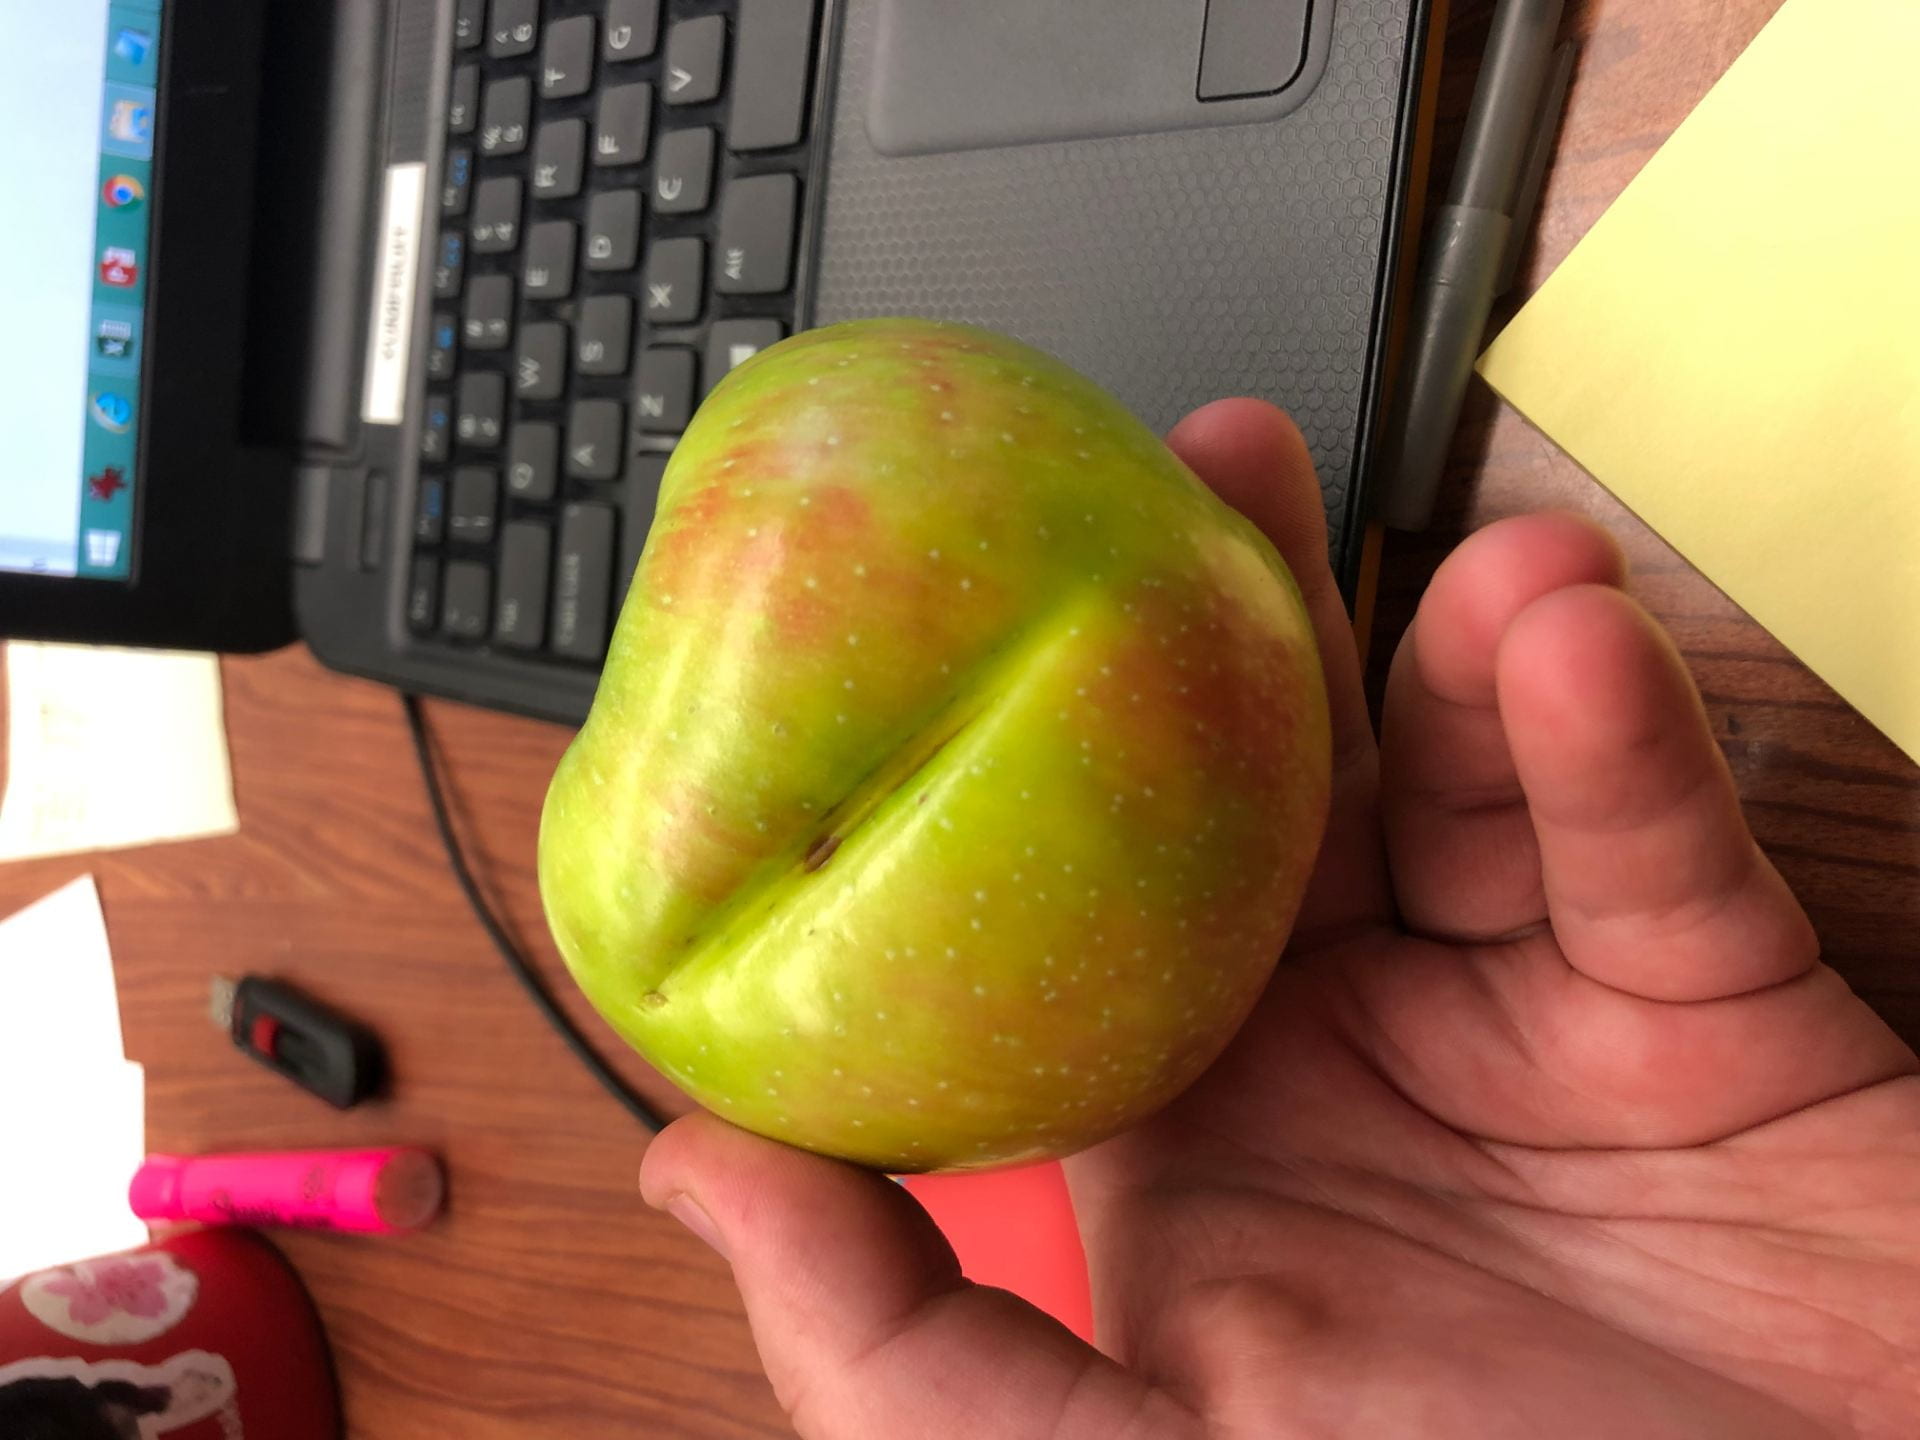
7.) Another task that we did a lot of was thinning apples and peaches. However, one experience really stuck out to me, which was thinning very large Honey Crisp apples. Because they were so large, you would pull one off to thin a cluster down from a triple to a double and all three of the apples would fall off. Pulling just one off without all of the rest coming with it was almost an art form. I did find this one apple that had seen all kinds of challenges, but still managed to grow. It had grown around the clip that held the tree to the wire, around the tree itself, and around the wire. I’ll put pictures below.


There are dozens of other tasks to keep the orchard in tip-top shape, but I won’t bore you with the details. In the next blog post, I am excited to write about some other experiments I helped with!

Week Six: Soil Sampling

This week I got to help out with some soil sampling in corn fields. NMSP is working with farmers to do trials on N-rich strips, which are sections of a field that are given so much pre-plant nitrogen that sidedressing is unlikely to be necessary. These plots help farmers to estimate how much nitrogen they need in certain areas and guess whether or not larger applications of nitrogen would make sense economically across certain management zones.

Field technicians use soil probes to take core samples from two soil depths, 8″ and 12″. The 8″ samples are used for general soil fertility tests, while the 12″ samples are tested in-house for soil nitrate levels. Although the 12″ cores can be very difficult to take in rocky soils, it’s important for researchers to know how much nitrate is present throughout the entire rooting zone.

Bagged soil sample

NMSP uses a double bagging method to keep soil samples secured and organized. The outer bag contains a small ID tag with replication and treatment info, along with the inner bag which contains the actual sample.

Soil samples in a dryer

The bags are opened up back in the lab, where the soil samples and ID tags are placed into individual cups for further processing. Soil cups are then loaded into the 50 °C dryer in order to remove most soil moisture. Processing wet soils would be very messy and lead to less reliable data.

Scouting Fun – Soil, Worms, Slugs, and Bugs

Scouting Fun – Soil, Worms, Slugs, and Bugs
July 8th

The last two weeks have cruised by! I have been busy learning more about the crop management process. The first step to addressing any problem is making a diagnosis! So, with some guidance, I have taken to the fields for some scouting to observe the corn’s progress and determine if any management strategies have to be tweaked.

Some of the things we were on the lookout for were physical damage to the corn, weed presence, overall size and appearance indicating health and nutrient availability, plant viruses/diseases, pest damage and which pests, and overall field conditions or anything that could affect the crop’s growth. While in the fields, we also took selective soil samples to measure how the weather had influenced nutrient availability and determine if additional fertilizer was needed.

I was able to find some interesting indicators in some fields.

Some signs of pests:

Deer damage to the top leaves was from a bite off the very tip of the young plant.

Slug damage was found in some fields near wooded, cooler, or wetter areas.


An interesting and more damaging pest than the smaller scale ones above; we had one instance of cutworm. The conditions and field history have to be exactly right for the cutworm to be an issue, so it was an interesting ailment to see.

As the name describes, the damage from the cutworm eats right through the main stem of the young plant, and cuts it in half.

Cutworm larvae


I also found some things that look like signs of pests but are deceiving! These cuts along the edge of the corn leaf look like very uniform bites but is in fact an instance of damage where the corn was growing too fast for the structures to keep up, resulting in damage.

Damage from rapid growth

Also, some random and isolated signs of virus that can actually be very aesthetically pleasing.

This virus gave the corn a vibrant yellow streaked appearance


And along the way taking soil samples for soil nutrient testing!

Soil sampling with a core

A 10-12 inch core is recommended for Nitrogen testing.


After looking at the field conditions, crop conditions, and the soil sample results, we will be able to manage the fields that need some extra attention. The one field with cutworm can be managed for pest control, and fields that result low in nutrients can receive some extra applications before the corn grows too tall. With these measurements and observations the farm can ensure they are doing all they can to achieve a productive yield.


Edgewood Farms, LLC Internship

Hello, my name is Bryce Schuster and I am a soon to be senior, studying agricultural science.  This summer I am completing my internship at Edgewood Farms, LLC in Groveland, New York.  Edgewood Farms is primarily a crop farm, but also operates a small feedlot, and is an authorized reseller of drainage tile, bunk covers and bags, fencing supplies and agricultural GPS systems.  The main crops grown are corn and soybeans, however they also grow wheat, green beans, kidney beans, and black beans.  The mission at Edgewood Farms, LLC is to provide quality products and service to their customers, while maintaining the integrity of the land, animals and environmental resources.  My duties this summer consist mostly of crop scouting, tissue sampling, and field agronomic problem-solving.

This spring and the beginning of summer have made farming difficult to say the least here in Western New York.  It has rained constantly and been cooler than normal until a couple of weeks ago.  When I started the internship at the end of May, corn planting was just getting under way.  This meant all hands-on deck to get fields prepped and seed in the ground.  Without any crops for me to scout this meant I also got the opportunity to assist with field work in equipment that is much larger than I am used to on my farm.

My first week on the job consisted of learning the names and location of over 200 fields, making up almost 4,000 acres, spread over 3 townships; and running a Case IH 9180 with a chisel plow to fill in ruts made by the farms sprayer that was applying pre-emerge herbicide.  Edgewood Farms has made the transition to an almost entirely strip tillage or no-till cropping system so it is rare to see conventional tillage performed, such as chisel plowing.  However, when last fall and this spring saw excessive rainfall, it is inevitable that a 35,000 lbs. sprayer with narrow tires is going to sink into the ground more than is ideal.  I also got the chance to use their 40-foot-wide roller to roll fields that are planted to beans, making the ground as flat as possible to optimize yield by allowing the combine header to be run closer to the ground without risking damage by picking up a rock.

Soil erosion on a conventionally tilled corn field.

Now that crops are finally starting to germinate and emerge, I can begin my scouting.  When the crops were still in the VE stage my main focus was on taking stand counts and checking for insect damage.  With all the moisture, one problem associated with strip or no-till cropping systems became apparent.  While the residue on the ground from last years crop is good for soil moisture retention in dry periods and weed suppression, it also creates a great environment for slugs.  I never knew slugs could do so much damage to crops and unfortunately it is not an easy problem to control.  Slug bait is extremely expensive so purchasing enough to treat every field is not practical.  The best way to end the problem is for things to dry out a little bit.  I am looking forward to how the summer progresses and what knew things I can learn!

Slug damage.

Week Five: NDVI for Nitrogen Management

This week was very exciting! I continued working with R and several yield cleaning projects, but also got to join Greg for a couple of rounds of field work. This meant getting to see two of NMSP’s drones complete NDVI scans of corn fields. NDVI scans are able to measure the vigor of plants in the field, either to estimate yield or to help farmers more accurately place sidedress fertilizer. The latter seems very interesting but also very challenging. NDVI works on a scale of 0 to 1, with 1 being very green and 0 being not green at all.

Quantix drone

Drones are the quickest way for farmers to accurately take NDVI readings over a full field.


The greener sections of the field are assumed to not be nitrogen deficient, and the less green sections are given extra nitrogen to address lower vigor. However, lower vigor could also be due to other factors like a wet spot in the field or a deficiency of nutrients other than nitrogen. As precision ag technology continues to evolve, it will be cool to see how companies and farmers address these issues. Looking for patterns in individual leaves is one solution, but it would require very high resolution cameras and advanced imagery technology. I will be excited to learn more about this quickly moving ag sector as the summer goes on!

The Pirate Apples

Hey y’all, welcome back to the blog. This week, I want to write about an experiment that Megan and I worked on together. This experiment is called “Apple Adjuvant Russet 2019”. It has been nicknamed “AAR19” or “The Pirate Apples”.

AAR19 is a chemical experiment that involves making 2 sprays of Captan 80WDG at first and second cover, with various adjuvants to evaluate chemical injury in fruit set and lead phytotoxicity. The experiment is set up in three tree plots, with eight treatments and five replicates. Megan and I had to pick 30 fruit from each plot all around the green from waist to top-of-hand height. Additionally, we had to pick 30 leaves from the mid shoots and 30 leaves from spurs in each plot as well.

From there, we evaluated the fruits and the leaves. First, we manually visually rated the russeting on the fruit. Megan and I both did this so that we weren’t just relying on one person’s rating. We used a numeric scale to represent a range in percentages of russet. For example, if the apple had 0-20% russet, it was given a rating of one, and so on and so forth. Below, I will attach a picture of what I would give a one. Secondly, we looked at the leaves to count how many had damage from the sprays. This was done by both Megan and Edwin, one of the main research assistants in the horticulture department.

After, we took photos of the AAR19 apples to run through the digital image analysis program that I described in my last blog post. We had to take three photos of each set of apples: the stem bowl, the most russeted side, and 180 degrees from the most russeted side. Below, I will insert a photo of the set up we use to take photos. Because each set of apples slightly varies from one another, the thresholds of what to consider russet in the code of the program needed to be adjusted. This was a meticulous job because the three values needed to be accurate down to the hundredth decimal place. It took Megan and I almost a whole afternoon to agree on the correct numbers.

After this, we ran the pictures through the program and came up with percentages for each photo. We then entered them into a data sheet and Edwin ran them through some statistics. We found that because the p-value was so high, there was no significant difference between the different treatments.

In my next blog post, I want to talk about all of the odds and ends jobs that Megan and I do to maintain the orchards. Some of them were quite disgusting, while others were actually kind of fun!

Week Four: Fertilizer Trials

With the improved weather over the weekend, we were able to get into the field and place some stakes for nitrogen fertilizer trials this week! I attached a picture of the stakes below. They will be used as a reference for field treatments along with GPS coordinates to be taken at a later date. To place stakes, Greg and I followed a map indicating where each plot was located in the field. Plots have randomized locations over several trials in order to avoid environmental impacts from certain field sections influencing the final results.

Fertilizer stake and label

Top: Plot or treatment number
Middle: Pre-plant nitrogen treatment in pounds per acre
Bottom: Sidedress nitrogen treatment in pounds per acre


The trial features rye terminated at several different stages along with different volumes of both pre-plant and sidedress nitrogen fertilizer. Cover crops like these are important because they can improve soil health and increase soil organic matter, both of which provide a ton of value to New York State farmers. It was really cool to see the corn poking out from under the rye stubble, especially considering the difficult planting and field work conditions that farmers have faced this year.

Sweet & Cheeky!

Hi y’all, welcome back to the blog. These last couple of weeks at FREC, my fellow summer research assistant, Megan, and I have been focusing mainly on our project given to us by Dr. Schupp.

Our project focuses directly on a new club variety of apple called Sweet Cheeks. They are a cross between Honey Crisp and Pink Lady apples. Unfortunately, it has a fruit finish issue, mainly with russetting. This project will study which general sector of the tree has the most russet and which side of the apple it is prominently featured on.

The trees we were given to use are top worked trees, which mean the were planted as one variety, in this case, Gala, and then they were cut off where the rootstock and the scion join. Then, scions of the new variety (this is where the Sweet Cheeks come in) are placed in notches in trunk that is still in the ground. The scions are secured and left to grow.

We were given 5 of these trees, which we then divided into 6 sectors using flagging tape. Fist we divided the tree horizontally, determining an upper and lower canopy. This line was placed equidistant between the second and third wire of the trellis system. Second, we divided the tree into outer and inner canopy by dividing the tree vertically into three sections, creating an outer north, inner, and outer south.  If you’re lost (don’t worry, I was), refer to the picture below. With these divisions, we created 6 sectors of the tree. These sectors are: upper outer north, upper inner, upper outer south, lower outer north, lower inner, and lower outer south.

After this, Megan and I counted all of the apples in each sector. Then, we went through and counted the apples with signs of russet. We also rated whether the russeting was “low”, “moderate”, or “severe”. Russet usually initially appears as small black dots around the sides of the apple, typically on the exposed side that receives the most sun.

From there, we determined percent russeted in each sector. Just from this, we noticed that apples in the upper canopy had more russet because of their increased exposure to sun.

Additionally, to quantify severity, we harvested around a dozen apples from the surrounding sweet cheeks trees of which we considered “low” severity and around a dozen of which we considered “moderate” severity. We then took pictures of them and ran through a digital image analysis program that gives us a percentage of russet on the apple. To do this, one of the researchers there, Edwin, built a photo box using PVC pipe, poster board, and lamps. It has boards and pipes at the top, which can hold a camera that is used to capture the images. All you have to do is slide the apples in on the apple tray covered in blue fabric and click the capture button. I will insert a photo of the photo box. It is a picture taken from above because I was the one adjusting the camera.

We will survey the Sweet Cheeks again in August and at harvest time to determine whether the russet is early or late onset.

Next week, I hope to delve deeper into the other research projects that Dr. Schupp is working on and share with you how much I have learned!

Week Three: Extension and Communication

This week, several technicians from a NYS digital agriculture company came in for a yield cleaning training session. This was the first time that I have had a major role in a training session so I was a bit nervous. Using Yield Editor, I walked one technician through the initial settings selection process. There are 4 distinct settings used by Yield Editor to clean harvest maps. Flow delay (as pictured above) is caused by the gap in time between the actual harvest of the crop and the moment when the crop is massed by a sensor. Moisture delay is caused by a similar issue, and is especially important when cleaning silage data (as the moisture of silage is significantly higher and more variable than corn grain moisture). Start Pass Delay and End Pass Delay are both caused by the slowing down and speeding up of the harvester at the edge of the field, which often leads to unreliable yield data.

This is an image pulled from a PowerPoint presentation that I created to help farm consultants learn the data cleaning process. As more and more farms in New York State get yield monitors on their corn harvesters, it will become increasingly important for consultants to feel confident working with that data.

This is an image pulled from a PowerPoint presentation that I created to help farm consultants learn the data cleaning process. As more and more farms in New York State get yield monitors on their corn harvesters, it will become increasingly important for consultants to feel confident working with that data.


By using both the Automated Yield Cleaning Expert (a Yield Editor feature that estimates the proper delay settings) and a more guess-and-check method, yield cleaning technicians are able to determine the proper initial settings after manually examining only 10 fields from each farm annually. After finding the proper settings for the farm, technicians are able to use low-level programming to automatically clean the harvest data from the remaining fields. This saves farmers a lot of time working with data and still provides the high level of accuracy needed for yield estimation.

Week Two: Intro to R

This week, I spent a couple of days working with Dilip to learn the process for creating farm reports from yield data sets. This is the way that NMSP shows farmers what the program does with donated harvest data and makes it easier to understand the impact of the data cleaning process. Using RStudio (pictured below) and the R programming language, I am now able to take cleaned yield data files from Yield Editor and quickly create graphs that illustrate which parts of the field contained the best data and which sections had to be removed (commonly called headlands). The reports also contain several interesting pieces of analysis. The average yield for each soil type in each field is listed on one page, with the average yield for each soil type across the whole farm listed later in the report. This information helps farmers to better understand why certain fields are high yielding and other fields continually underperform compared to the whole farm average.

Example of R code

This is an example of R code. I also went to a free R coding workshop put on by the Cornell Statistical Consulting Unit this week which was very helpful. There are a lot of good resources to start learning R, but practice is key!

Skip to toolbar