Hey y’all, welcome back to the blog. This week, I want to write about an experiment that Megan and I worked on together. This experiment is called “Apple Adjuvant Russet 2019”. It has been nicknamed “AAR19” or “The Pirate Apples”.
AAR19 is a chemical experiment that involves making 2 sprays of Captan 80WDG at first and second cover, with various adjuvants to evaluate chemical injury in fruit set and lead phytotoxicity. The experiment is set up in three tree plots, with eight treatments and five replicates. Megan and I had to pick 30 fruit from each plot all around the green from waist to top-of-hand height. Additionally, we had to pick 30 leaves from the mid shoots and 30 leaves from spurs in each plot as well.
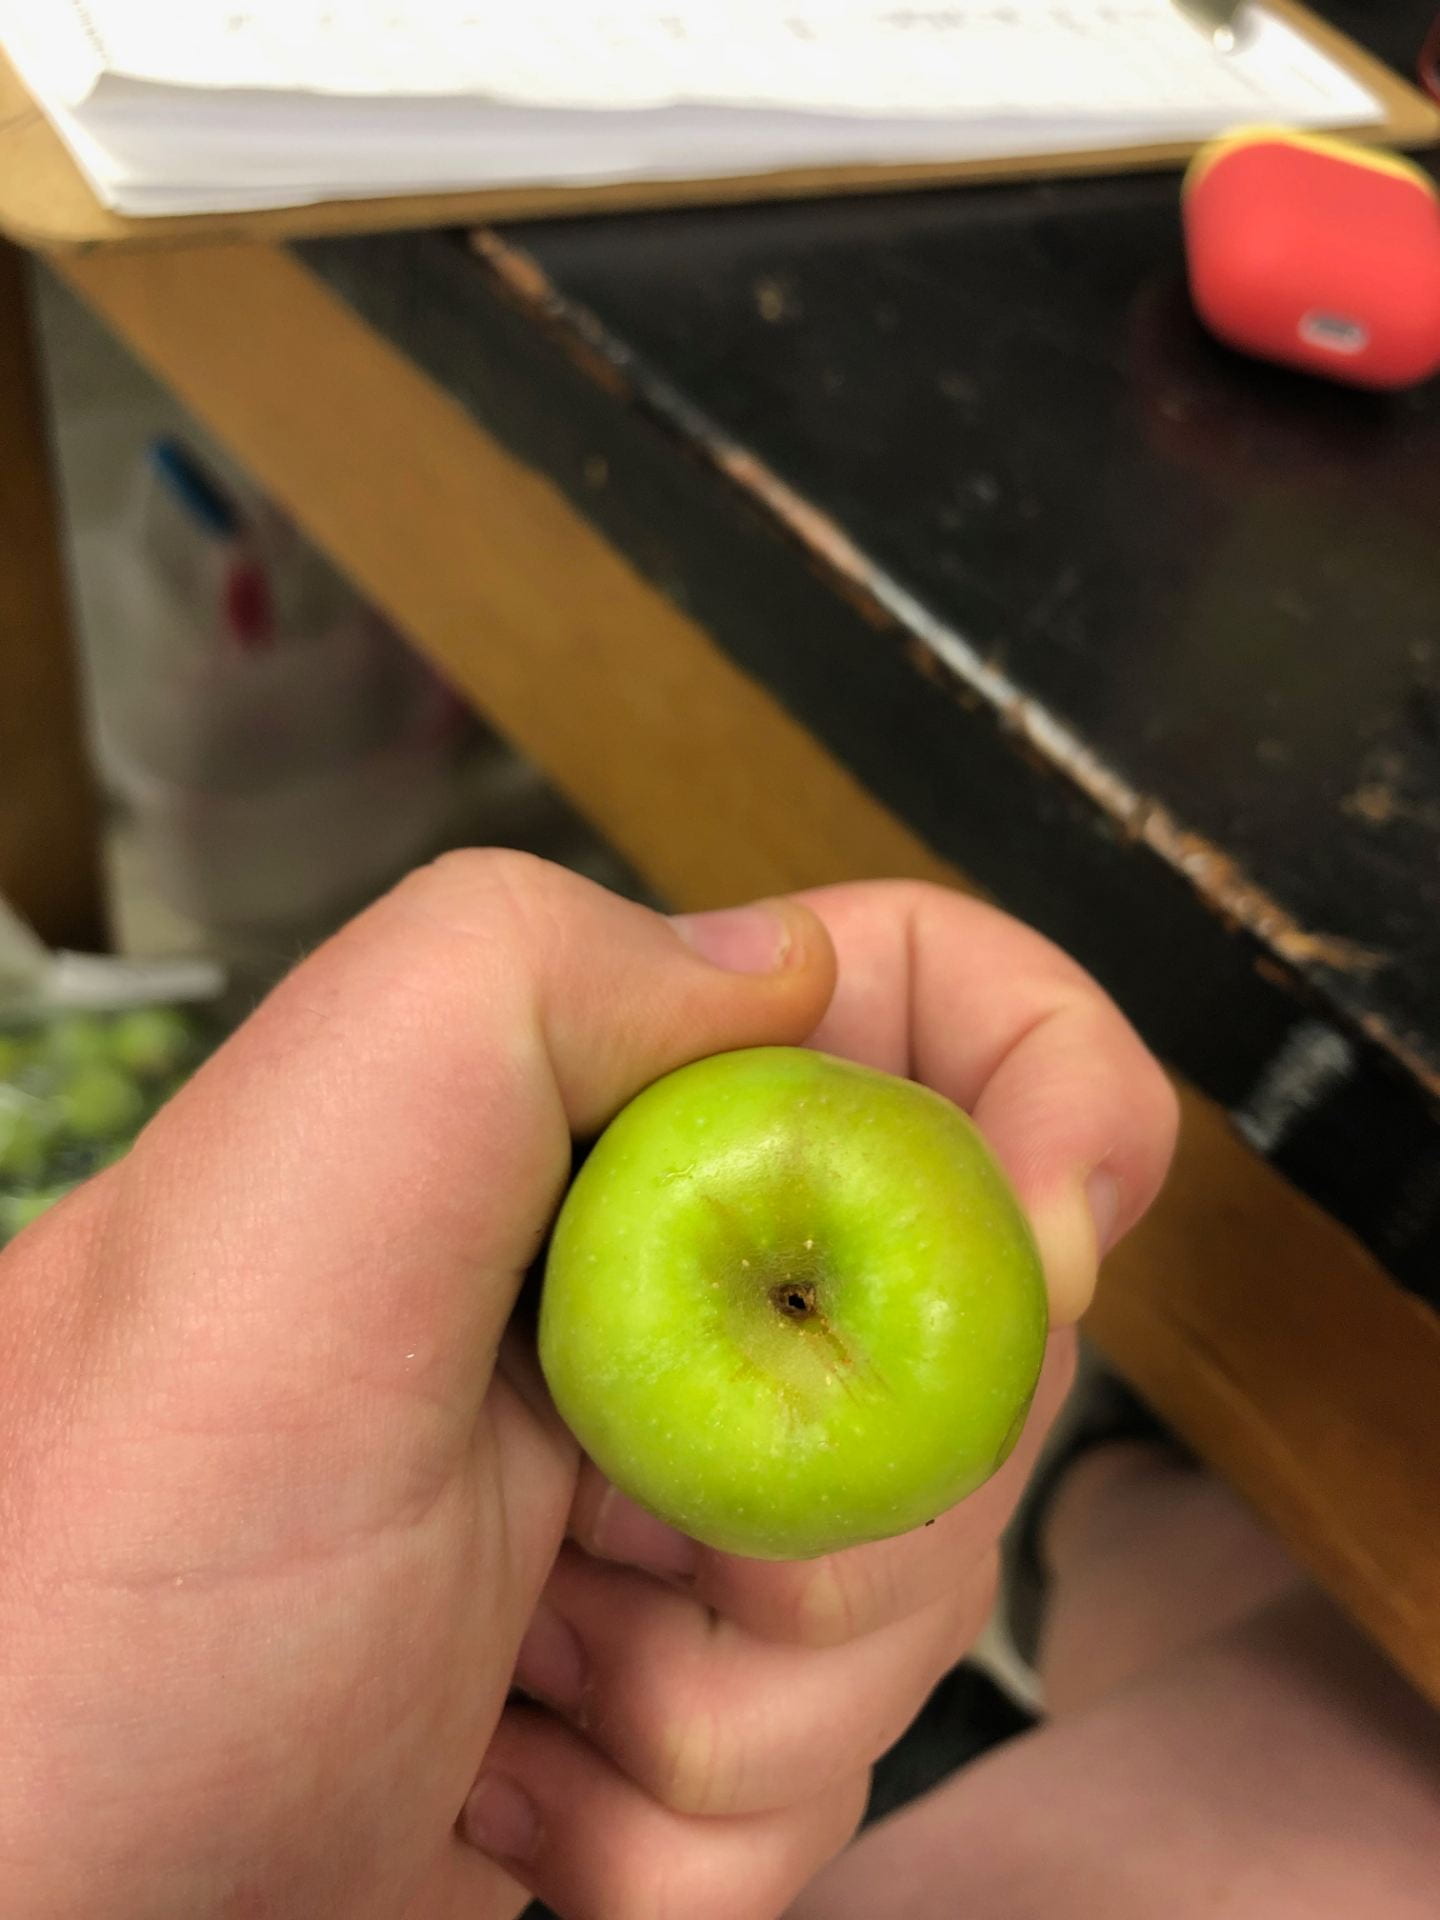
From there, we evaluated the fruits and the leaves. First, we manually visually rated the russeting on the fruit. Megan and I both did this so that we weren’t just relying on one person’s rating. We used a numeric scale to represent a range in percentages of russet. For example, if the apple had 0-20% russet, it was given a rating of one, and so on and so forth. Below, I will attach a picture of what I would give a one. Secondly, we looked at the leaves to count how many had damage from the sprays. This was done by both Megan and Edwin, one of the main research assistants in the horticulture department.
After, we took photos of the AAR19 apples to run through the digital image analysis program that I described in my last blog post. We had to take three photos of each set of apples: the stem bowl, the most russeted side, and 180 degrees from the most russeted side. Below, I will insert a photo of the set up we use to take photos. Because each set of apples slightly varies from one another, the thresholds of what to consider russet in the code of the program needed to be adjusted. This was a meticulous job because the three values needed to be accurate down to the hundredth decimal place. It took Megan and I almost a whole afternoon to agree on the correct numbers.

After this, we ran the pictures through the program and came up with percentages for each photo. We then entered them into a data sheet and Edwin ran them through some statistics. We found that because the p-value was so high, there was no significant difference between the different treatments.
In my next blog post, I want to talk about all of the odds and ends jobs that Megan and I do to maintain the orchards. Some of them were quite disgusting, while others were actually kind of fun!