This week, I spent a couple of days working with Dilip to learn the process for creating farm reports from yield data sets. This is the way that NMSP shows farmers what the program does with donated harvest data and makes it easier to understand the impact of the data cleaning process. Using RStudio (pictured below) and the R programming language, I am now able to take cleaned yield data files from Yield Editor and quickly create graphs that illustrate which parts of the field contained the best data and which sections had to be removed (commonly called headlands). The reports also contain several interesting pieces of analysis. The average yield for each soil type in each field is listed on one page, with the average yield for each soil type across the whole farm listed later in the report. This information helps farmers to better understand why certain fields are high yielding and other fields continually underperform compared to the whole farm average.
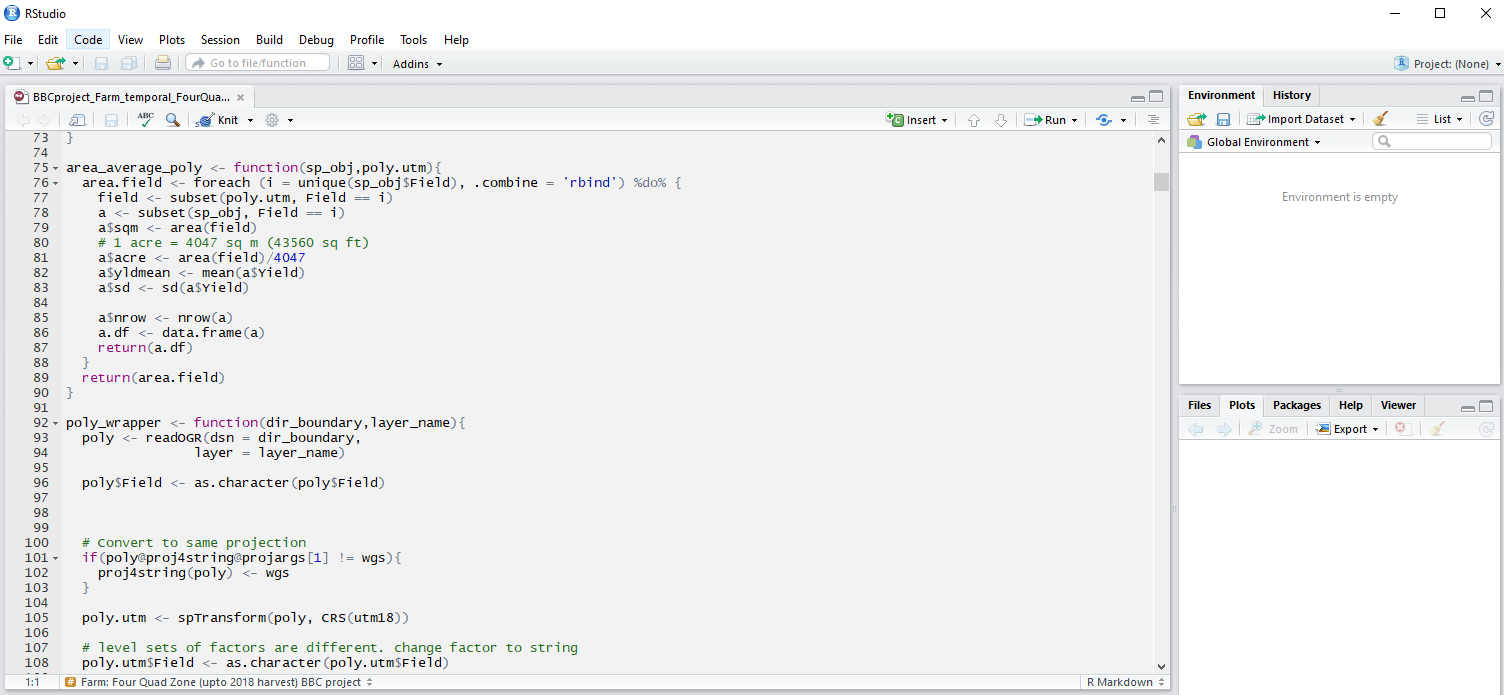
This is an example of R code. I also went to a free R coding workshop put on by the Cornell Statistical Consulting Unit this week which was very helpful. There are a lot of good resources to start learning R, but practice is key!