Increase Yield Monitor Data Accuracy and Reduce Time Involved in Data Cleaning

Sheryl Swink1, Tulsi Kharel1, Dilip Kharel1, Angel Maresma1, Erick Haas2, Ron Porter2, Karl Czymmek1,2, and Quirine Ketterings1
1Cornell Nutrient Management Spear Program, 2Cazenovia Equipment Company, 3PRODAIRY

Introduction

Reliable yield maps allow farmers and farm consultants to analyze yields per field, within fields, across fields and across years. Yield maps can be used to develop yield stability zones, or to identify reason(s) for low/high yielding areas by overlaying them with other geospatially tagged data such as elevation maps, soil series maps, etc. For reliable data, pre-harvest calibration of yield monitors and sensors should be followed up by careful operation in the field and proper post-harvest data cleaning in the office (Figure 1). This article presents best practices (pre-harvest, in-field, and post-harvest) that minimize yield monitor data errors and noise, reduce loss of data, and speed up data cleaning.

Pre-Harvest

  1. Field naming. Develop a simple and consistent set of field IDs or names for each farm. Make sure all operators know and use the correct field identification. Using numbers eliminates spelling errors. Inconsistency in a field’s name from year to year results in extra, time consuming, post-harvest data clean-up.
  2. Field boundaries. Establish and load geo-spatially fixed/frozen field boundary files into the Yield Monitor prior to harvesting. This will assist in maintaining the accuracy of field IDs. Preloading fixed field boundaries facilitates assignment of harvest data to the correct fields as the harvester moves from field to field. Follow the procedures in your Yield Monitor manual to load boundary files before harvest begins.
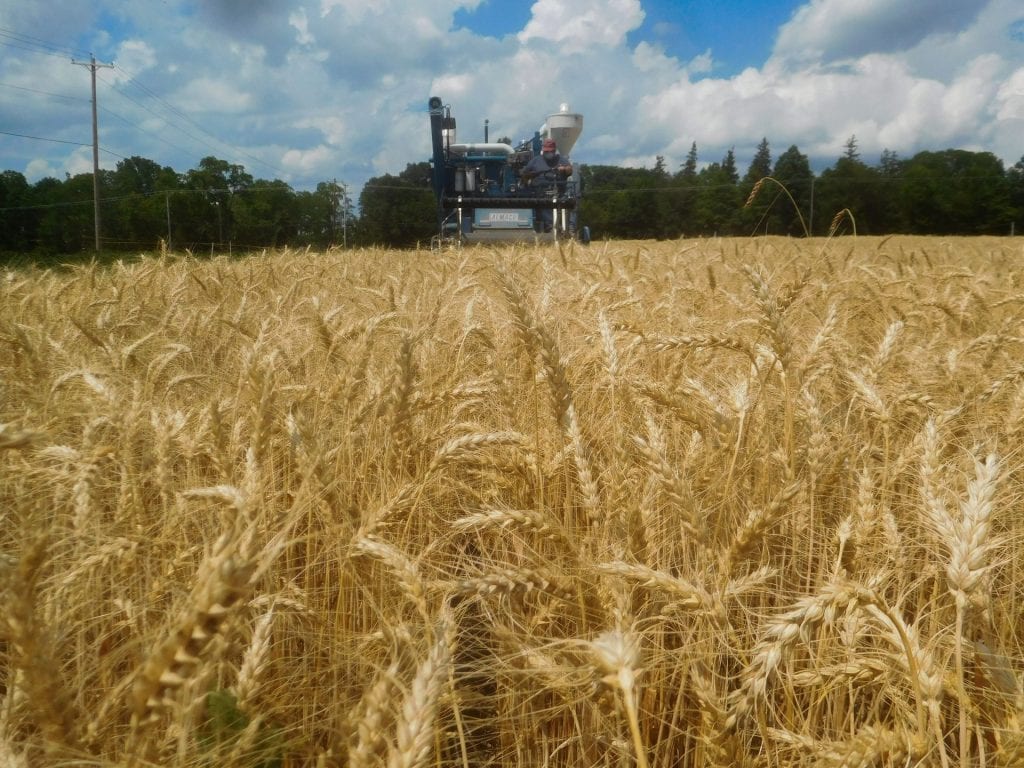
Figure 1: Valuable data can be obtained when yield monitors are calibrated and yield data are properly cleaned. For instructions on corn silage and grain yield monitor data cleaning, see: http://nmsp.cals.cornell.edu/publications/extension/ProtocolYieldMonitorDataProcessing2_8_2018.pdf.

In-Field

  1. Calibrate. Calibration using accurate scale weights or a grain cart with load sensors will increase accuracy. When calibrating, harvest as you would normally do in average crop areas in the field (include variability in the field, not just the best part). Re-calibrate the yield monitor often – for each crop or even variety that is being harvested, and for significant changes in crop conditions (very dry to very wet). Check and zero the mass flow sensor every morning so that the sensor identifies crop flow accurately. Clean the lens of the moisture sensor and inspect for damage daily.
  2. Field name/ID. Check to be sure correct field name/ID is entered or displayed before harvester enters a new field. Avoid inventing field names “on the fly.” Carefully check spelling if manually entering a field ID while harvesting. Misspelled or variations in field names from season to season make it difficult to match field data files across years for yield comparisons and within-field variability analysis. Proper field naming will ensure that yield data are assigned to correct field files.
  3. Harvest speed. Maintain a steady harvest speed within the calibration range for your system. Yield data recorded outside of the calibration range will be less accurate (irregular and/or very slow or high velocities over parts of the field result in yield calculations errors).
  4. Header height. Be sure the monitor logs a start and stop for each directional pass across the field to ensure data and yield area are logged properly. In most cases, the operator must lift the header beyond a set height to trigger the “stop logging” signal when exiting a pass or turning in the field. For some equipment, material flow can also be used to log the end of passes when the header is not raised for turning or for driving in the field without harvesting. Correctly logged field passes expedite trimming of unrepresentative start and end pass data points (ramping effect) during the cleaning process and proper shifting of data when correcting for flow and/or moisture delays relative to GPS location.
  5. Swath width. Be sure the recorded swath width is the actual width harvested. If swath width is not recorded properly, the harvested area calculated is wrong and so is the yield value. If the GPS system of the yield monitor has a large positional error (e.g. WAAS), turn off the auto swath adjustment and manually enter the default swath/chopper width. When harvesting less than the default chopper width without auto-swath, manually adjust swath width of the pass in the yield monitor to avoid erroneous yield calculations.
  6. Short rows. For long, narrow fields, plant and harvest rows the length of the field rather than the width if practical and consistent with soil conservation and other farm objectives. Short harvest passes distort yield data due to ramping velocity and flow impacts at the beginning and end of a pass, leaving few or no accurate data points in very short passes.
  7. Multiple combines/choppers in the field. If using more than one combine or chopper on a field, harvest a discrete section of the field with each one rather than mixing their passes across the whole field. Differences between operators, equipment and sensors result in different flow and moisture delays. These factors, if interlaced across the field, make it difficult to properly clean data.

Post-Harvest

Do not risk losing the season’s data by just leaving it on your monitor or relying on the cloud to save it. Download the raw yield monitor data files periodically during the season. The data cleaning protocol requires raw data to be transferred into Ag Leader format. Save the original files, backing them up on thumb drives and on your computer.

In Summary

Reliable data are essential for making the right decisions in field management. Mitigating errors at the source reduces the amount of data loss when filtering out noise during the post-harvest data cleaning process. The accuracy of yield data depends not only on proper calibration of yield monitoring equipment prior to and during harvest, but also on operation in the field and post-harvest data cleaning. Data become more reliable and the data cleaning process can be accelerated with implementation of the pre-harvest, in-field, and post-harvest practices described in this article.

Acknowledgements

This work was co-sponsored by the United States Department of Agriculture, National Institute of Food and Agriculture, Agriculture and Food Research Initiative Bioenergy, Natural Resources and Environment program, grants from the Northern New York Agricultural Development Program (NNYADP), New York Farm Viability Institute, New York Corn Growers Association, and Federal Formula Funds. For questions about these results, contact Quirine M. Ketterings at 607-255-3061 or qmk2@cornell.edu, and/or visit the Cornell Nutrient Management Spear Program website at: http://nmsp.cals.cornell.edu/.

Print Friendly, PDF & Email

What’s Cropping Up? Volume 28, Number 5 – November/December 2018

High Seeding Rates, Fall Herbicide Application, Split-Application of N, and a Timely Fungicide Application Did Not Increase Spike Number, Kernels/Spike, Kernel Weight, nor Yield in 2018 Conventional Wheat

by Bill Cox, Eric Sandsted, Phil Atkins, and Wes Baum

High input conventional wheat did not increase spike number, kernels/spike, kernel weight, and yield in 2018.

High input wheat, which is characterized by high seeding rates, a herbicide application in the fall, split-application of N in the spring (resulting in higher total N rates), and a timely spring fungicide application(s) was introduced to New York in the early 1980s. Known as intensive management of wheat in the 1980s, it was modeled after European wheat management systems, where yields were often twice that of NY wheat yields. Consultants or farmers from other countries or regions came to NY to share with NY farmers and industry personnel on how they grew wheat. Wheat prices in NY, however, plummeted to $2.80/bushel in 1985 and $2.25/bushel in 1986, which abruptly ended the push for adoption of intensive management of wheat in NY in the 1980s.

Wheat prices in NY still hovered around ~$2.80/bushel in the early 2000s and intensive or high input wheat management hadn’t been mentioned in years.  Prices, however, skyrocketed to more than $6.50/bushel from 2007-2013, resulting in a resurrection of the promotion of high input wheat management. Indeed, some individuals in the NY wheat community referred to high input management as the “new way” of managing wheat. Once again, experts from Canada, England, or Michigan came to New York to instruct us on how to grow wheat. Our research from the 1980s, which included three varieties at two planting dates, reported that wheat yields were increased (10-15%) in 3 years but limited in response (2-5%) in 2 other years. More importantly, we found that intensive management of wheat did not pencil out unless prices exceeded ~$3.75/bushel, high prices back in the 1980s. Regardless, this research was totally ignored by industry and extension personnel in NY in their rush to embrace this “new way of managing wheat”.

We compared high input and recommended input management in conventional (and organic) wheat at the Aurora Research Farm in 2016, a year characterized by very dry conditions from April through June (4.61 inches total precipitation). We reported that there was no response to high input wheat in that very dry growing season https://blogs.cornell.edu/whatscroppingup/2016/09/26/organic-wheat-looked-great-but-yielded-7-5-less-than-conventional-wheat-in-20152016/). We also reported that weed densities were generally low negating a response to fall herbicide application, that the extra N applied to high input wheat did not increase spike number nor kernel number/spike, and that the fungicide application did not increase kernel weight (https://blogs.cornell.edu/whatscroppingup/2016/09/29/wheat-does-not-respond-to-high-inputs-at-the-aurora-research-farm-in-the-dry-2016-growing-season/). We attributed the lack of response to high input wheat in that year to the very dry growing conditions.

We repeated the study again this year and provided a detailed description of the inputs and their timing in high input and recommended input wheat management in a previous 2018 article (https://blogs.cornell.edu/whatscroppingup/2018/07/23/another-shocker-organic-wheat-with-high-inputs-86-buacre-vs-79-buacre-for-conventional-wheat-both-yield-80-bushelsacre-with-recommended-inputs/).  Briefly, high input wheat was seeded at 1.7M seeds/acre in late September, received an herbicide application (Harmony extra) in late October, a split-application of N in the spring (~50 lbs. /acre of actual N in late March and another ~50 lbs. /acre of actual N in late April), and a timely fungicide application (Prosaro) at the end of May at anthesis. In contrast, recommended input wheat was seeded at 1.2M seeds/acre and received a single 70 lb. /acre N application in late March. That was it-essentially a plant, top-dress, and harvest management system.

We sub-sampled 1.52 m2 areas (8 rows by 1 meter) in two locations of all wheat plots to determine yield components of all treatments on July 8, the day before harvest. The sub-samples were first weighed, and then the spikes were counted. The spikes were then threshed so all the kernels (~20,000 kernels/sample) could be counted with a seed counter before being weighed. From the sub-sample data, we determined the number of spikes/m2 and kernels/spike, as well as individual kernel weight of all the treatments.

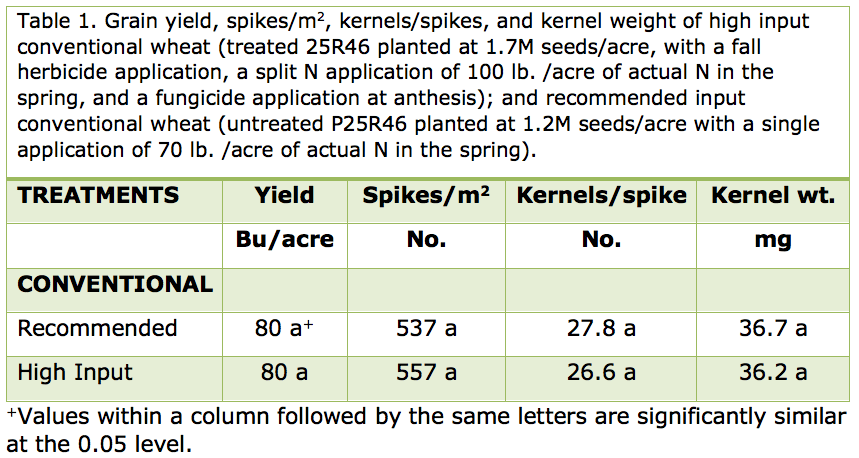
We reported in the above-cited 2018 article that once again there was no response to high input conventional wheat management in 2018 with recommended management yielding 80 bushels/acre and high input management yielding 79 bushels/acre. Let’s examine the yield component response to determine why there was once again a lack of response to high input management in conventional wheat. Table 1 indicates that there was no statistical response in spikes/m2, kernels/spike, or in kernel weight of individual kernels to the additional inputs in high input wheat. As in 2016, the relatively dry weather conditions in April and May (4.87 inches of precipitation total) probably resulted in no leaching or denitrification of the applied N (70 lbs. /acre) in late March in the recommended input management treatment. The lack of response to an additional 30 lbs. /acre of N is especially interesting in 2018 because the record cold temperature in April (coldest April ever at the Aurora Research Farm and most of upstate NY) resulted in limited if any mineralization of organic N. Consequently, the 70 lb. /acre application of N in late March (as well as the recommended seeding rate of 1.2M seeds/acre) provided adequate N for optimum tillering and subsequent spike development. Thus, the recommended input management treatment, despite being planted at 500,000 fewer seeds/acre and receiving 30 lbs. /acre of less N, had similar spike numbers as the high input treatment.

The single 70 lb. /acre application of N also provided adequate N for optimum kernel/spike development as indicated by the statistically similar number of kernels/spike between treatments. The potential number of flowers or florets in wheat is determined at the double ridge stage (sometime around the end of tillering or the end of April), successful fertilization of the florets occurs during stem elongation or during May, and successful kernel set and retention, thus final kernel number, is determined during anthesis and in the 1-week period after anthesis. Nitrogen and soil water availability (as well as genetics, tiller number, and or light) are major drivers in determining kernel number. Again, the statistically similar number of kernels/spike between high input and recommended input management indicates adequate N in the recommended treatment.

Finally, the dry June conditions (1.63 inches of precipitation) evidently limited disease development, as indicated by the similar kernel weights between the high input and recommended input management treatments. Obviously, a fungicide application was not required on wheat during the dry spring of 2018. The yield component data is quite robust. If you do the math, you will find that the estimated yield from the recommended input subsamples came in at 81.6 bushels/acre and the estimated yield from the high input subsamples came in at 79.9 bushels/acre. You can’t get much more precise than that.

So now we have compared high input vs. recommended input wheat management 7 times (5 times in the 1980s, and again in 2016 and in 2018). We only observed a yield response in 3 of 7 years. We only observed an economic yield response in 1 of 7 years. I realize that all the data is specific to the Aurora Research Farm where yields are not as high as they are in western NY. But I would think that data from central NY would be more relevant than data from SW Ontario, Kentucky, or from Michigan? Especially replicated data with lots of supporting measurement to quantify responses.

Certainly, in some years (wet spring conditions), a split-application of additional N in tandem with a timely fungicide application around anthesis would certainly be warranted. But to accept carte blanche the “new way” of managing wheat is not a good management strategy unless you are totally risk-averse. I would recommend managing wheat like you manage corn. If it is a wet spring and you apply most or all your N to corn up-front, you need to come back with a side-dress application of additional N. Same thing with wheat. If you put all your N on in late March or early April and April is very wet, an additional 30 to 40 lb./acre N top-dress application in late April would certainly be warranted. Likewise, with a fungicide application. If May is wet and disease is prevalent and there is a high likelihood of head scab development, a fungicide application is a must. But as in corn, there is no need to apply a fungicide, if disease incidence is low and there is a low probability of disease development in the near future.

Spring weather conditions vary greatly from year to year. At the Aurora Research Farm over the last 5 years, April has been exceedingly wet (6.14 inches in 2017) and exceedingly dry (1.87 inches in 2018); May has been exceedingly wet (~5.50 inches in 2015 and 2017) and exceedingly dry (~2.0 inches in 2016 and 2018); and June has been exceedingly wet (8.0 inches in 2015) and exceedingly dry (0.74 inches in 2016 and 1.63 inches in 2018). I would recommend managing wheat in the spring according to weather conditions. First, apply the recommended N rate (60-70 lbs. /acre of actual N) in late March or early April. But if April turns wet, I would suggest applying an additional 30-40 lbs. N/acre as soon as you can get on the field. Likewise, with disease management. If May turns wet, scout the fields frequently. If disease development is prevalent and especially if there is a high probability that head scab will develop once wheat heads out, I would suggest a timely fungicide application (anthesis stage). But if conditions have been dry and are predicted to stay dry, I suggest saving yourself some money.

Print Friendly, PDF & Email

Extremely Low Weed Densities in Conventional Soybean and Relatively Low Weed Densities in Organic Soybean (especially in the Corn-Soybean-Wheat/Red Clover Rotation) in 2018

Bill Cox and Eric Sandsted

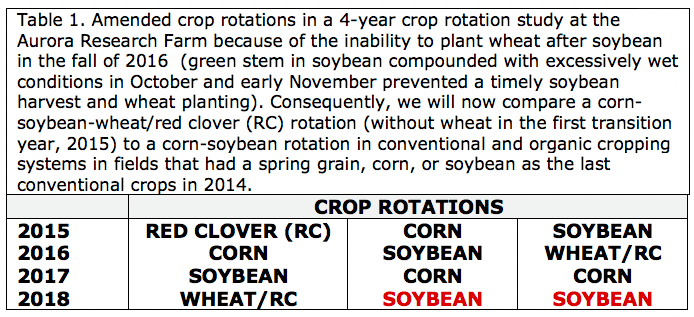
We initiated a 4-year study at the Aurora Research Farm in 2015 to compare different sequences of the corn, soybean, and wheat/red clover rotation in conventional and organic cropping systems under recommended and high input management during the transition from conventional to an organic cropping system. We provided a detailed discussion of the various treatments and objectives of the study in a previous news article (https://blogs.cornell.edu/whatscroppingup/2015/07/23/emergence-early-v4-stage-and-final-plant-populations-v10-psnt-values-v4-and-weed-densities-v12-in-corn-under-conventional-and-organic-cropping-systems/). Unfortunately, we were unable to plant wheat after soybean in the fall of 2016 because green stem in soybean, compounded with very wet conditions in October and early November, delayed soybean harvest until November 9, too late for wheat planting. Consequently, corn followed soybean as well as wheat/red cover in 2017 so we are now comparing different sequences of the corn-soybean-wheat/red clover rotation with a corn-soybean rotation (Table 1). This article will focus on weed densities in soybean in 2018 (highlighted in red in Table 1) at the full pod stage (R4), the end of the critical weed-free period for soybean.

The fields were plowed on May 17 and then cultimulched on the morning of May 18, the day of planting. We used the White Air Seeder to plant the treated (insecticide/fungicide) GMO soybean variety, P22T41R2, and the non-treated, non-GMO variety, P21A20, at two seeding rates, ~150,000 (recommended input) and ~200,000 seeds/acre (high input). We also treated the non-GMO, P21A20, in the seed hopper with the organic seed treatment, Sabrex, in the high input treatment (high seeding rate). We used the typical 15” row spacing in conventional soybean and the typical 30” row spacing (for cultivation of weeds) in organic soybean. We rotary hoed the organic soybeans on May 29, followed by a close cultivation on June 14, and then three in-row cultivations (June 19, July 10, and July 26). We applied a single application of Roundup to conventional soybeans on June 20.

Conditions were very dry for the 2 months following planting (3.12 inches from May 17 until July 16). Consequently, weed densities were quite low through late July. Over the next 10-day period (July 17-27), however, 4.89 inches of precipitation were recorded at the Aurora Research Farm. Consequently, very robust weeds (velvet leaf, foxtail, and ragweed in particular) were visible in the organic plots when we took our weed counts on August 10 at the full pod stage (R4 stage), the end of the critical weed-free period in soybeans. Conditions remained relatively moist with 3.53 inches of rain in August and another 2.0 inches of rain during the first 2 weeks of September.

Photo 1: Weed free conventional soybeans (soybeans in the corn-soybean-wheat/red clover on the left and in the corn-soybean rotation on the right) at the R 8.0 stage.

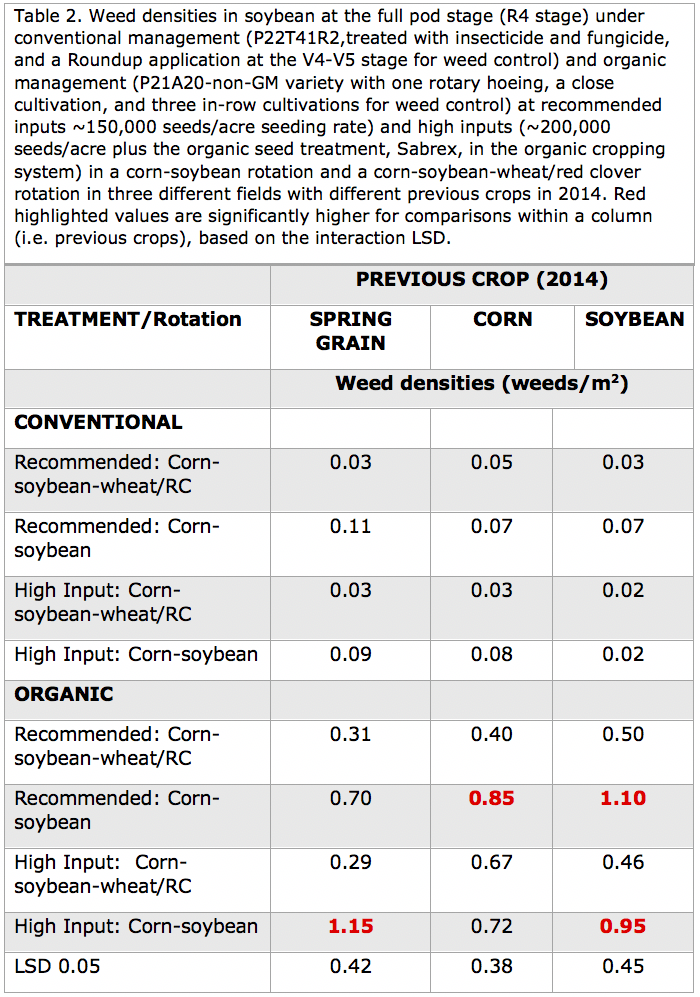
Weeds were almost non-existent in the conventional plots that received only a single application of Roundup (Table 2). This is the 4th consecutive year in soybeans where we applied a single application of Roundup for weed control and had almost complete control. Rotation and management inputs did not affect weed densities in conventional soybean (Table 2). The use of the moldboard plow in conjunction with a Roundup application about 5 weeks after planting has certainly been an excellent weed control combination for conventional soybean in this study (Photo 1).

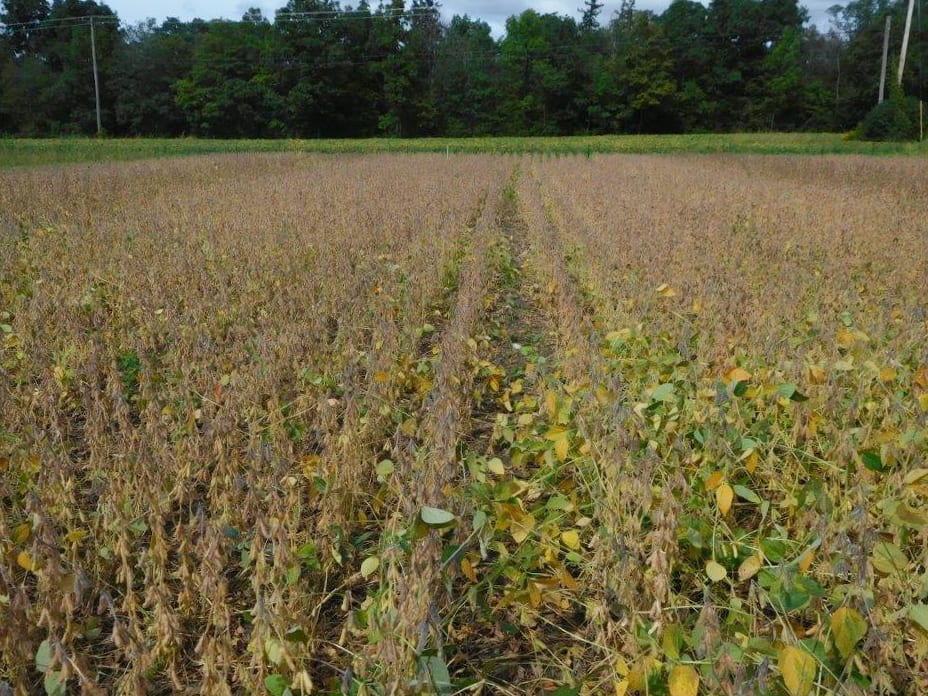
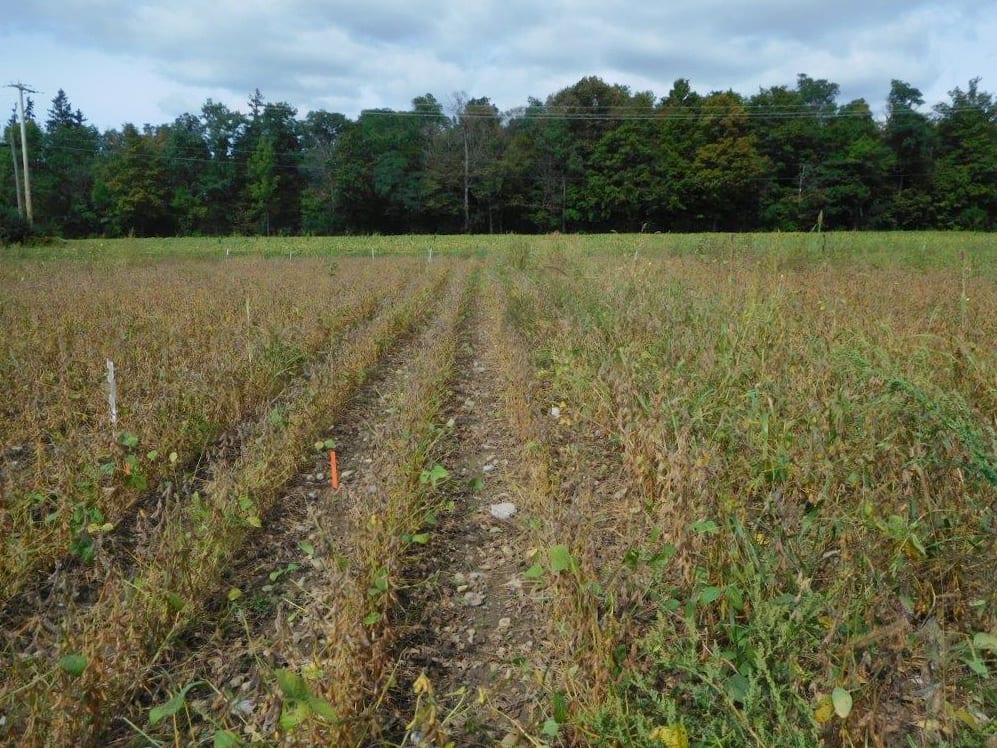
Photo 2: Organic soybean had fewer weeds in the corn-soybean-wheat/red clover rotation (on the left) compared with the corn-soybean rotation (on the right) at the R 8.0 stage.

Although weed densities were relatively low in organic soybeans (mostly less than 1.0 weed/m2, Table 2), the weeds were very robust (Photo 2). Undoubtedly, the very wet conditions from mid-July through mid-September provided excellent growing conditions for the late-emerging velvet leaf and ragweed. Unlike conventional soybean, rotation did affect weed densities in organic soybeans with higher weed densities in the corn-soybean rotation compared with the corn-soybean-wheat/red clover rotation in all three fields (spring grain, corn, and soybean fields in 2014). We also observed a rotation effect for weed densities in organic corn in 2017 (but not in conventional corn) with far fewer weeds in organic corn in the corn-soybean-wheat/red clover rotation compared to the corn-soybean rotation (https://blogs.cornell.edu/whatscroppingup/2017/08/10/wheatred-clover-provides-n-and-may-help-with-weed-control-in-the-organic-corn-soybean-wheatred-clover-rotation/). High seeding rates did not affect weed densities in organic soybean in 2018.

In conclusion, conventional soybean had virtually no weeds in 2018 for the 4th consecutive year when combing moldboard plowing with a single application of Roundup. In contrast, organic soybean had very robust weeds in 2018, which resulted in a somewhat trashy looking field, but weed densities were relatively low for the 4th consecutive year. The corn-soybean- wheat/red clover rotation had lower weed densities when compared to the corn-soybean rotation in organic soybean so the inclusion of wheat/red clover in the rotation appears essential to maintain weed densities at a manageable level in organic soybeans. The very wet conditions from about mid-July (R3 stage) through mid-September (R7 stage), however, may mitigate any potential yield losses in the corn-soybean compared to the corn-soybean-wheat/red clover rotation, despite ~ 2x higher weed density. High (~200,000 seeds/acre) compared to recommended seeding rates (~150,000 seeds/acre) did not reduce weed densities in organic soybean. Perhaps more emphasis should be placed on identifying the best crop rotations rather than high seeding rates for reducing weed densities in organic soybean in New York.

Print Friendly, PDF & Email

What’s Cropping Up? Vol. 28 No. 2 – May/June 2018

Anatomy of a Wet Year: Insights from New York Farmers

Shannan Sweet1, David Wolfe1, and Rebecca Benner2
1School of Integrative Plant Science, Horticulture Section, Cornell University
2The Nature Conservancy, New York State Office, Albany NY

Key Findings

  • The 2017 heavy rainfalls and flooding impacted farms across New York State
  • Crops grown on clayey soils suffered an estimated 53% loss in crop yield and crops grown on gravelly, sandy or siltier soils suffered estimated crop yield losses of 25% or less
  • In addition to yield losses, 95% of farmers said the quality of their crop was negatively impacted
  • 30% of farmers said they would have increased their drainage infrastructure, including adding tiling and drainage ditches, if they had known how wet 2017 would be

Background

A wet spring, followed by higher than average precipitation and heavy rainfall events (e.g. the heaviest 1% of all daily rainfall events) during the 2017 growing season (NRCC) led to saturated soils and flooding on many farms throughout New York State (NY). The frequency of heavy rainfall events have already increased by 71% in NY over the last half century (NCA 2014), and this trend is predicted to continue in the future (Wuebbles et al. 2014). Given this, and to get a sense of how farmers were affected by these conditions, as well as how they coped, we surveyed farmers across NY State throughout September of 2017. The survey was distributed online and in paper format with help from Cornell Cooperative Extension, The Farm Bureau, and New York State Department of Agriculture & Markets. A majority of the 45 farms in 24 counties were in areas of the state that experienced the heaviest rainfalls, and we had fewer responses from farms in the Adirondacks region and southeastern part of the state, where heavy rains and flooding were less prevalent (Fig. 1).

Fig. 1. New York State percent of normal precipitation for March through August of 2017 (map provided by the NRCC). Black dots indicate counties where farmers responded to our survey.

Heavy rainfall and flooding impact

Of the farmers surveyed, those with heavier clay soils estimated crop yield losses of 53%. More gravelly soils led to lesser yield losses (17%), and for crops grown on siltier or sandier soils farmers estimated yield losses of 22 to 25%. Vegetable, field, and fruit crops suffered estimated yield losses of 38%, 32%, and 24%, respectively (Fig. 2). Importantly, 95% of farmers said the quality of their crop was negatively impacted by issues related to the heavy rainfalls in 2017 (see Fig. 3 for list of ‘issues’).

Fig. 2. Percent crop yield loss by soil type (top) and crop type (bottom).

When asked what the economic impact of the heavy rainfalls was on their farm, 80% of farmers said it was either “moderate” or “severe”, 17% said it was “minor”, and 3% said the heavy rainfalls were merely a “nuisance” and had almost no economic impact. In rating the importance of various issues related to heavy rainfalls in 2017 in terms of economic impact on their farm, over half of the farmers rated saturated soils and field flooding, delays in or inability to plant or harvest, inability to use equipment, lack of field access, and crop disease as “extremely or very” important (Fig. 3).

Fig. 3. Response to the survey question “How important are these issues {listed on figure} related to heavy rainfalls in 2017 in terms of economic impact on your farm?”. Figure shows percent of farmers rating the issues as (a) extremely + very important, (b) fairly + somewhat important, and (c) not important.

Adaptive capacity

82% of farmers said they use drainage ditches or drainage tile to help deal with heavy rainfalls, yet over half of farmers said they did not have enough infrastructure and/or equipment to deal with heavy rainfalls. Further, 70% of farmers said the 2017 heavy rainfalls led to the recognition of weaknesses or limitations in the infrastructure on their farm, particularly in relation to manure management and drainage infrastructure. And when asked what they would have done differently if they had known how wet 2017 would be there was a variety of responses (Fig. 4). Nearly 1/3rd of farmers said they would have expanded their drainage capacity (e.g. more drainage tiles and ditches, etc.). Nineteen percent would have changed their fertilizer, herbicide, or pesticide application timing, and another 10% would have adopted better soil health practices, such as using cover crops, reducing tillage, and using composts or mulches.

Fig. 4. Response to the survey question “What might you have done differently if you had known how wet this summer would be?” The “other” responses included: plant more acres, plant in different location, and increase greenhouse infrastructure.

We also gave farmers a list of soil health practices and asked them to tell us if, for the ones they use on their farm, any of them lessened the impact of heavy rainfalls in 2017 (Fig. 5). Aside from “the use of mulches”, which 67% of farmers said did not help them, a vast majority said other soil health practices did help. Over 70% of farmers said that practices such as “use of winter cover crops”, “reduced tillage”, “use of composts or manure”, “leaving crop residues”, and/or “changing crop rotations” did lessen the impact of the very wet 2017 season. To learn more about soil health check out https://blogs.cornell.edu/soilhealthinitiative/.

Fig. 5. Response to the survey question “Did any soil health practices you have adopted on your farm lessen the impact of heavy rainfalls in 2017?”.

Insights for extension educators, researchers and policy makers

Over half of the farmers reported experiencing issues on their farm related to heavy rainfalls or flooding every 1 to 4 years. The other 46% reported this occurrence rarely or only every 5 to 6 years. While climate projections for NY indicate that we are likely to expect more heavy rainfall events, as well as more short-term summer droughts in the future (NCA 2014, Wuebbles et al. 2014, Sweet et al. 2017), our survey results suggest that, though farmers were concerned about the impacts of these events in the future, they are not as convinced that these events will occur more frequently in the future. For instance, 49% of farmers said they were “extremely or very” concerned that heavy rainfalls and flooding will negatively impact their farms in the future. Yet, only 38% said they were similarly concerned that such events may occur more frequently in the future (Fig. 6). Also, given the drought in 2016 (Sweet et al. 2017), we asked farmers a similar series of questions pertaining to drought. Though 31% of farmers were “extremely or very” concerned that drought may negatively impact their farm in the future, only 24% were concerned that drought may occur more frequently in the future.

Fig. 6. Level of concern by farmers of the frequency of occurrence and impact of (a) heavy rainfalls/flooding and (b) drought.

With climate change, NY farmers are likely to continue facing unique challenges related to both increased heavy rainfall events as well as short-term summer droughts. Resource managers and planners, engineers, researchers, extension agents, NGO’s and other farm-support organizations need to prepare to help farmers adapt to and become more resilient to an uncertain future.  Information collected from farmers about how they might adapt to future climatic events suggests there could be potentially dramatic consequences not only for farmer livelihoods and food production, but also for NY natural resources.  For example, certain adaptation practices could impact downstream water quality and availability.

Based on our survey results, here are some ideas farmers had on how the above mentioned organizations might help farmers better prepare for and cope with heavy rainfalls events in the future:

  • Low-cost loans or ‘in kind’ grants to help with costs of improving drainage (e.g. drainage ditches and tiles)
  • Continued education on nutrient management planning
  • Advice on how to increase soil organic matter for improved drainage capacity
  • Information about cropping options and strategies to cope with heavy rainfalls
  • Lower cost and better fungicides for wet years
  • Increased town drainage (e.g. more funding for ditch digging and for clearing debris out of ditches)

References:

NRCC – Northeast Regional Climate Center. URL: http://www.nrcc.cornell.edu/regional/monthly/monthly.html.
NCA – National Climate Assessment (2014). URL: https://nca2014.globalchange.gov/report/our-changing-climate/heavy-downpours-increasing#graphic-16693.
Sweet et al. (2017). URL: https://www.sciencedirect.com/science/article/pii/S0168192317302800
Wuebbles et al. (2014). URL: https://journals.ametsoc.org/doi/pdf/10.1175/BAMS-D-12-00172.1

This project was funded by Cornell University’s Atkinson Center for a Sustainable Future and The Nature Conservancy. For more information, contact Shannan Sweet: 126 Plant Science Bldg., Ithaca, NY 14853; 607 255 8641, sks289@cornell.edu

Print Friendly, PDF & Email