Aristotelis Tagarakis1, Isaac Cornell1, Tyler Pardoe1, Josh Cawley2, Mike Hunter3, Mike Stanyard3, Karl Czymmek1,4, and Quirine Ketterings1 1Nutrient Management Spear Program, Department of Animal Science, Cornell University, Ithaca, New York, 2Agrinetix, 3Cornell Cooperative Extension, and 4PRODAIRY
Nitrogen (N) is often the most limiting nutrient for optimum corn production. It is needed in large quantities, but because N is unstable, it can quickly be lost to the environment. In recent years, crop-sensing technologies have been introduced to help fine-tune N management accounting for within-field spatial variability, which can increase yields and/or result in better use of N fertilizer. Technological advances in side-dressing equipment and crop sensors now allow for on-the-go variable rate application of N fertilizer.
Crop Vigor and proximal Sensors
The proximal sensors (Figure 1) emit light at the visible (VIS) and near infrared (NIR) wavelengths from a light emitting diode (LED), and then they measure the light reflected back to the sensor. These measurements can be used to calculate various indices as indicators of plant vigor. One such index is the normalized difference vegetation index (NDVI), which is an indicator of greenness of the crop canopy and ground coverage. Readings range from zero to one; values approaching one indicate more vigorous plants. Sensors can be handheld or machine-mounted (coupled with side-dress equipment). When properly calibrated, readings are used to estimate yield potential (step 1) and then derive an N recommendation based on expected total N uptake and N use efficiency (step 2).
Figure 1: Handheld sensor displaying the NDVI value reflected by the plant canopy (left) and spray boom-mounted sensors (right).
Field Applications
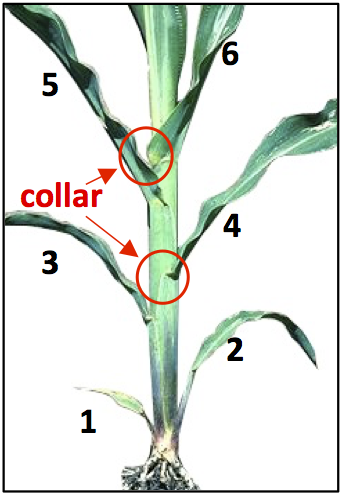
Figure 2. Corn at V6 growth stage with 6 visible collared leaves.
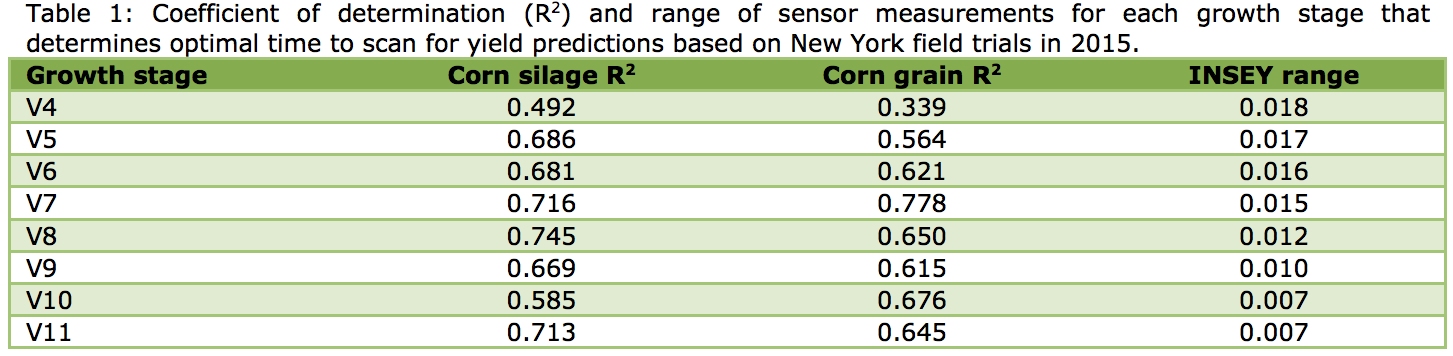
For accurate variable N application, timing of sensing and N side-dressing is very important. Data from field trials in New York in 2015 show that V6 is the earliest possible time to scan for accurate yield potential predictions; at and after V6 the NDVI scan divided by the days from planting, called the In Season Estimate Yield (INSEY) explains more than 60% of the final season yield (R2>0.60; see Table 1). Prior to V6, yield potential predictions based on INSEY are less reliable (R2<0.60 for corn grain at V5 and less than 0.5 for both grain and silage at V4). Scans done at V7, V8 and V9 also have R2 values >0.60 but the later scans have two disadvantages: (1) the plants’ yield potential may already be impacted by a lack of N; and (2) the INSEY range gets smaller and small scanning differences can have great implications for predictions of both final yield and N needs. Thus, producers should target V6 to V8 crop stages for scanning. The plant growth stage is the number of fully emerged leaves that have visible leaf collars (the discolored zone at the base of a leaf blade; Figure 2). The positioning of the NDVI sensor is just as important as the crop stage, and the user’s manual (manufacturer specific) should be strictly followed. Generally, sensors can be held or mounted 24 to 48 inches directly above the crop canopy centered over the row, but 36 inches is optimum to account for varying height in the field.
Reference Strips and their Importance
When applying on-the-go variable rate N mid-season, optimal results are achieved when implementing N reference strips. These are strips in the field that represent N availability extremes (high and low). Reference strips are primarily designed for use in combination with sensor technology (Greenseeker, CropCircle, OptRX, CropSpec) to calibrate the variable rate application equipment for a specific field and timing of application. When used with sensors, the strips should be wide enough to cover all sensors mounted on the equipment. The use of reference strips, when implemented properly, can help prevent over-application of N fertilizer by identifying areas where plants have sufficient N or are so compromised in growth due to other reasons that further addition of N is not economical. They can also help prevent under-application of N fertilizer where soil N resources are insufficient and N addition could increase yield. There are four types of reference strips: N-rich, zero-N, ramp calibration, and virtual. Additional reference strips may be added in large fields that show high variability.
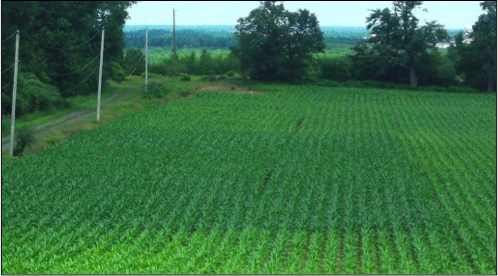
Figure 3. An N-rich strip in a corn field in Northern New York at the V7 growth stage (7 leaves with visible collar).
The N-rich strip is where a large amount of N was applied at planting, to ensure no N deficiency mid-season when side-dress N decisions need to be made (Figure 3). The N-rich strips are installed before, at, or directly after planting (ideally within 3 days of planting) to give sufficient time for plants to respond to the N application before it is time to side-dress N. A strip of at least 100 feet long per representative area is typically sufficient. Avoid installing N-rich stripsin the headlands, wet areas or any other problematic areas in the field as readings will reflect conditions other than N availability. Avoid installing N-rich strips in the same spot every year as well. Typically it is sufficient to apply twice the N recommended, up to 300 lbs N/acre, in the N-rich strip. The readings of the N-rich strips are used as a base to determine the maximum yield potential of the specific field for that year. This information is needed to calibrate the algorithm, used to prescribe the N rate according to local specifications at the time of application.
A zero-N strip is a strip in the field where no N fertilizer is applied at planting and where readings will reflect soil N supply capacity from past manure applications, rotation credits, and soil organic matter. It provides an indication of the yield potential if no further N fertilizer addition was done. It is recommended for use in conjunction with the N-rich strip.
The RAMP calibration strip is a pass in the field with varying levels of N (at least 5 different rates; at least 40 feet long per rate) applied in addition to the normal starter N application. The main difference in the interpretation between the RAMP and N-rich+zero-N reference strips is that the RAMP strip can give an estimation of the best rate of N to apply when no sensors are used. A RAMP strip may, for example, include 0, 50, 100, 150, and 200 pounds of N per acre. If the corn in the 100, 150, and 200 lbs N/acre sections of the strip look similar and the corn that received 0 and 50 lbs/acre is smaller and less green, the optimum rate is about 100 pounds of N per acre. These types of reference strips can be useful for farmers who do not use sprayer-mounted sensors.
Virtual reference strips are “statistical reference strips” that are created from collected data, and not an actual physical N-rich strip in the field. In this approach the “virtual N-rich reading” is created by averaging the readings from the areas of the field that seem greenest and most vigorous while the “virtual zero-N” values are readings from the worst looking areas. The advantage of this type of reference strip is that it does not require any actual strip implementation in the field. However, its use is not recommended in variable fields because the readings do not account for the actual response of plants to fertilizer. “Virtual readings” are more likely to reflect field variability in topography, texture, compaction, organic matter, etc., rather than variability in N supply and availability.
Interpreting NDVI Measurements
The NDVI is calculated from sensor readings: NDVI = (NIR-VIS) / (NIR+VIS), where VIS is the amount of visible (typically red, green or red-edge) light, and NIR is the amount of near-infrared (NIR) light that is reflected by the plant. Low NDVI values indicate low crop vigor, and as the values increase it is an indication of higher crop vigor, suggesting that the plant had low or no N deficiency. Sensing of both the zero-N and the N-rich strips gives readings for plants that are potentially N deficient (zero-N strip) and for plants that do not have a shortage of N (N-rich strip). These contrasting treatments provide the best calibration for the algorithms that convert NDVI measurements into on-the-go N rate recommendations.
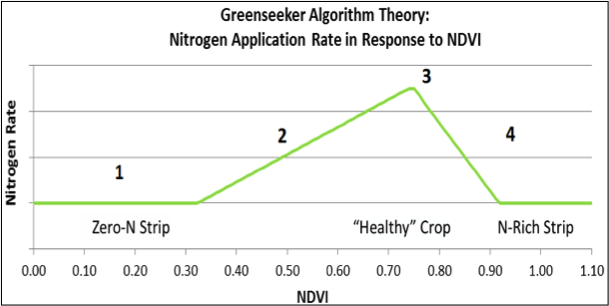
Figure 4. Depiction showing how algorithms convert NDVI values into on-the-go N recommendations (Courtesy of GoCorn).
Algorithms have been developed by various universities and commercial companies (for example, Ohio State University, Oklahoma State University, Virginia Tech, Agri-Food Canada) to provide N application recommendations using the NDVI measurements. The sensor determines the NDVI value, and its associated software converts the measurement to an on-the-go N rate using the algorithms. Figure 4 shows how most algorithms work. In this example, low NDVI measurements receive little N because little growth response is expected (poor growth due to reasons other than a lack of N, section 1 in Figure 4). As NDVI values increase through the mid-range, N recommendations also increase because a yield response to extra N is likely (section 2). At point three, yield response to N no longer increases with NDVI. After that point, N recommendations decrease with increasing NDVI (section 4), reflecting sufficient N for optimal crop growth.
There are numerous factors that can impact the accuracy of an algorithm, including type and variety of crop, soil type, crop height, local weather conditions, and growth stage. To achieve efficient and reliable, sensor-based, on-the-go N recommendations, algorithms that were developed for local soil, field management, and climate should be used. With any algorithm, it is important to test the performance within a given area in order to provide growers with the most accurate N rate recommendations.
Summary
New technologies like NDVI sensors can aid in increasing N use efficiency through variable-rate N application within an individual field and throughout the farm. Timing of measurement and positioning of sensors are important to achieve reliable results. Furthermore, reference strips are essential to obtain the most accurate, on-the-go, variable rate N prescriptions. Implementation of N-rich and zero-N strips or RAMP strips in each management zone in a field is recommended. Algorithms convert NDVI measurements into on-the-go N rate recommendations while in the field. Algorithms that are based on local conditions should produce the most accurate results. Variable-rate N application allows growers to reduce N losses to the environment and possibly save on N fertilizers and/or increase yield by increasing N use efficiency. Work is ongoing to evaluate which algorithms are most appropriate to use for corn grown for silage or grain in New York State.
Acknowledgments
Funding was provided by the Northern New York Agriculture Development Program (NNYADP) and the New York Farm Viability Institute. For questions about these results contact Quirine M. Ketterings at 607-255-3061 or qmk2@cornell.edu, and/or visit the Cornell Nutrient Management Spear Program website at: http://nmsp.cals.cornell.edu/.
Quirine Ketterings1, Karl Czymmek1,2, Sanjay Gami1, Mike Reuter3, and Mike Rutzke4
1Cornell University Nutrient Management Spear Program, 2PRODAIRY, 3Dairy One, and 4Cornell Nutrient Analysis Laboratory
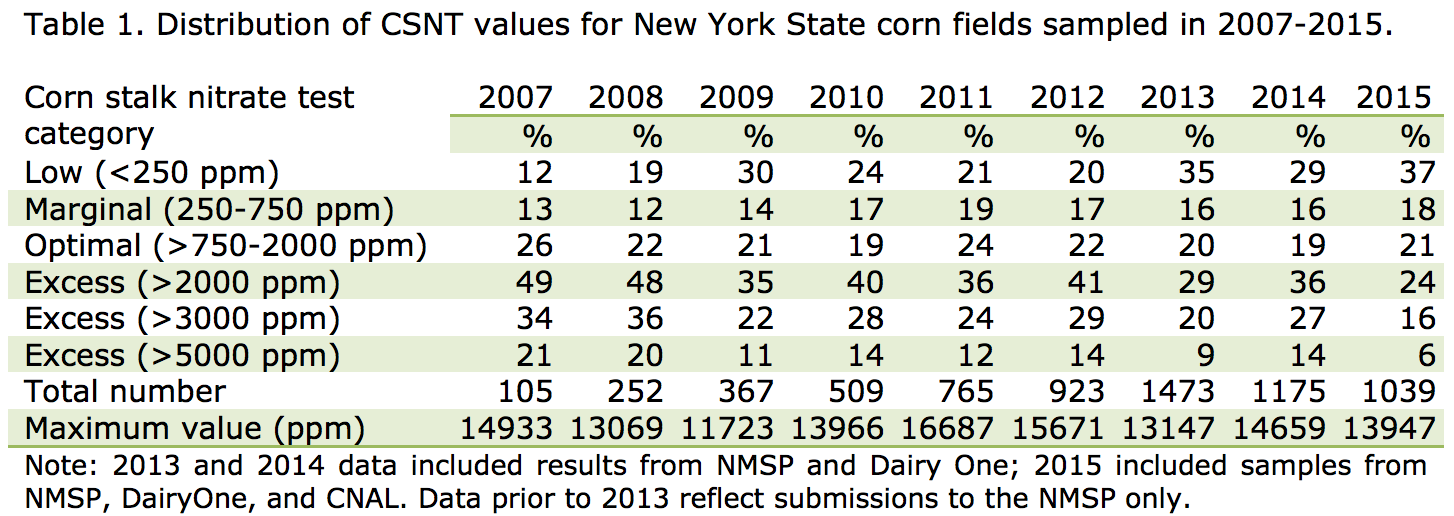
The corn stalk nitrate test (CSNT) is an end-of-season evaluation tool for nitrogen (N) management for 2nd or higher year corn fields. The greatest benefit of this test is that it allows for evaluation and fine-tuning of N management for individual fields over time. Corn stalk nitrate test results >2000 ppm indicate there was significantly more N available during the growing season than the crop needed. It does, however, require multiple years of testing to gain experience with on-farm interpretation. In addition, within-field spatial variability can be considerable in New York, requiring (1) high density sampling (1 stalk per acre at a minimum) for accurate assessment of whole fields, or (2) targeted sampling based on yield zones, elevations, or soil management units.
The summary of CSNT results for the past nine years is shown in Table 1. Data prior to 2013 reflect submissions to the NMSP only. In the 2013 and 2015 growing season, the CSNT results from the NMSP, DairyOne, and CNAL were summarized to obtain a distribution of CSNT categories in New York State. A continued quality control program among the three laboratories showed excellent consistency in reported data. For 2015, this summary shows that about 24% of all tested fields were over the 2000 ppm range, while 16% were over 3000 ppm and 6% exceeded 5000 ppm. In contrast, 37% of the 2015 samples tested low in CSNT.
Crop history, manure history, other N inputs, soil type, and growing conditions all impact CSNT results, and crop management records that include these pieces of information can be used to evaluate CSNT results and determine where changes can be made. Weed pressure, disease pressure, lack of moisture in the root zone in drought years, lack of oxygen in the root zone due to excessive rain (anaerobic soil conditions), and other stress factors can impact the N status of the crop as well, so in some circumstances, additional N might not have been able to overcome the real reason for the low CSNTs (e.g. no amount of N fertilizer can make up for a drought). Work is ongoing within the NMSP to develop plant-based stress indicators that can help us identify when CSNT’s are low due to a lack of N versus where other stress factors existed.
Bill Cox1, Eric Sandsted1, and Gary Bergstrom2 1Soil and Crop Sciences Section, 2Plant Pathology and Plant-Microbe Biology Section – School of Integrated Plant Science, Cornell University
Photo: Spraying a pesticide at the R3 stage results in mechanical damage to soybeans, especially drilled soybeans in 7.5 inch rows.
Still, why did we get a yield response to high input management in the conventional cropping system? Climatic conditions were exceedingly dry from the day of fungicide application through harvest (1.4 inches of precipitation in August and 1.35 inches from September 1-20). Consequently, visually discernible disease symptoms were absent on the visible portion of soybean foliage from the R3-R8 stage. Nevertheless, because we almost never observe a response to a seeding rate of 200,000 seeds/acre compared with 150,000 seeds/acre, we speculated that perhaps the fungicide and not the higher seeding rate provided the 9% yield increase. In addition to disease control, there is some speculation that a fungicide application may improve overall soybean health, independent of disease presence.
Yield component analyses help explain why there was a yield response to high input management of soybean in the conventional cropping system in 2015. In each soybean plot (planted in 15-inch rows), we subsampled the four center rows in two 1 meter lengths (1.52 m2 area) about 5 days before the 9/23 soybean harvest of the entire plot with a plot combine. We hand-harvested all the plants in the sub-sampled area and dried them, pulled off the pods and counted them, ran the pods through a stationary thrasher, counted the seeds that were thrashed, and weighed all the seeds (~3500-4500 seeds/sample or ~7000-9000 seeds/plot).
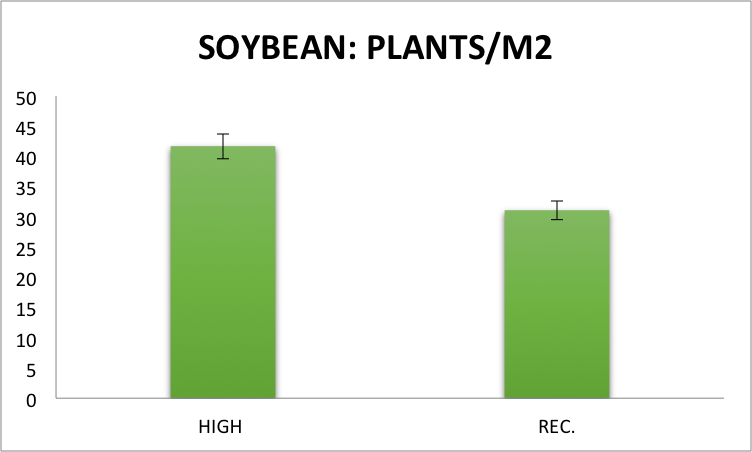
When averaged across the three previous crops of 2014, plant populations in the sub-sampled areas a few days before harvest averaged 41.7 plants/m2 (~169,000 plants/acre) in the high input management treatment compared with 31.1 plants/m2 (126,000 plants/acre) in the recommended management treatment (Fig.1). Our sub-sampled population was slightly lower than population measurements at the V2 stage in the high input management treatment (~174,000 plants/acre, https://blogs.cornell.edu/whatscroppingup/2015/09/16/emergence-early-v2-stage-plant-populations-and-weed-densities-r4-in-soybeans-under-conventional-and-organic-cropping-systems/). In contrast, our sub-sampled population in the recommended management input treatment was slightly higher than population measurements at the V2 stage (~122,000 plants/acre). Soybean populations of the subsampled regions immediately before harvest, however, are only 2.9 to 3.2% different than at the V2 stage so we believe that our sub-sampled measurements represent the entire plot extremely well.
Fig.1 Plants/ m2 of soybean, averaged across the three previous 2014 crops, in two subsampled areas (1.52 m2) of each plot in the conventional cropping system under high management inputs (~200,000 seeds/acre with a fungicide application at the R3 stage) and recommended management inputs (~150,000 seeds/acre) at the Aurora Research Farm in 2015. Error bars represent the standard error of the means.
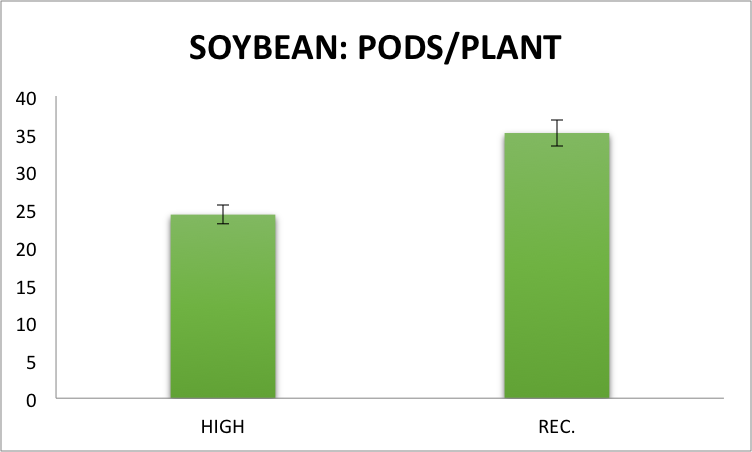
When averaged across the three previous crops, soybean averaged fewer pods/plant in the high input management treatment (24.5 pods/plant in high input management compared with 35.1 in recommended input management) in the conventional cropping system (Fig.2). Typically, soybeans at higher compared with lower seeding rates produce fewer pods/plant because of less intra-plant competition for light, water, and nutrients. We have seen the same degree of reduction in pods/plant at 200,000 seeds/acre compared with 150,000 seeds/acre repeatedly in previous experiments at the Aurora Research Farm (file: aj-103-1-123.pdf; file: aj-102-4-1238.pdf).
Fig.2 Pods/plant of soybean, averaged across the three previous 2014 crops, in two subsampled areas (1.52 m2) of each plot in the conventional cropping system under high management inputs (~200,000 seeds/acre with a fungicide application at the R3 stage) and recommended management inputs (~150,000 seeds/acre) at the Aurora Research Farm in 2015. Error bars represent the standard error of the means.
When averaged across the three previous crops, soybean averaged more seeds/pod in the high input management treatment (2.23 seeds/pods compared with 2.09 seeds/pod in recommended input management) in the conventional cropping system (Fig.3). Furthermore, soybean averaged greater seed weight in the high input management treatment (150.4 mg compared with 144.3 mg in the recommended input management treatment) in the conventional cropping system (Fig.4). In the two previously cited studies, we did not see a seeding rate effect on seeds/pod or seed weight, which is consistent with other studies in the USA. Despite virtually zero disease pressure in 2015 because of the very dry August and first half of September conditions, could the fungicide application have resulted in more seeds/pod and seed weight because of improved plant health? Certainly an increase in seeds/pod and seed weight are the two yield components most likely to be affected by a fungicide application at the R3 stage. We did not, however, observe delayed senescence in the high input management compared with the recommended input management treatment. (It is possible that the higher plant populations offset a potential fungicide effect on delayed senescence.)
Fig.3 Seeds/pod of soybean, averaged across the three previous 2014 crops, in two subsampled areas (1.52 m2) of each plot in the conventional cropping system under high management inputs (~200,000 seeds/acre with a fungicide application at the R3 stage) and recommended management inputs (~150,000 seeds/acre) at the Aurora Research Farm in 2015. Error bars represent the standard error of the means.Fig.4 Seed weight of soybean, averaged across the three previous 2014 crops, in two subsampled areas (1.52 m2) of each plot in the conventional cropping system under high management inputs (~200,000 seeds/acre with a fungicide application at the R3 stage) and recommended management inputs (~150,000 seeds/acre) at the Aurora Research Farm in 2015. Error bars represent the standard error of the means.
If you multiply out the yield components (plants/m2 x pods/plant x seeds/pods x seed weight), the sub-sample yields averaged 51.1 bushels/acre in the high input management compared with 49.0 bushels/acre in the recommended input management treatments. The sub-sample yields were ~5-10% greater than the actual plot yields, and the difference in yield between treatments was only 4.3% instead of the 9% difference in plot yields. Nevertheless, we feel that the sub-sampled data provide us with insight on how soybean responded to high input management (fewer pods/plant with higher seeding rates and more seeds/pod and seed weight perhaps because of the fungicide application?).
Conclusions: We will continue this study for two additional years to see if there is indeed a response to fungicide application in the presence of high seeding rates. Currently, it is pure speculation that a fungicide application at the R3 stage resulted in more seeds/pod and greater seed weight in soybean. Nevertheless, an increase in seeds/pod and seed weight would be the two most likely yield components that an R3 fungicide application would affect. As noted previously, the 9% yield advantage did not result in an increase in partial profit. Furthermore, we avoided the harvest rows when applying the fungicide application at the R3 stage. In a production field, an R3 fungicide application would probably result in some yield reduction, associated with mechanical damage of the crop, especially with spray booms less than 90-120 feet in width, reducing the magnitude of the potential yield response. We are looking forward to 2 more years of research on this topic.
Bill Cox and Eric Sandsted
Soil and Crop Sciences Section – School of Integrated Plant Science, Cornell University
Photo: Corn under high seeding rates in 2015.
It has been documented that current commercial corn hybrids require greater seeding and N rates to maximize grain yield compared with hybrids released in the 1990s, or even in the early to mid-2000s. Seeding rates are frequently based on yield goal, so optimum seeding rates are ~38,500 kernels/acre for high-yielding current hybrids (>250 bushels/acre) under growing conditions in the Midwest USA. Consequently, an increasing number of grain growers in the Midwest are planting at seeding rates greater than 35,000 kernels/acre. In NY, our yield goal is lower but an increasing number of growers who average 190-220 bushels/acre on their farm are planting corn at ~35,000 kernels/acre, greater than our recommended ~30,000 kernels/acre. In addition, there is a general perception that in order to maximize yield from these high-yielding hybrids, higher N rates are also required, despite the greater N use efficiency of current hybrids. We decided to once again examine the response of corn to higher than recommended seeding rates (~35,500 vs. ~29,600 kernels/acre, respectively) and N rates (185 vs.145 total N lbs/acre, respectively when corn followed corn or a small grain, and 145 vs. 105 total lbs N/acre when following soybean). This was part of a larger study comparing the response of all the crops in the corn-soybean-wheat/clover rotation under conventional and organic cropping systems with recommended or high input management, described in detail in the last What’s Cropping Up? issue of 2015. In that article, we reported that corn under high input management in the conventional cropping system averaged 167 bushels/acre across three previous crops compared with 163 bushels/acre under recommended management inputs. (https://blogs.cornell.edu/whatscroppingup/2015/11/09/corn-yield-under-conventional-and-organic-cropping-systems-with-recommended-and-high-inputs-during-the-transition-year-to-organic/).
The 2015 results agreed with research that we conducted a few years ago. If you recall, we tested two hybrids (DKC51-86 and P0125XR) in 2010 and 2011, and reported that in both years, including the high yielding year of 2010 (~300 bushels/acre), recommended seeding rates (30,000 kernels/acre) and N rates (~125 lbs total N /acre following soybean) resulted in similar yields to seeding rates of 35,000 and 40,000 kernels/acre with ~175 lbs total N/acre (http://scs.cals.cornell.edu/sites/scs.cals.cornell.edu/files/shared/documents/wcu/WCUVol22No.pdf). So why once again was there no response to high input management of corn in 2015? Yield component analysis and plant N status under the 2015 growing conditions may shed some light on the lack of response.
Fig.1 Stalk nitrate concentrations (ppm) of corn, averaged across the three previous 2014 crops, in two subsampled areas (1.52 m2) of each plot in the conventional cropping system under high management inputs (~35,500 kernels/acre with 145 to 185 lbs. total N/acre) and recommended management inputs (~29,600 plants/acre with 105 to 145 lbs. total N/acre) at the Aurora Research Farm in 2015. Error bars represent the standard error of the means.
We side-dressed corn in the conventional management system at the V6 stage on June 26, somewhat later than normal because of the excessively wet June conditions at the Aurora Research Farm (8.00 inches of precipitation in June). Two days after side-dressing (6/28), we received 1.75 inches of precipitation, resulting in extremely wet soil conditions. The study was conducted on a Honeoye silt loam soil with tile drainage so there was very little ponding of water on the soil surface. Still something must have happened to the N based on the stalk nitrate test. Stalk nitrate averaged only 528 ppm in the high input treatment compared with 345 ppm in the recommended input treatment, (Fig.1), both in the 250-750 ppm marginal stalk nitrate levels for maximum yield. We did sample for stalk nitrate concentrations about 4 weeks after black-layer formation instead of the recommended 0 to 3 weeks after, which could have contributed somewhat to the low values. Still it is doubtful that 1 week late for sampling would have such a huge effect, so it looks like both the high and recommended management treatments had marginal N status at harvest. The wet June conditions, especially the 1.75 inch precipitation event 2 days after side-dressing, should have favored a response to the high N management treatment. On the other hand, conditions became dry from early July through mid-September with only 2.8 inches of precipitation in July, 1.4 inches in August, and ~1.35 inches through 20 September, black layer formation. The dry conditions probably reduced the yield potential at this site (we averaged over 210 bushels/acre in 2013 and 2014 on the same fields), which probably reduced the potential yield response to elevated N rates.
Fig.2 Corn population (plants/m2), averaged across the three previous 2014 crops, in two subsampled areas (1.52 m2) of each plot in the conventional cropping system under high management inputs (~35,500 kernels/acre with 145 to 185 lbs. total N/acre) and recommended management inputs (~29,600 plants/acre with 105 to 145 lbs. total N/acre) at the Aurora Research Farm in 2015. Error bars represent the standard error of the means.
The dry conditions undoubtedly reduced the probability of a response to high seeding rates, as indicated by yield component analyses (Fig.2-5). We subsampled two 1 meter lengths of the two center rows (hand-harvested all the plants, pulled off the ears and dried them, shelled the ears, counted the kernels, and weighed all the kernels-~6000-7000/sample or 12000-14000 kernels/plot) in two regions of our 100 foot plots about a week before harvest (10/26). When averaged across the three previous crops of 2014, plant populations in the sub-sampled areas averaged 8.62 plants/m2 (~34,900 plants/acre) in the high input management treatment compared with 7.29 plants/m2 (29,515 plants/acre) in the recommended management treatment (Fig.2). Our sub-sample values were slightly higher than the final populations at the V10 stage when we counted all the plants in the two center rows along the entire 100 foot plot length (34,265 plants/acre in the high input and ~28,500 in the recommended management input treatment https://blogs.cornell.edu/whatscroppingup/2015/07/23/emergence-early-v4-stage-and-final-plant-populations-v10-psnt-values-v4-and-weed-densities-v12-in-corn-under-conventional-and-organic-cropping-systems/). Nevertheless, the estimated plant populations in the sub-sample are < 5% higher than populations in the entire plot so we believe that our sub-sample is very representative of the entire plot.
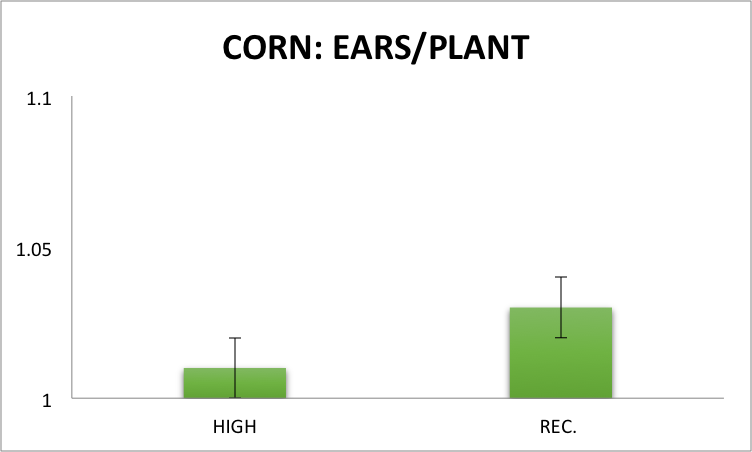
Fig.3 Ears/plant of corn, averaged across the three previous 2014 crops, in two subsampled areas (1.52 m2) of each plot in the conventional cropping system under high management inputs (~35,500 kernels/acre with 145 to 185 lbs. total N/acre) and under recommended management inputs (~29,600 plants/acre with 105 to 145 lbs. total N/acre) at the Aurora Research Farm in 2015. Error bars represent the standard error of the means.
When averaged across the three previous crops, corn averaged 1.01 ears/plant in high input management and 1.03 in recommended input management in the conventional cropping management system (Fig.3). Typically, hybrids, even modern hybrids, will produce a second ear under low plant populations, although 7.29 plants/m2 is not that low a final stand. Although ears/plant were statistically different, actual differences between the two management systems were probably not of sufficient magnitude to have a major influence on final yield.
Fig.4 Kernels/ear of corn, averaged across the three previous 2014 crops, in two subsampled areas (1.52 m2) of each plot in the conventional cropping system under high management inputs (~35,500 kernels/acre with 145 to 185 lbs. total N/acre) and under recommended management inputs (~29,600 plants/acre with 105 to 145 lbs. total N/acre) at the Aurora Research Farm in 2015. Error bars represent the standard error of the means.
When averaged across the three previous crops, corn averaged 542 kernels/ear in high input management and 572 kernels/ear in recommended input management (Fig.4). Again, corn at lower seeding rates typically have greater kernels/ear than corn hybrids at higher seeding rates because of less intra-plant competition for light, water, and nutrients. Likewise, corn hybrids at higher seeding rates typically have lower seed mass (weight of an individual kernel) than at lower seeding rates because of greater intra-plant completion, as was the case in 2015. When averaged across the previous crops, seed mass averaged 246 mg in the high management treatment and 262 mg in the recommended management treatment (Fig.5). If you multiply out the yield components (plants/m2 x ears/plant x kernels/ear x kernel weight), the sub-sample yields averaged 184 bushels/acre in the high input management compared with 179 bushels/acre in the recommended input management treatments. Although the sub-sample yields were ~11% greater than the actual plot yield, the differences between treatments were exactly the same, a non-significant 2.5 to 2.8% yield difference. So why no response to high input management in 2015? The increase in plant number at high seeding rates was offset by an increase in kernel number/ear and kernel weight at the recommended seeding rate, resulting in no significant yield difference between treatments. We have observed this time and time again under NY growing conditions. (PDF File: aj-104-4-945.pdf, PDF File: aj-105-3-693.pdf)
Fig.5 Kernel weight of corn, averaged across the three previous 2014 crops, in two subsampled areas (1.52 m2) of each plot in the conventional cropping system under high management inputs (~35,500 kernels/acre with 145 to 185 lbs. total N/acre) and under recommended management inputs (~29,600 plants/acre with 105 to 145 lbs. total N/acre) at the Aurora Research Farm in 2015. Error bars represent the standard error of the means.
CONCLUSIONS:
We will continue this study for two additional years and hopefully we will have growing conditions that favor positive yield responses to high seeding/N rates. Although July and August were cool at the Aurora Research Farm (2.5 to 1.5 degrees below normal, respectively), the dry conditions contributed to premature senescence of the corn crop in late August, regardless of management inputs. We have a tile drain every 33 feet on our Honeoye soil, which allows for early planting, but unfortunately accentuates dry soil conditions in August. Corn silked ~July 26-28 and conditions were not very stressful from late July through mid-August so kernel set and kernel retention probably was not affected by adverse weather conditions. But the dry soil conditions and the very warm first half of September contributed to premature senescence, which probably reduced seed weight, especially under higher plant populations. Consequently, there was no response to higher seeding rates at Aurora in 2015. If you are thinking of seeding rates above our recommended 30,000 plants, acre, make sure that you are on soils that are not droughty and the selected hybrid is known to respond to high seeding rates. So far we have not been able to find that successful combination.