The full version of What’s Cropping Up? Volume 30 No. 2 is available as a downloadable PDF on issuu. This issue includes links to COVID-19 resources on the back page. And as always, individual articles are available below:
Joseph Amsili, Harold van Es, Bob Schindelbeck, and Kirsten Kurtz Soil and Crop Sciences Section, Cornell University
Take-aways:
Soil biological indicators (organic matter, active carbon and respiration) were higher in finer textured soils than coarser textured soils, but organic matter quality was higher in coarser textured soils.
Soil texture exerted a strong control on a soil’s available water capacity.
Organic matter improvements are more likely to increase available water capacity in coarse textured soils compared to fine textured categories.
As progress is made in characterizing the biological and physical health of soils nationwide, soil health labs will be able to develop regionally specific scoring functions that correspond to inherent differences in soil properties and processes, which are shaped by the complex interplay of local climate, geology, biology, and time. The Cornell Soil Health Program has recognized this need and is developing scoring functions by region, soil type, and cropping system. Naturally, we have begun these efforts by focusing on New York State soils. In this first preview of the New York State Soil Health Characterization Report, we focus on the effects of soil texture on biological and physical soil health parameters. Stay tuned for the full technical report, titled “New York State Soil Health Characterization Report”, which will be published soon.
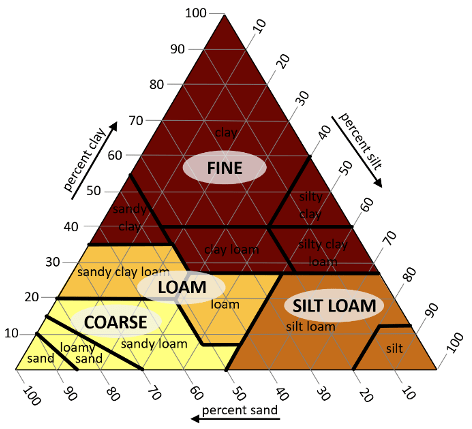
Methods The Cornell Soil Health Laboratory analyzed 1,456 samples from across New York State between 2014-2018. Soil samples were analyzed for the standard Comprehensive Analysis of Soil Health (CASH) package, which included two physical indicators – wet aggregate stability (AgStab), and available water capacity (AWC); four biological indicators – soil organic matter (SOM), active carbon (ActC), autoclavable citrate extractable protein (Protein), and respiration (Resp); and seven chemical measurements. Results were summarized by four textural groups: coarse, loam, silt loam, and fine (Figure 1). Additionally, NY SH results were compared across five cropping systems which included annual grain, dairy system, process vegetables, mixed vegetables, and pasture (Part II will include a summary of the effects of cropping systems on soil health).
Figure 1. Soil health indicators were characterized by coarse (sand, loamy sand, sandy loam), loam (sandy clay loam, loam), silt loam (silt loam, silt), and fine (sandy clay, clay loam, silty clay loam, silty clay, clay) texture groups.
Results and Discussion Soil texture is a dominant inherent soil property that exerts strong controls on a soil’s ability to function. Specifically, soil texture influences the amount of storable carbon and nutrients, a soil’s water holding capacity, erodibility, and drainage, and the habitat that soil provides to organisms. In order to evaluate the impacts of human land management (tillage, crop rotation, organic amendments) on the soil, it’s critical to understand the effects of the underlying inherent soil properties, like soil texture, on these soil health parameters.
Effects of soil texture on biological soil health indicators
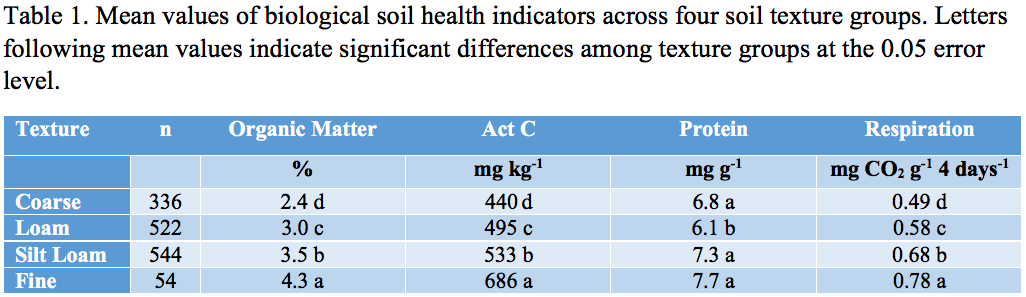
Soil texture influences the quantity and quality of organic matter a soil can hold. Soils with higher concentrations of silt and clay (fine-textured) can store more organic matter than sandy (coarse-textured) soils due to the large amount of surface area available to bind with organic molecules. In the NYS database, SOM, ActC, and Resp were highest in fine textured soils, followed by silt loam, loam, and coarse textured soils. Fine textured soils in fact had 79%, 59%, and 56% higher SOM, Resp, and Act C than coarse textured soils, respectively (Table 1). Protein did not follow the pattern of an increasing concentration in finer texture groups. This is likely because it is more difficult to extract proteins from soils with high amounts of clay. Additionally, two ratios, Protein/SOM and ActC/SOM, exhibited lower values in finer textured soils (data not shown), which also suggests a lower ability to extract protein and active carbon in fine textured soils despite high OM levels. Alternatively, it suggests higher proportions of higher-quality organic carbon and nitrogen relative to the stable organic matter, i.e., relatively more “fresh” organic matter than stable mineral-bound organic matter in coarse textured soils.
Effects of soil texture on physical soil health indicators
Soil texture exerts a dominant control on a soil’s available water capacity, which is the amount of water that a soil can hold and make available to plants. Coarse textured soils store the least amount of water because large pores between sand particles are unable to hold on to water against gravity. Specifically, as sand content increases, AWC goes down (r = -0.70). In contrast, clayey soils can store the most water, but some of that is tightly held in micropores and plants can’t access it. Therefore, soils with intermediate textures, like silt loams and to a slightly lesser extent loams, are known to store the most plant available water. We indeed found that silt content was positively correlated with AWC (r = 0.72), and silt loams and silty clay loam soils had the highest AWC. Silt loam soils had 273%, 139%, 47%, 28%, higher AWC than sand, loamy sand, sandy loam, and loam soil textures (Figure 2).
The strong textural control on AWC has implications for trying to improve a soil’s AWC with sustainable soil management strategies. The claim that, “one percent of organic matter in the top six inches of soil would hold approximately 27,000 gallons of water per acre” is often used to promote soil organic matter management. While this number is likely an over exaggeration of reality as evidenced by a recent study by Libohova, et al, 2018, who found that this number was closer to 2,850 gallons of available water stored per acre, it is true that increasing SOM is an important strategy to increase AWC. Furthermore, our research and other’s research show that SOM was more strongly related to AWC in coarse textured soils (r = 0.48) compared to loam (r = 0.14) or silt loam (r = 0.12) textured soils. This finding demonstrates that improved organic matter management can lead to increases in AWC in coarse textured soils to a much greater extent than for silt loams or finer soil textures.
Figure 2. Bar chart of mean AWC for different soil texture classes. Error bars represent 1 SD of the mean. Unlike the other soil health indicators in the Cornell Soil Health Test, AWC was highly related to soil texture to the degree that more texture classes were required to understand the effect of soil texture on AWC.
Conclusions Soil texture is a critical inherent soil property that exerts strong control on a soil’s ability to function, including its potential to store organic matter and retain plant available water. For biological indicators, SOM, ActC, and Resp values were higher in finer texture groups. Furthermore, AWC, an important physical indicator, was strongly controlled by texture. Our data suggest that coarse textured soils with low inherent AWC respond to increases in SOM to a much larger degree than silt loam soils. This NYS soil health database analysis demonstrates that soil texture is an essential variable to include in developing soil health targets at the policy or conservation planner level. Stay tuned for the full technical report titled, “New York State Soil Health Characterization Report” and for part II in the next WCU issue on the effects of cropping system on soil health indicators.
Acknowledgements We acknowledge support from the New York State Environmental Protection Fund (administered through the Department of New York Agriculture and Markets).
Lynn M Sosnoskie, Weed Ecology and Management for Specialty Crops School of Integrative Plant Science – Horticulture Section
Weeds compete with crops for light, water, and nutrients, which can result in yield reductions. Weeds can also interfere with crop production by serving as alternate hosts for pests and pathogens, providing habitat for rodents, and impeding harvest operations. Consequently, growers employ a variety of control strategies, including the application of herbicides, to manage unwanted vegetation. Although herbicides can be extremely effective at controlling undesirable plants, failures can and do occur. Weeds may escape chemical treatments for many reasons including the evolution of herbicide resistance.
Worldwide, there are 512 confirmed cases (species x site of action) of herbicide resistance. With respect to the United States, 165 unique instances of resistance have been documented. In New York, there are only four formally reported occurrences; these include common lambsquarters (Chenopodium album), smooth pigweed (Amaranthus hybridus), common ragweed (Ambrosia artemisiifolia) and common groundsel (Senecio vulgaris). All were described as being insensitive to the photosystem II inhibitors (e.g. atrazine and simazine).
Current status of herbicide resistance, globally, over time according to the International Survey of Herbicide Resistant Weeds (weedscience.org)
This, however, does not reflect the current on-the-ground situation in the state; work done by Drs. Julie Kikkert (CCE) and Robin Bellinder (Cornell) indicates resistance to linuron in some populations of Powell amaranth (Amaranthus powelli). Recent studies by Drs. Bryan Brown (NYS IPM) and Antonio DiTommaso (Cornell) suggest that horseweed (Conyza canadensis) and waterhemp (Amaranthus tuberculatus) populations may be resistant to one or more herbicide active ingredients. Pennsylvania has nine reported cases of herbicide resistance including glyphosate resistance in Palmer amaranth (Amaranthus palmeri), which was recently identified here in NY. While it is tempting to believe that herbicide resistance is a hallmark of agronomic cropping systems, resistance can and has developed in orchards, vineyards, vegetable crops, pastures, and along roadsides.
Beginning in 2020, we will undertake a screening effort to describe the distribution of herbicide resistance in the state. This coming summer and fall, growers, crop consultants and allied industry personnel who suspect they have herbicide resistance are encouraged to contact Dr. Lynn Sosnoskie (lms438@cornell.edu, 315-787-2231) to arrange for weed seed collection. Indicators of possible herbicide resistance include:
Dead weeds intermixed with live plants of the same species.
A weed patch that occurs in the same place and continues to expand, yearly.
A field where many weed species are controlled but a previously susceptible species is not.
Reduced weed control that cannot be explained by skips, nozzle clogs, weather events, herbicide rate or adjuvant selection, and calibration or application issues.
Growers can take several actions to stop the spread of herbicide resistant weeds and to prevent the development of new ones. First and foremost is scouting fields following herbicide applications and keeping careful records of herbicide performance to quickly identify weed control failure. Pesticide applicators should ensure that their equipment is properly calibrated and that they are applying effective herbicides at appropriate rates to manage the target species. Whenever possible, diversify herbicides to reduce chemical selection pressures that result from the repeated use of a single herbicide or site of action. If possible, incorporate physical and cultural weed control practices into a vegetation management plan. Be sure to control unwanted plants when they are small and never allow escapes to set seed. Clean equipment to prevent seeds of herbicide-resistant weed species from moving between infested and non-infested sites and harvest areas with suspected resistant populations, last.
Project Leaders: Bryan Brown, NYS IPM Program; Venancio Fernandez, Bayer Crop Sciences; Mike Hunter, Cornell Cooperative Extension; Jeff Miller, Oneida County Cooperative Extension; Mike Stanyard, Cornell Cooperative Extension
Collaborators: Dan Conable, Preferred Quality Grain LLC; Jaime Cummings, NYS IPM Program; Antonio DiTommaso, Cornell University; Quentin Good, Quentin Good Farms; Clinton van Hatten, Flowing Spring Farm; Kathleen Howard, Cornell University; Julie Kikkert, Cornell Cooperative Extension; Chuck Kyle, Preferred Quality Grain LLC; Grace Marshall, NYS IPM Program; Scott Morris, Cornell University; Ali Nafchi, Cornell Cooperative Extension; Jodi Putman, Cornell Cooperative Extension; Joshua Putman, Cornell Cooperative Extension; Emily Reiss, Kreher Family Farms; Matthew Ryan, Cornell University; Lynn Sosnoskie, Cornell University; Ken Wise, NYS IPM Program
Summary: Herbicide resistant weeds have become a major problem for New York soybean farmers. This project aimed to regain control of these weeds through a mix of chemical, physical, and electrical tactics. From our replicated field trials attempting to control waterhemp in soybeans, the programs that included herbicides from WSSA groups 4, 14, or 15 were most effective, and our only treatment that provided 100% control included all three of those groups. Row cultivation performed well between-rows but missed some in-row weeds. Soybean yields generally reflected the effectiveness of each weed control treatment, with untreated plots incurring a 56% yield loss. Unfortunately, the most effective two-pass treatments were also the most expensive. In a separate demonstration, our informal evaluation of an electric discharge system was successful, with most of the herbicide resistant horseweed (marestail) exhibiting complete necrosis two weeks after application.
Background and justification: In the past few years, herbicide resistant weeds have become a large problem for New York soybean farmers (Figure 1). Horseweed that is likely resistant to glyphosate (WSSA 9) and ALS inhibitor (WSSA 2) herbicides has spread through much of the state. Herbicide resistant waterhemp, which was initially found in a few isolated cases where farms had purchased contaminated inputs or equipment from other states, has now been observed in 12 counties. Waterhemp is more competitive than horseweed and based on our initial greenhouse spray chamber trials, it is likely resistant to glyphosate, ALS inhibitors, and photosystem II inhibitors (WSSA 5). In Seneca County NY, waterhemp was reported to have caused 50% yield loss in a field where the farmer had attempted to control it with several different herbicide applications.
Control of weeds that have exhibited herbicide resistance in other states has been improved by adding more herbicide sites of action, or WSSA groups, to the spray mixes – especially if more than one effective herbicide group is used – such as synthetic auxins (WSSA 4), PPO Inhibitors (WSSA 14), or long chain fatty acid inhibitors (WSSA 15). There has also been an increased emphasis on residual herbicide applications to decrease the burden on the post-emergence applications. Furthermore, due to the extended emergence period of waterhemp, residual chemistries are recommended additions to post-emergence applications.
Beyond the diversification of herbicides, non-chemical tactics are also necessary. Horseweed and waterhemp emerge from very small seeds and are susceptible to physical control through tillage/cultivation or suppression by cover crop residue. Due to the short longevity of both species’ seeds in soil, weed seedbank manipulation, sanitation, and practices that limit seed dispersal are also effective. In response to herbicide resistant weeds, one tactic that has been gaining in popularity in the last few years is the use of electrical discharge systems, which involve a front-mounted rod charged by a PTO-powered generator that is driven over the crop to electrocute weeds that escaped earlier controls.
In an attempt to regain control of these herbicide-resistant weeds in New York, we evaluated several strategies that integrated chemical, physical, and electrical tactics.
Objectives: Objective 1. Evaluate the effectiveness of several different programs for controlling waterhemp in soybeans.
Objective 2. Evaluate the potential for an electrical discharge system to control weeds that survived prior chemical control efforts in soybeans.
Figure 1. Waterhemp competing with soybeans at a farm in Seneca County, NY.
Procedures: Objective 1.
Two trial sites were established. Site A was in Seneca County, NY on a field of Odessa silt loam soil where waterhemp had survived various herbicide applications and produced seed in 2018. In 2019, the ground was prepared for planting with a field cultivator on May 22, and planted with soybeans (Channel 2119R2X, maturity group 2.1) on May 24. Pre-emergence applications were made on May 27. Post-emergence treatments were applied on July 8. All treatments are listed in Table 1. For fertilizer, muriate of potash (0-0-60, 125 lbs K2O/A) was applied prior to tillage and urea nitrogen (46-0-0, 100 lbs N/A) was broadcast on July 12.
Site B was in Oneida County, NY on a field of Conesus silt loam soil where a large patch of waterhemp had escaped herbicide applications and was hand removed the previous year. In 2019, soybeans (Asgrow 19×8, maturity group 1.9) were planted no-till on May 22 immediately followed by pre-emergence applications. Post-emergence treatments were applied July 5. All treatments listed in Table 1 except for treatments 4 and 8 were implemented at Site B. For fertility, muriate of potash (0-0-60, 120 lbs K2O/A) was applied prior to planting and starter fertilizer added 20 lbs N/A, 60 lbs P2O5/A, and 20 lbs K2O/A.
Plots were 25’ long and 10’ wide. Each treatment was replicated four times per site in a randomized complete block design. Spraying was conducted using a backpack CO2 sprayer with a 10’ boom. Spray volume was 20 gal/A applied at 40 psi. Row cultivation was achieved using a Double Wheel Hoe (Hoss Tools) with two staggered 6” sweeps (12” effective width). Two passes were made per row so that 24” of the 30” rows were cultivated.
Weed control was assessed in mid-August by collecting all aboveground weed biomass within a 2 ft2 quadrat. The quadrat was used four times per plot, placed randomly in the two middle rows of each plot. Weeds were placed in paper bags and dried at 113 degrees F for 7 days, then weighed. Control was calculated by subtracting the biomass of each treated plot from biomass of the untreated plots, dividing by the biomass of the untreated plots, and multiplying by 100. All waterhemp was manually removed immediately after the weed control assessments in order to prevent it from producing seeds.
Soybean yield was measured in mid-October by hand harvesting the pods from 10-row-feet of a middle row of each plot. Beans were separated from pods and collected using an Almaco thresher, then weighed. Yield loss in the treatments with single herbicide sites of action was determined by comparison to the more extensive treatments (Treatments 6-13). Yield loss of Treatment 11 was determined by comparison to the other extensive treatments. To provide an economic basis for comparison of each treatment, costs were estimated based on personal communications with several local custom applicators.
Objective 2.
In 2019, a 20-foot-wide electrical discharge system (“Weed Zapper ANNIHILATOR 8R30,” Old School Manufacturing LLC) was used in Cato, NY on August 1 in a soybean (R1) field with several different weed species that had survived an earlier herbicide application and were protruding up to 2’ above the crop canopy. The tractor was operated at 3 mph with 1000 rpm PTO speed, allowing the electrical discharge system to generate about 500 volts and up to 200 amps of alternating current electricity. Weed mortality was not evident on the day of implementation, therefore we returned on August 13 to informally assess control.
Results and discussion: Weed control was greatest for the two-pass treatments (Table 2) and for the treatments that included more than one herbicide from WSSA groups other than 2, 5, and 9. One exception was that the addition of Warrant to the tank mix of Roundup and XtendiMax may have caused a slight antagonistic effect on waterhemp control.
Site A did not have complete soybean canopy closure, which likely reduced the effectiveness of most treatments. Additionally, much of the waterhemp present in the post-emergence applications was likely larger than the suggested maximum height of 4”.
Although waterhemp was abundant at Site B in 2018, hand removal efforts prevented most of the weed seed production and very little waterhemp emerged for the trial in 2019. Therefore, waterhemp control is not shown for Site B. Conversely, few weeds other than waterhemp were present at Site A.
Soybean yield at Site A generally reflected effectiveness of waterhemp control. Yield losses would likely have been greater if the waterhemp had not been removed in mid-August. We found yield losses in Treatments 1, 2, 3, and 5 of 56%, 26%, 34%, and 20% respectively. Yields at Site B were less effected, reflecting less weed competition. Crop injury was visible from Cobra, with yield losses of 12% and 17% at Site A and Site B, respectively. Yield loss would likely have been greater in most treatments if waterhemp had not been manually removed in mid-August to prevent seed production.
The total cost for the materials and application of the more extensive treatments was generally more expensive (Table 2). But given that uncontrolled waterhemp could result in a loss of $300/A, more expensive weed control programs are justified. Even the most expensive treatment ($75/A) may make economic sense due to the short-lived seeds of waterhemp. That treatment provided 100% control of waterhemp, preventing the return of waterhemp seeds to the soil, thereby allowing the depletion of most of the waterhemp seedbank in four years (Mark Loux, personal communication) and return to less expensive control programs. Nonetheless, additional treatments will be investigated in 2020 to attempt to achieve 100% control with less cost.
Objective 2.
The electrical discharge system was very effective in controlling the contacted horseweed (marestail). Complete necrosis was observed for most treated plants. Some plants had green leaves near their base, but no new growth or lateral branching was observed. Common ragweed was also very effectively controlled. Annual sowthistle was mostly controlled, but green leaves persisted on about 25% of the plant. The highest branches of bull thistle (a biennial) exhibited complete necrosis, but lower branches that were untouched by the weed zapper remained unharmed.
It was evident that our August 1 application of the electrical discharge system was earlier than optimal because most of the horseweed had not yet exceeded the height of the crop canopy and was not contacted by the electrified rod. Therefore, to maximize the weed control from a single pass, scouting should be used to delay the application as late as possible, but before the weeds initiate seed production – likely mid- to late-August for most New York farms. For interested farmers, custom application of the electrical discharge system is available through Preferred Quality Grain LLC of Cato, NY.
Project location(s): Central and western New York.
Video:
Marshall, G., Brown, B. Waterhemp Control in Soybeans: 2019 Trials. NYSIPM. December 20, 2019. Accessed December 28, 2019. https://www.youtube.com/watch?v=WSAmMn2P7Wc
Acknowledgements: Thank you to the New York Farm Viability Institute for supporting this project.
Disclaimer: Read pesticide labels prior to use. The information contained here is not a substitute for a pesticide label. Trade names used herein are for convenience only; no endorsement of products is intended, nor is criticism of unnamed products implied. Laws and labels change. It is your responsibility to use pesticides legally. Always consult with your local Cooperative Extension office for legal and recommended practices and products. cce.cornell.edu/localoffices
Project Leaders: Bryan Brown, NYS IPM Program; Venancio Fernandez, Bayer Crop Sciences; Mike Hunter, Cornell Cooperative Extension; Jeff Miller, Oneida County Cooperative Extension; Mike Stanyard, Cornell Cooperative Extension
Collaborators: Derek Conway, Conway Farms; Jaime Cummings, NYS IPM Program; Quentin Good, Quentin Good Farms; Antonio DiTommaso, Cornell University; Michael Durant, Lewis County Soil and Water Conservation District; Kathleen Howard, Cornell University; Grace Marshall, NYS IPM Program; Scott Morris, Cornell University; Ali Nafchi, Cornell Cooperative Extension; Jodi Putman, Cornell Cooperative Extension; Joshua Putman, Cornell Cooperative Extension; Matthew Ryan, Cornell University; Lynn Sosnoskie, Cornell University; Ken Wise, NYS IPM Program
Summary: Herbicide resistant waterhemp has spread into New York and caused yield losses for corn farmers. This project aimed to find ways to regain control of this weed in corn and determine the compatibility of more extensive herbicide programs with interseeded annual ryegrass. Our field trial included several treatments that effectively controlled waterhemp. One of the most effective treatments was an integrated program utilizing a reduced rate herbicide, row cultivation, and interseeding. This treatment was slightly more expensive than the other two-pass treatments but the cost may be offset by the benefits of cover cropping. Of the several residual herbicides that were compatible with interseeded annual ryegrass, Callisto provided the most effective control of waterhemp.
Figure 1. Waterhemp competing with corn at a farm in Seneca County, NY.
Background and justification: In the past few years, herbicide resistant waterhemp has expanded into New York and is now present in 12 counties at the time of this publication. Corn farmers have reported yield losses of 20% due to this weed (Figure 1), even after herbicide applications. Our greenhouse spray chamber tests of waterhemp from three different locations in New York indicate that it is likely resistant to herbicides from WSSA groups 2, 5, and 9 (ALS inhibitors, photosystem II inhibitors, and EPSPS inhibitors, respectively). Effective control programs in other states have relied on herbicides from other groups as well as additional physical or cultural tactics. Pre-emergence applications of residual herbicides are often recommended in order to reduce both the burden placed on post-emergence applications.
However, residual herbicides can sometimes cause injury to succeeding crops. Cover crops interseeded into a corn crop are at particular risk of injury. Interseeding has grown in popularity as a way to include a winter cover crop, which can benefit soil health, reduce erosion, and provide weed suppressive residue. Interseeding typically occurs at corn growth stage V5 rather than waiting until after corn harvest, when it is oftentimes too late. Several prominent New York farmers have bought or built their own interseeders. Additionally, the Lewis County Soil and Water Conservation District and the Genesee River Coalition of Conservation Districts each have interseeders available for custom application.
Objectives: Objective 1. Evaluate the effectiveness of several different programs in controlling waterhemp in corn.
Objective 2. Assess the compatibility of residual herbicides with an interseeded cover crop.
Procedures: Objective 1.
The trial site was in Seneca County, NY on a field of Odessa silt loam soil where waterhemp had survived various herbicide applications and produced seed in 2018. In 2019, the ground was prepared for planting with a field cultivator on June 4, and planted on June 7. Pre-emergence applications were made after planting on June 7. Cultivation and interseeding occurred on July 12, while the other post-emergence treatments were applied on July 15. All treatments are listed in Table 1. For fertilizer, muriate of potash (0-0-60, 125 lbs K2O/A) was applied prior to tillage and urea nitrogen (46-0-0, 100 lbs N/A) was broadcast on July 12.
Plots were 25’ long and 10’ wide. Each treatment was replicated four times in a randomized complete block design. Spraying was conducted using a backpack CO2 sprayer with a 10’ boom. Spray volume was 20 gal/A applied at 40 psi. Row cultivation was achieved using a Double Wheel Hoe (Hoss Tools) with two staggered 6” sweeps (12” effective width). Two passes were made per row so that 24” of the 30” rows were cultivated. For Objective 1, interseeding was established by hand broadcasting annual ryegrass (Mercury Brand, “Ribeye”) at 20 lb/A.
Weed control was assessed on August 15 by collecting all aboveground weed biomass within a 2 ft2 quadrat. The quadrat was used four times per plot, placed randomly in the two middle rows of each plot. Weeds were placed in paper bags and dried at 113 degrees F for 7 days, then weighed. Control was calculated by subtracting the biomass of each treated plot from biomass of the untreated plots, dividing by the biomass of the untreated plots, and multiplying by 100. Waterhemp was the dominant species present in this trial. Other species did not provide enough data for comparison. All waterhemp was manually removed immediately after the weed control assessments in order to prevent it from producing seeds.
Corn grain yield was measured by first harvesting and weighing all ears in 10’ of a middle row of each plot on October 25. Weights were then adjusted based on the ratio of total ear weight to grain weight and then adjusted to 15.5% moisture based on subsamples that were completely dried (25 days at 113 degrees F). To provide an economic basis for comparison of each treatment, costs were estimated based on personal communications with several local custom applicators.
Objective 2.
This objective was conducted in Lewis County, NY on a field that did not contain any waterhemp. The field (Homer silt loam soil) was tilled June 9 and planted with silage corn (Pioneer, 95 day) on June 10 with 3 gal/A starter fertilizer (7-21-7). Pre-emergence herbicides were applied on June 12 and post-emergence on July 8. All treatments are listed in Table 2. Interseeding was conducted on July 10 using a 15’ interseeder (Interseeder Technologies) with three drills between each corn row operating at 0.5” depth. Annual ryegrass (Mercury Brand, “Ribeye”) was interseeded at 20 lb/A.
Weed control of the pre-emergence herbicides was evaluated on July 7 by visually estimating the percentage of the ground covered by the most prevalent species or categories – common lambsquarters, velvetleaf, other broadleaf species, and monocot species. This was done using the same quadrat system described above and control was calculated in a similar manner.
Performance of the annual ryegrass was assessed on September 20 by collecting the aboveground biomass using the quadrat system and drying samples at 113 degrees F for 7 days before weighing. Although there would have been more cover crop biomass later in the fall, silage harvest would likely have altered the results.
Results and discussion:
Objective 1.
Waterhemp control was most effective in treatments that utilized herbicides from WSSA groups other than 2, 5, or 9, or treatments that integrated non-chemical tactics. The pre-emergence-only and two-pass treatments were more effective than the post-emergence-only treatments. It was unexpected that the treatment with a reduced rate of Callisto followed by row cultivation and interseeding would control 100% of the waterhemp since most in-row weeds would have been uncontrolled by cultivation and the competition from the interseeded annual ryegrass would have been minimal.
Both the untreated control and the treatment of ResolveQ yielded 10% less than the treatments with more than one herbicide or tactic. Yield loss would likely have been greater in most treatments if waterhemp had not been manually removed in mid-August to prevent seed production. From personal communications with NY corn farmers who have waterhemp in their fields, a 20% yield loss can be expected in fields with poor control.
The two-pass programs were the most expensive, but were also the only treatments to offer 100% control of waterhemp. Several one-pass treatments offered 99% control with less expense, but the remaining 1% of uncontrolled waterhemp could likely produce enough seed to perpetuate the population.
Objective 2.
Early-season weed control was most effective for treatments containing Acuron or Callisto (Table 4) even though reduced rates were used. Weed control for the other treatments varied by weed species, which reflects their more common use in mixtures. Dual II Magnum and Warrant performed somewhat similarly, which was expected because they are both in WSSA group 15.
Annual ryegrass biomass of the grower standard (Treatment 2) was similar to several of the treatments containing residual herbicides (Table 4). Treatments with pre-emergence applications of Dual II Magnum, Sharpen, and Acuron affected annual ryegrass biomass, although the injury from Sharpen may have been confounded by the addition of ResolveQ in the post-emergence application. More injury to annual ryegrass was expected from Atrazine, but a heavy rain may have lessened its effect. A rainfall gage at the field showed that in the four weeks between the pre-emergence applications and the interseeding, the field received nearly 4” of rain, with 2” on June 20. Likewise, the post-emergence use of row cultivation in Treatment 10 may have lessened the effect of Acuron on annual ryegrass. Overall, Callisto stood out as the residual product that did not injure the annual ryegrass but also controlled waterhemp effectively in Objective 1.
Project location(s): Northern, western, and central New York.
Acknowledgements: Thank you to the New York Farm Viability Institute for supporting this project.
Disclaimer: Read pesticide labels prior to use. The information contained here is not a substitute for a pesticide label. Trade names used herein are for convenience only; no endorsement of products is intended, nor is criticism of unnamed products implied. Laws and labels change. It is your responsibility to use pesticides legally. Always consult with your local Cooperative Extension office for legal and recommended practices and products. cce.cornell.edu/localoffices
Sheryl Swink1, Tulsi Kharel1, Dilip Kharel1, Angel Maresma1, Erick Haas2, Ron Porter2, Karl Czymmek1,2, and Quirine Ketterings1 1Cornell Nutrient Management Spear Program, 2Cazenovia Equipment Company, 3PRODAIRY
Introduction
Reliable yield maps allow farmers and farm consultants to analyze yields per field, within fields, across fields and across years. Yield maps can be used to develop yield stability zones, or to identify reason(s) for low/high yielding areas by overlaying them with other geospatially tagged data such as elevation maps, soil series maps, etc. For reliable data, pre-harvest calibration of yield monitors and sensors should be followed up by careful operation in the field and proper post-harvest data cleaning in the office (Figure 1). This article presents best practices (pre-harvest, in-field, and post-harvest) that minimize yield monitor data errors and noise, reduce loss of data, and speed up data cleaning.
Pre-Harvest
Field naming. Develop a simple and consistent set of field IDs or names for each farm. Make sure all operators know and use the correct field identification. Using numbers eliminates spelling errors. Inconsistency in a field’s name from year to year results in extra, time consuming, post-harvest data clean-up.
Field boundaries. Establish and load geo-spatially fixed/frozen field boundary files into the Yield Monitor prior to harvesting. This will assist in maintaining the accuracy of field IDs. Preloading fixed field boundaries facilitates assignment of harvest data to the correct fields as the harvester moves from field to field. Follow the procedures in your Yield Monitor manual to load boundary files before harvest begins.
Calibrate. Calibration using accurate scale weights or a grain cart with load sensors will increase accuracy. When calibrating, harvest as you would normally do in average crop areas in the field (include variability in the field, not just the best part). Re-calibrate the yield monitor often – for each crop or even variety that is being harvested, and for significant changes in crop conditions (very dry to very wet). Check and zero the mass flow sensor every morning so that the sensor identifies crop flow accurately. Clean the lens of the moisture sensor and inspect for damage daily.
Field name/ID. Check to be sure correct field name/ID is entered or displayed before harvester enters a new field. Avoid inventing field names “on the fly.” Carefully check spelling if manually entering a field ID while harvesting. Misspelled or variations in field names from season to season make it difficult to match field data files across years for yield comparisons and within-field variability analysis. Proper field naming will ensure that yield data are assigned to correct field files.
Harvest speed. Maintain a steady harvest speed within the calibration range for your system. Yield data recorded outside of the calibration range will be less accurate (irregular and/or very slow or high velocities over parts of the field result in yield calculations errors).
Header height. Be sure the monitor logs a start and stop for each directional pass across the field to ensure data and yield area are logged properly. In most cases, the operator must lift the header beyond a set height to trigger the “stop logging” signal when exiting a pass or turning in the field. For some equipment, material flow can also be used to log the end of passes when the header is not raised for turning or for driving in the field without harvesting. Correctly logged field passes expedite trimming of unrepresentative start and end pass data points (ramping effect) during the cleaning process and proper shifting of data when correcting for flow and/or moisture delays relative to GPS location.
Swath width. Be sure the recorded swath width is the actual width harvested. If swath width is not recorded properly, the harvested area calculated is wrong and so is the yield value. If the GPS system of the yield monitor has a large positional error (e.g. WAAS), turn off the auto swath adjustment and manually enter the default swath/chopper width. When harvesting less than the default chopper width without auto-swath, manually adjust swath width of the pass in the yield monitor to avoid erroneous yield calculations.
Short rows. For long, narrow fields, plant and harvest rows the length of the field rather than the width if practical and consistent with soil conservation and other farm objectives. Short harvest passes distort yield data due to ramping velocity and flow impacts at the beginning and end of a pass, leaving few or no accurate data points in very short passes.
Multiple combines/choppers in the field. If using more than one combine or chopper on a field, harvest a discrete section of the field with each one rather than mixing their passes across the whole field. Differences between operators, equipment and sensors result in different flow and moisture delays. These factors, if interlaced across the field, make it difficult to properly clean data.
Post-Harvest
Do not risk losing the season’s data by just leaving it on your monitor or relying on the cloud to save it. Download the raw yield monitor data files periodically during the season. The data cleaning protocol requires raw data to be transferred into Ag Leader format. Save the original files, backing them up on thumb drives and on your computer.
In Summary
Reliable data are essential for making the right decisions in field management. Mitigating errors at the source reduces the amount of data loss when filtering out noise during the post-harvest data cleaning process. The accuracy of yield data depends not only on proper calibration of yield monitoring equipment prior to and during harvest, but also on operation in the field and post-harvest data cleaning. Data become more reliable and the data cleaning process can be accelerated with implementation of the pre-harvest, in-field, and post-harvest practices described in this article.
Acknowledgements
This work was co-sponsored by the United States Department of Agriculture, National Institute of Food and Agriculture, Agriculture and Food Research Initiative Bioenergy, Natural Resources and Environment program, grants from the Northern New York Agricultural Development Program (NNYADP), New York Farm Viability Institute, New York Corn Growers Association, and Federal Formula Funds. For questions about these results, contact Quirine M. Ketterings at 607-255-3061 or qmk2@cornell.edu, and/or visit the Cornell Nutrient Management Spear Program website at: http://nmsp.cals.cornell.edu/.