Cut-Off Date and Other Considerations for Xtendimax, Engenia and Tavium Applications in Dicamba-Tolerant Soybeans

Vipan Kumar1, Lynn Sosnoskie2, Mike Hunter3, Mike Stanyard4

1School of Integrative Plant Sciences -Soil and Crop Sciences Section, Cornell University, Ithaca, NY 14853, 2School of Integrative Plant Sciences – Horticulture Section, Cornell AgriTech, Geneva, NY 14456, 3Cornell Cooperative Extension North County Regional Ag Team, 4Cornell Cooperative Extension Northwest New York Dairy, Livestock, and Field Crops Program

With recent rainfall events and a new flush of summer annual weeds, NY producers are busy applying postemergence herbicide applications in row crops. If you have planted dicamba-tolerant soybeans and are planning for postemergence applications of dicamba-containing products (Xtendimax, Engenia, or Tavium), the following points need to be considered.

    • Xtendimax, Engenia and Tavium are the only dicamba-containing products that are labelled in dicamba-tolerant soybeans (Roundup Ready 2 Xtend or XtendFlex soybeans).
    • Be sure of your trait technology! Do not confuse Xtend traits with Enlist traits. Enlist traits provide crop resistance to 2,4-D but not to dicamba.
    • As per the revised labels in 2021, the legal last day of postemergence applications of Xtendimax, Engenia and Tavium in dicamba-tolerant soybeans is June 30.
    • Only certified applicators with dicamba training are allowed to apply these products.
    • Spray records need to be created within 3 days of applications of these products and should be maintained for 2 years. (Note: In New York State all applications of restricted use pesticides must be maintained for at least three years)
    • An approved drift reduction agent (DRA) and volatility reduction agent (VRA) should be included.
    • Only approved nozzles and tank-mix partners should be used for these products.
    • Wind speed at boom height should range from 3 to 10 miles per hour at the time of application.
    • As per the labels, maximum ground speed of sprayer should not exceed 15 miles per hour and maximum boom height above target pest or crop canopy should not exceed 24 inches.
    • Survey surrounding fields ahead of dicamba applications for sensitive crops (e.g., grapes, fruit trees, snap beans, fruiting vegetables (e.g., tomatoes, peppers), soybeans without dicamba-tolerance trait technology, etc…).
    • DO NOT apply these products if sensitive crops are in a downwind field or a run-off producing rain event is in the forecast in the next 48 hours.
    • After determining no adjacent sensitive crops are downwind, maintain a 240-feet downwind buffer.
    • Stop spraying if winds change direction towards sensitive crops.
    • DO NOT apply dicamba products during temperature inversions. Only spray between one hour after sunrise and two hours before sunset.
    • Ensure the entire sprayer system is properly cleaned before and after dicamba applications are made.
    • Applicator should consult Bulletins Live Two website to make sure no endangered species will be affected by these dicamba applications.

Disclaimer: Brand names appearing in this publication are for product identification purposes only. Persons using such products assume responsibility for their use in accordance with current label directions of the manufacturer.

Tillage Intensity Classification for Greenhouse Gas (GHG) Emission Estimations

Corrine Brown1, Olivia Godber1, Kirsten Workman1,2, Kitty O’Neil3, Josh Hornesky4, Quirine Ketterings1

1Nutrient Management Spear Program, 2PRODAIRY, Cornell University, Ithaca, NY 14853, 3Cornell Cooperative Extension North Country Regional Ag Team, 4USDA-Natural Resources Conservation Service, NY

Introduction

Tillage practices can impact soil greenhouse gas (GHG) emissions, soil carbon (C) sequestration and overall soil health. Tools are available to estimate whole farm GHG inventories (N2O, CO2, and CH4 emissions), field-based emissions, and C sequestration or loss. These tools often require a user to classify tillage intensity. The Natural Resources Conservation Service (NRCS) GHG accounting system uses the Revised Universal Soil Loss Equation (RUSLE2) to calculate a Soil Tillage Intensity Rating (STIR) that can be used to classify the intensity of various tillage practices. This tool also classifies tillage intensity based on percent residue surface cover and soil disturbed. This article explains what a STIR factor is, describes how to determine percent surface residue cover, and categorize different tillage practices into tillage intensity classifications.

Soil Tillage Intensity Rating (STIR)

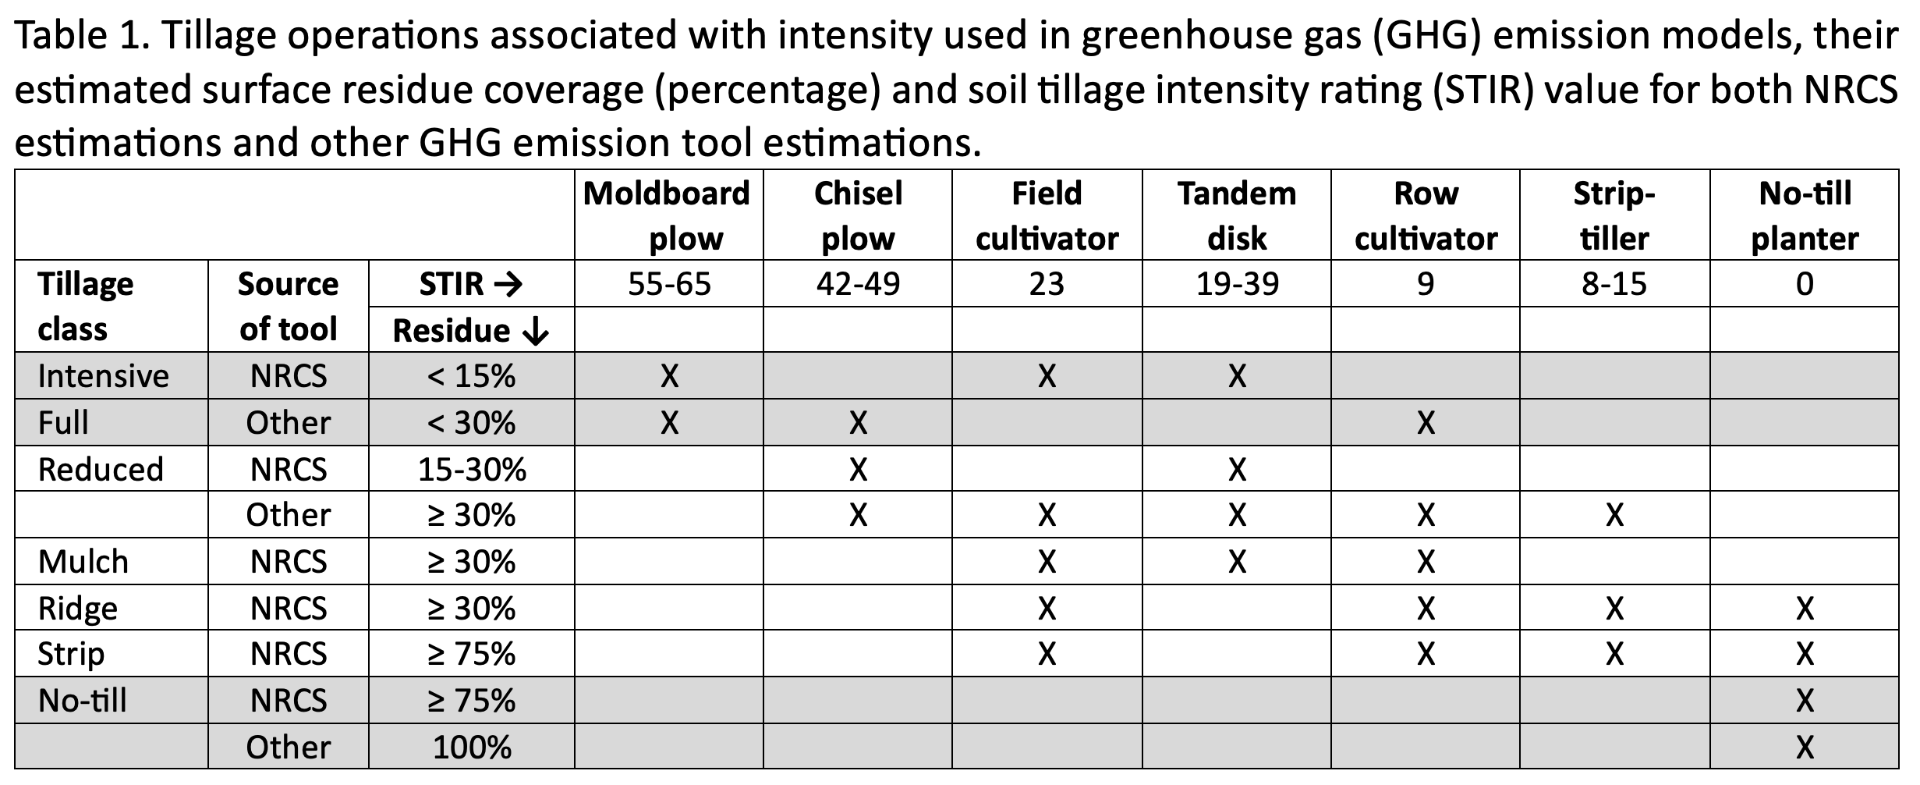
The STIR value of a field can range from 0-200 with high values for intense tillage (Table 1). The STIR is based on four components: tillage type, depth of operation, operational speed, and percent of soil surface area disturbed.

    • Tillage type: This describes how a tillage pass mixes soil and crop residue. Tillage disturbance operations can include inversion and some mixing of soil, mixing and some (limited) inversion, lifting and fracturing, mixing only, and soil compression.
    • Depth of operation: The depth to which soil disturbance and residue incorporation occur.
    • Operational speed of tillage: This is the recommended operating speed of each tillage operation. The forward speed of a tillage implement impacts soil disturbance and mixing; faster speeds result in more significant forces and broader disturbance.
    • Percent of soil surface area disturbed: The percentage of surface soil disturbed by the tillage pass.

Estimating Percent Residue Cover

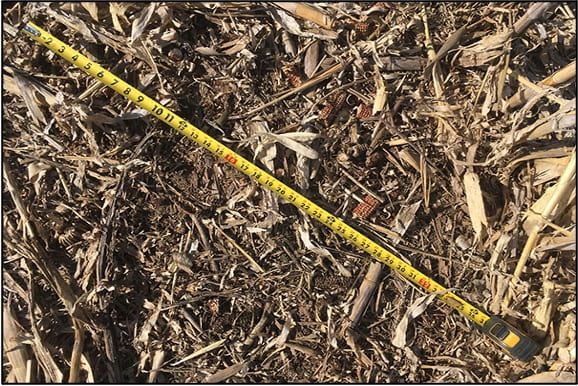
Percent residue cover remaining on the surface following a tillage operation can be determined using the RUSLE2 equation or measured in the field using the line transect method. The line transect uses a line measuring tool (a rope or tape measure) that has 100 equally distributed and easily viewed marks (Figure 1). Typically, the measuring tool is 100 feet long with markings at 1-foot intervals or 50 feet long with marking at 6-inch intervals. To determine the percent residue surface cover of a field, stretch the tool diagonally across crop rows in a direction that is at least 45 degrees off the row direction and count the number of markings that have crop residue directly present beneath. Residue smaller than 1/8 inch in diameter should not be counted. The total count (markings with residue beneath them) is the percent residue cover for the field. This process should be repeated at least three times in different areas of the field and percentages should be averaged.

Agricultural field with residue and tape measure
Fig. 1: A simple measuring tape can be used to easily determine percent residue surface cover of a field (Picture credit:
https://www.sdsoilhealthcoalition.org/ soil-health-assessment-card/).

NRCS Tillage Intensity Classes

The NRCS tool groups tillage practices into six categories; intensive, reduced, mulch, ridge, strip, and no-till:

    • Intensive tillage is full width tillage that inverts soil with high disturbance. Common equipment includes a moldboard plow.
    • Reduced tillage occurs at full width without soil inversion, using a point chisel plow, field cultivator and/or tandem disk.
    • Mulch tillage a single pass across the field using tools such as a tandem disk followed by field or row cultivator or similar implement.
    • Ridge tillage creates soil ridges in the field that are rebuilt during cultivation by disturbing up to 1/3 of the row width. The soil is then undisturbed from harvest to planting.
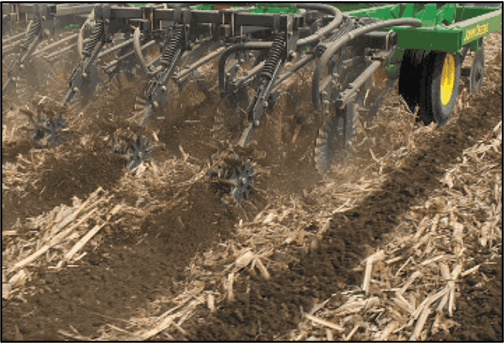
    • Strip tillage leaves the soil between crop rows undisturbed (Figure 2). To create a seedbed, up to 1/3 of the row width is disturbed.
    • No-till operations plant crop seeds directly through residue of the previous crop using a no-till planter or drill.
Agricultural field with strip tillage
Figure 2: Strip tillage leaves the soil between crop rows undisturbed.

Full vs. Reduced vs. No-Till

Some GHG footprint assessment tools categorize tillage practices differently, using three main categories; full, reduced, and no-till:

    • Full tillage contributes to significant soil disturbance, fully inverting the soil (as is done with moldboard plowing) and/or performing tillage operations frequently in the same year using tools like chisel plows or row cultivators.
    • Reduced tillage also disturbs the soil but does not fully invert the soil. Examples include onetime use of chisel plows, field cultivators, tandem disks, row cultivators, or strip-tillers.
    • No-till practices directly drill crop seed through the residue layer with little to no disturbance to the soil. Minimal disturbance occurs in the area where seeds are planted. Common operations use a no-till planter.

In Summary

Tools available to assess whole-farm and field-based GHG inventories and C sequestration or loss require the user to classify tillage intensity. Choosing the tillage description that best fits the producers’ management practices is essential for accurately assessing GHG emissions.

Additional Resources

Acknowledgements

This article is available as part of the Cornell Nutrient Management Spear Program (NMSP) Factsheet Series: http://nmsp.cals.cornell.edu/publications/factsheets/factsheet126.pdf. Corrine Brown was an undergraduate intern with NMSP, funded by a gift from Chobani. For questions, contact Quirine M. Ketterings (qmk2@cornell.edu) or visit the NMSP website at: http://nmsp.cals.cornell.edu/.

Creating a New York Soybean Yield Database

Julianna Lee1, Manuel Marcaida III1, Jodi Letham2, and Quirine Ketterings1
1Cornell University Nutrient Management Spear Program and 2Cornell Cooperative Extension Northwest New York Dairy, Livestock and Field Crops

Soybeans acres and yield

Soybeans are an important crop for New York with a total land base of 325,000 acres harvested in 2022. Average yields are reported each year by the United States Department of Agriculture, National Agricultural Statistics Service (USDA-NASS) in New York’s Agricultural Overview. Their records these past 14 years show a range in yield from a low of 41 bu/acre in 2016 to a high of 53 bu/acre in 2021, averaging 46.5 bu/acres at 87% dry matter. While state averages are reported yearly, there is little documentation of yield per soil type. In the past three years, we have worked with soybean growers to collect soybean yield monitor data and determine the first soil type specific yield records. This project was started because knowing soil- and field-specific yield potentials for soybean can help farmers make better informed crop management and resource allocation decisions, including fertilizer and manure use decisions.

What’s Included in the Soybean Database so Far?

Whole-farm soybean yield monitor data, shared by farmers in central and western New York, were cleaned using Yield Editor prior to overlaying of soil types as classified by the Web Soil Survey. To generate soil type-specific yield distributions, analyses were limited to soil types with yield data for at least: (1) 3 acres of total area within an individual field; (2) 150 acres total across all fields and farms; and (3) in three different farms. These qualifiers resulted in a database (to date) of 9,653 acres of yield data collected across 13 farms in New York with information for 14 soil types. Of the total acres, about 90% was from 2017-2021 (with data going back to 2009). Density plots were generated to determine yield distributions per soil type. Varietal differences were not considered in the analysis.

What Did we Find?

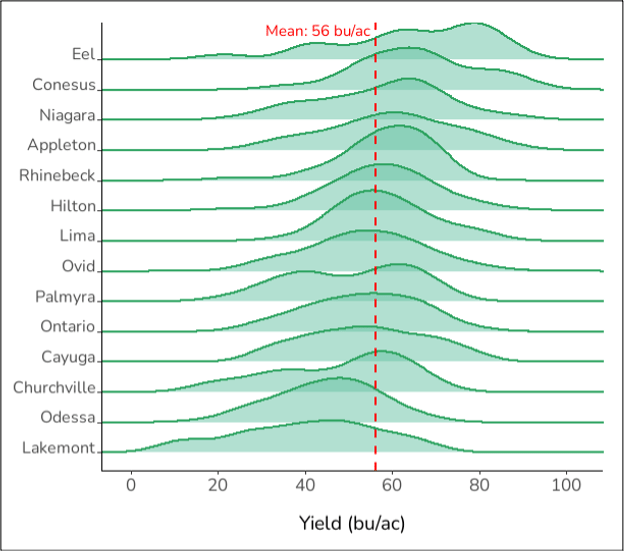
The calculated area weighted average yield for New York was 56 bu/acre with a standard deviation of 14 bu/acre. This average is considerably higher than the 46.5 bu/acre reported in New York’s Agricultural Overview for the same time period. Soil type specific means ranged from 40 bu/acre (Lakemont) to 66 bu/acre (Conesus) but yield distributions showed large ranges (from low to high) for all 14 soil types (Figure 1). For some soil types, the density plots showed multiple peaks which may reflect farm-to-farm, field-to-field, variety, management, as well as weather differences. Except for 2014, the mean yield based on farmer data exceeded state averages reported in New York’s Agricultural Overview.

What’s Next?

Knowing soil- and field-specific yield potentials for soybean can help a farmer make crop management and resource allocation decisions, including use and rate of fertilizer and manure. With more farmers sharing their soybean yield data, this summary will become more representative for the state and additional soil types for which too few acres of yield data are available currently, may be included in future years. We invite New York soybean growers to share they yield data with us to build on this data summary. Farmers who share data obtain their farm-specific yield report. This includes an annual update that summarized their cleaned yield data, a multiyear report once three years are collected, and yield stability-based zone maps for all fields with at least three years of soybean yield data.

Graph of soybean yield density plots by soil type.
Figure 1. Soybean yield density plots based on the different soil types from the cleaned soybean yield monitor database from 2009 to 2021.

Acknowledgments

We thank the farmers who shared their yield monitor data with us. This project is sponsored by the New York Corn and Soybean Association and USDA-NIFA Federal Formula Funds. We thank Abraham Hauser and Anika Kolanu for help with cleaning and processing yield monitor data. For questions about this project, contact Quirine M. Ketterings at 607-255-3061 or qmk2@cornell.edu, and/or visit the Cornell Nutrient Management Spear Program website at: http://nmsp.cals.cornell.edu/.