Olivia Godber1, Mart Ros1, Agustin Olivo1, Kristan Reed2, Mike van Amburgh2, Kirsten Workman1,3, and Quirine Ketterings1
1Nutrient Management Spear Program, 2Department of Animal Science, 3PRODAIRY, Cornell University, Ithaca, NY 14853
The Cornell whole farm nutrient mass balance (NMB) is an assessment tool that farms can use to calculate their nitrogen (N), phosphorus (P) and potassium (K) use efficiency at the farm level. By calculating the difference in the amount of nutrients imported into and exported out of the farm in a given calendar year, the amount of nutrients remaining on the farm or lost to the environment can be estimated (Figure 1).
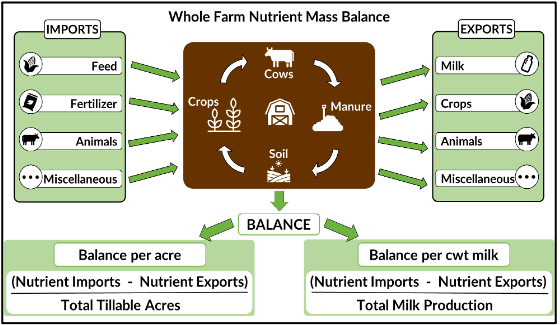
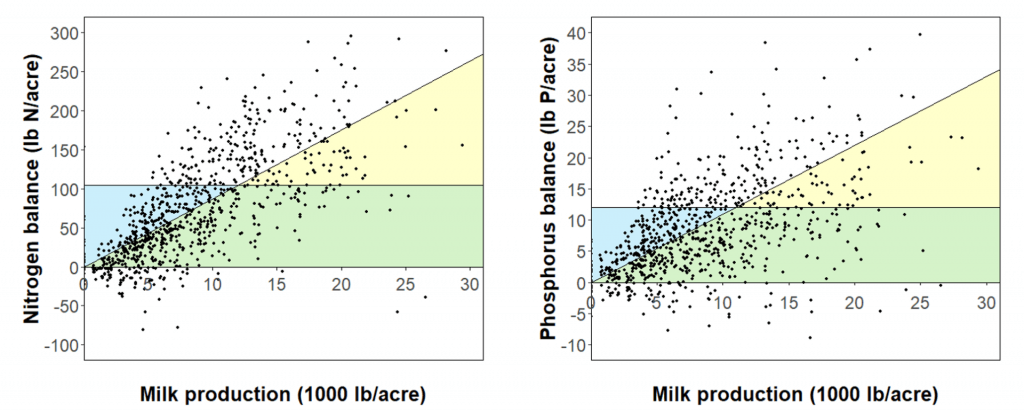
The balance per acre indicates how well the farm is putting nutrients to use on the farm, and the risk of losing nutrients to the environment. The balance per cwt milk indicates how efficiently the farm is using nutrients to produce milk. A positive P and K balance indicates soil buildup and potential losses for those nutrients over time. Nitrogen is more difficult to retain from one year to the next so a large portion of the N balance will be lost to the environment. Negative balances are undesirable as that can lead to yield losses and soil mining of P and K. Feasible balances were set for New York, 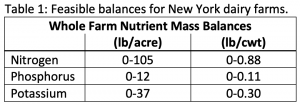 based on data from 102 dairy farms (Table 1). Feasible limits are positive (>0) to account for unavoidable losses, inevitable in all biological systems.
The ideal situation is for a farm to fall within the optimal operational zone (or “Green Box”; Figure 2). A farm falls within the Green Box when both the balance per acre, and the balance per cwt of milk are within the feasible limits. When this is the case, there is a lower risk of losing nutrients to the environment, greater nutrient use efficiency, and being within the Green Box can have both economic and environmental gains for the farm.
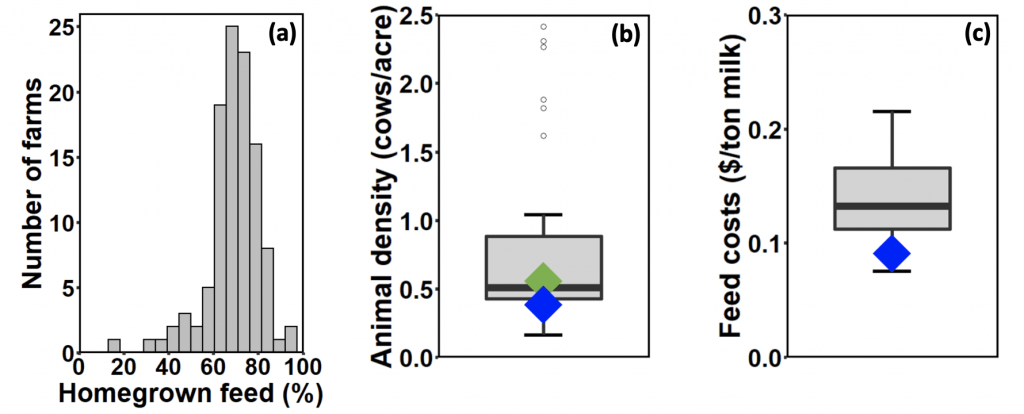
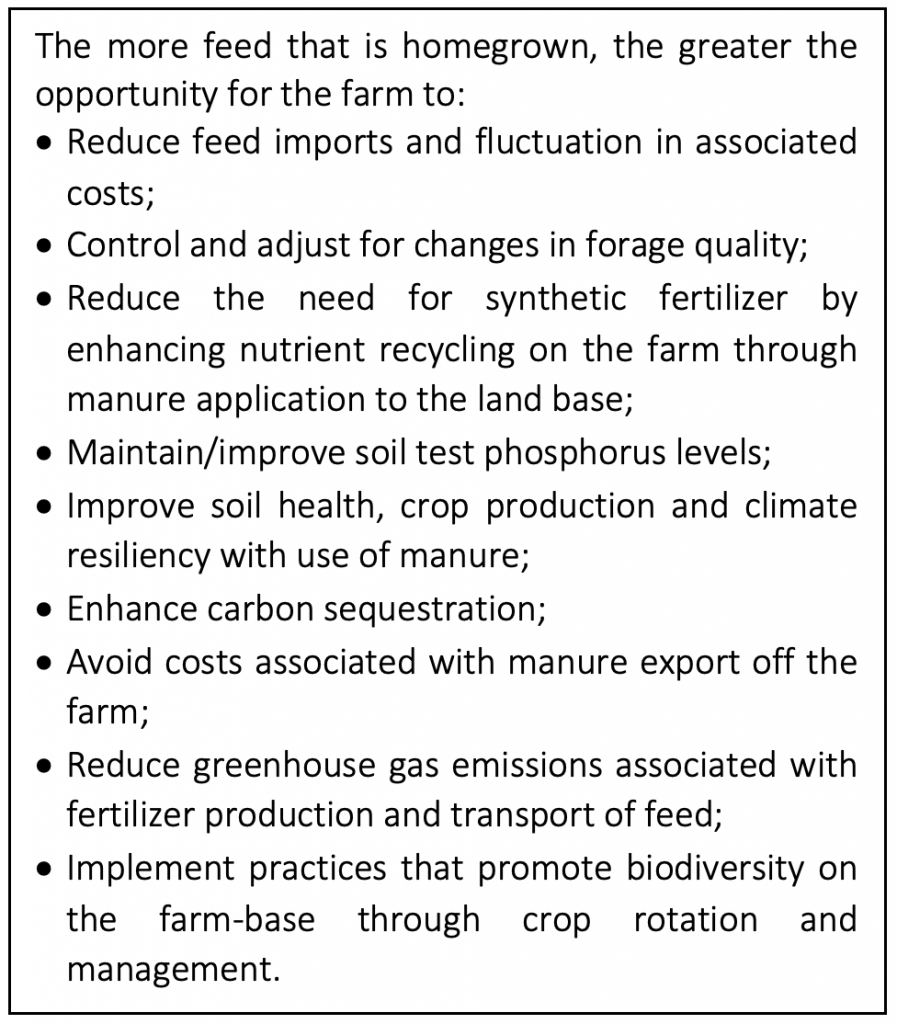
Key drivers of excessive balances include animal density, the proportion of feed produced on the farm, feed use efficiency, and fertilizer use. Fine-tuning fertilizer use and the amount of crude protein (CP) and P in animal feed, as well as increasing the production of homegrown feed, can help to improve balances. When animal density increases above one animal unit (AU) per acre (where 1 AU = 1000 lb; a cow and her replacement is roughly two animal units), manure exports become increasingly important to meet the feasible balances, especially for P.
The Good News!
There has been great progress in the reduction of P balances of New York dairy farms. Farmers who conducted the NMB assessment in 2017-2019 had balances of 0.07 lb P/cwt (Table 2). Farms in the assessment in 2005-2007, had balances of 0.11 lb P/cwt. This shows tremendous improvement in P use efficiency while the P balance per acre only slightly increased (0.1 lb P/acre) and still below the feasible balance of 12 lb P/acre established for New York.
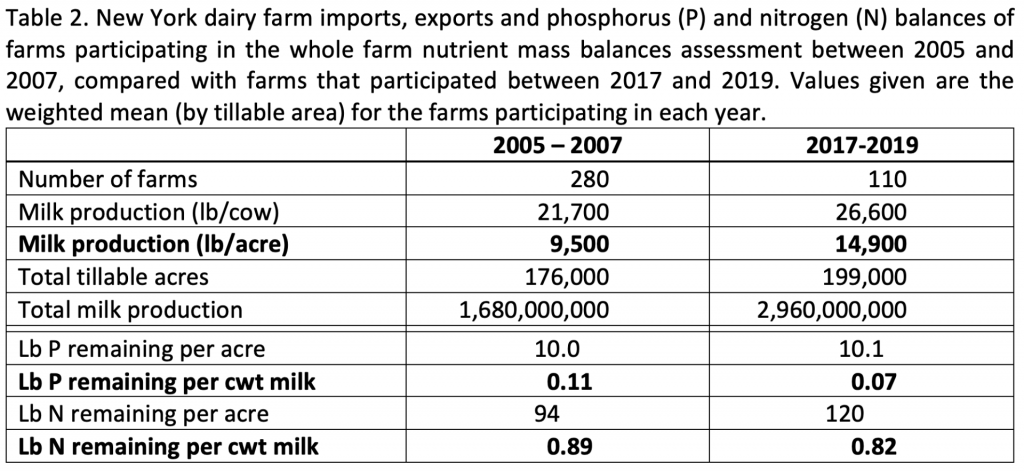
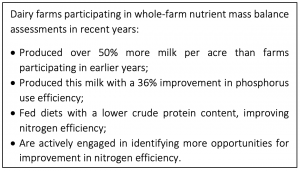 Did farmers give up milk? No! The average milk production per acre was 9,500 lb/acre in 2005-2007 (0.81 AU/acre), compared to 14,900 lb/acre in 2017-2019 (1.10 AU/acre). Overall, farms participating in 2017-2019 produced more milk, on less land, with no major change in the environmental impact (in terms of P) compared to farms participating in 2005-2007.
For N, the balance per cwt decreased from 0.89 to 0.82 lb N/cwt (CP of the diet went from 16.1% to 15.5%). The footprint per acre increased by 26 lb N/acre, reflecting both the higher animal density, and increased N fertilizer use of the farms in the 2017-2019 dataset. However, if no progress had been made in N management, particularly the lower CP content of the diets and increased milk yields, the increase in animal density of the more recent summary would have placed the farms even further outside of the Green Box for lb N/acre (closer to 128 lb N/acre, based on the performance of the farms in 2005-2007). Thus, for N this is also a good news story, but continued effort in management of N imports, exports and efficiency of use is needed for the N balance to be within the Green Box.
Next Steps?
It is clear from the data collected by the farmers in these NMB assessments that there has been tremendous progress in lowering the amount of N and P used to produce milk by dairy farmers in New York. Future work should focus on further reducing the CP content of cow diets without compromising performance, and optimizing manure storage and land application systems (e.g. timing, injection or incorporation) to minimize N losses from manure and reduce the reliance on fertilizer imports. For higher density farms, exploring options for cost-effective manure export should also be a focus. Improving N management on the farm will not only have the potential to improve N balances and farm economics, but also reduce nitrous oxide (N2O) emissions, a potent greenhouse gas.
Acknowledgements
We thank the farmers and farm advisors as well as many past and current NMSP team members who worked on the whole farm nutrient mass balance project with us over the past 15+ years. This research is funded primarily by a gift from Chobani, in addition to Federal Formula Funds, and grants from the Northern New York Agriculture Development Program (NNYADP), Northeast Region Sustainable Agriculture and Education (NESARE), New York State Department of Environmental Conservation (NYDEC). For questions about these results, contact Quirine M. Ketterings at qmk2@cornell.edu, and/or visit the Cornell Nutrient Management Spear Program website at: http://nmsp.cals.cornell.edu/.


