Julianna Lee1, Manuel Marcaida III1, Jodi Letham2, and Quirine Ketterings1
1Cornell University Nutrient Management Spear Program and 2Cornell Cooperative Extension Northwest New York Dairy, Livestock and Field Crops
Soybeans acres and yield
Soybeans are an important crop for New York with a total land base of 325,000 acres harvested in 2022. Average yields are reported each year by the United States Department of Agriculture, National Agricultural Statistics Service (USDA-NASS) in New York’s Agricultural Overview. Their records these past 14 years show a range in yield from a low of 41 bu/acre in 2016 to a high of 53 bu/acre in 2021, averaging 46.5 bu/acres at 87% dry matter. While state averages are reported yearly, there is little documentation of yield per soil type. In the past three years, we have worked with soybean growers to collect soybean yield monitor data and determine the first soil type specific yield records. This project was started because knowing soil- and field-specific yield potentials for soybean can help farmers make better informed crop management and resource allocation decisions, including fertilizer and manure use decisions.
What’s Included in the Soybean Database so Far?
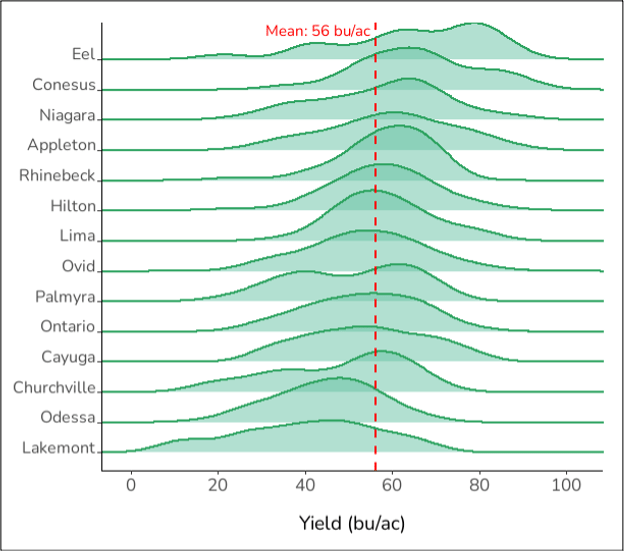
Whole-farm soybean yield monitor data, shared by farmers in central and western New York, were cleaned using Yield Editor prior to overlaying of soil types as classified by the Web Soil Survey. To generate soil type-specific yield distributions, analyses were limited to soil types with yield data for at least: (1) 3 acres of total area within an individual field; (2) 150 acres total across all fields and farms; and (3) in three different farms. These qualifiers resulted in a database (to date) of 9,653 acres of yield data collected across 13 farms in New York with information for 14 soil types. Of the total acres, about 90% was from 2017-2021 (with data going back to 2009). Density plots were generated to determine yield distributions per soil type. Varietal differences were not considered in the analysis.
What Did we Find?
The calculated area weighted average yield for New York was 56 bu/acre with a standard deviation of 14 bu/acre. This average is considerably higher than the 46.5 bu/acre reported in New York’s Agricultural Overview for the same time period. Soil type specific means ranged from 40 bu/acre (Lakemont) to 66 bu/acre (Conesus) but yield distributions showed large ranges (from low to high) for all 14 soil types (Figure 1). For some soil types, the density plots showed multiple peaks which may reflect farm-to-farm, field-to-field, variety, management, as well as weather differences. Except for 2014, the mean yield based on farmer data exceeded state averages reported in New York’s Agricultural Overview.
What’s Next?
Knowing soil- and field-specific yield potentials for soybean can help a farmer make crop management and resource allocation decisions, including use and rate of fertilizer and manure. With more farmers sharing their soybean yield data, this summary will become more representative for the state and additional soil types for which too few acres of yield data are available currently, may be included in future years. We invite New York soybean growers to share they yield data with us to build on this data summary. Farmers who share data obtain their farm-specific yield report. This includes an annual update that summarized their cleaned yield data, a multiyear report once three years are collected, and yield stability-based zone maps for all fields with at least three years of soybean yield data.

Acknowledgments
We thank the farmers who shared their yield monitor data with us. This project is sponsored by the New York Corn and Soybean Association and USDA-NIFA Federal Formula Funds. We thank Abraham Hauser and Anika Kolanu for help with cleaning and processing yield monitor data. For questions about this project, contact Quirine M. Ketterings at 607-255-3061 or qmk2@cornell.edu, and/or visit the Cornell Nutrient Management Spear Program website at: http://nmsp.cals.cornell.edu/.


