Michael R. Fulchera, Gary C. Bergstroma, Mark E. Sorrellsb, and David Benscherb aPlant Pathology and Plant-Microbe Biology Section and bPlant Breeding and Genetics Section, School of Integrative Plant Science, Cornell University, Ithaca, NY
Crown rust is a continuing threat to oat production in New York, and recent epidemics have cast a spotlight on this disease. To better advise growers on crown rust management, we examined the impact of crown rust on oat grain yields and the disease resistance of available and soon to be available varieties.
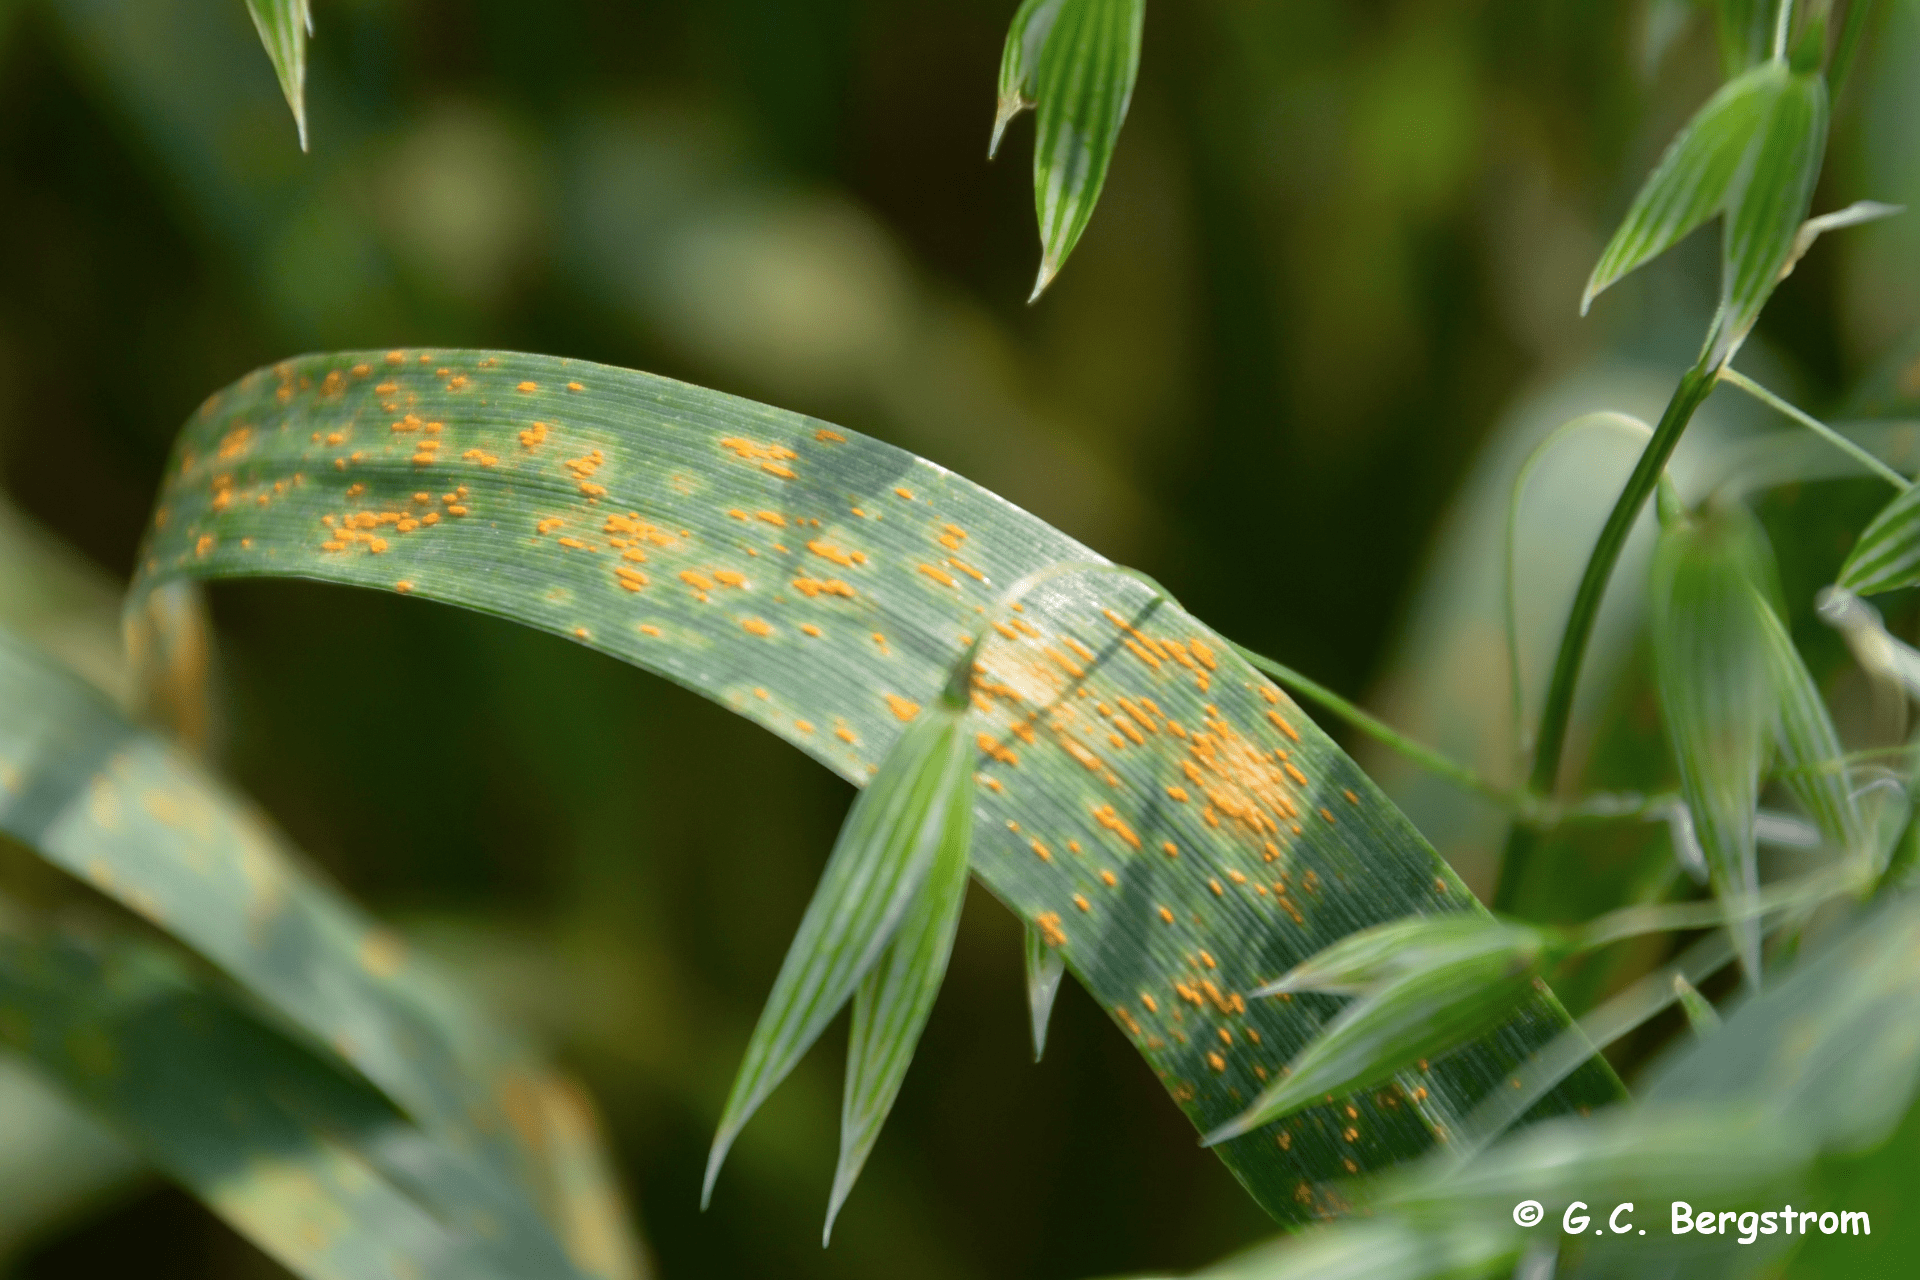
The fungal pathogen that causes this disease, Pucciniacoronata var. avenae, is widespread in New York and often found on susceptible oat varieties. Characterized by bright-orange, blistering pustules, this disease can be seen from June through August (Figure 1). Once established in a field, disease progresses quickly as the spores of the fungus are dispersed by the wind. The spores are blown to new leaves, different plants and even other fields. Older crown rust lesions develop a black rust spore stage, and these spores can infect the alternate host, common buckthorn, providing early inoculum for oat infections in fields adjacent to infected buckthorn in the following May.
Figure 1. Orange-brown uredinial pustules (bearing urediniospores) of crown rust on oat leaves.
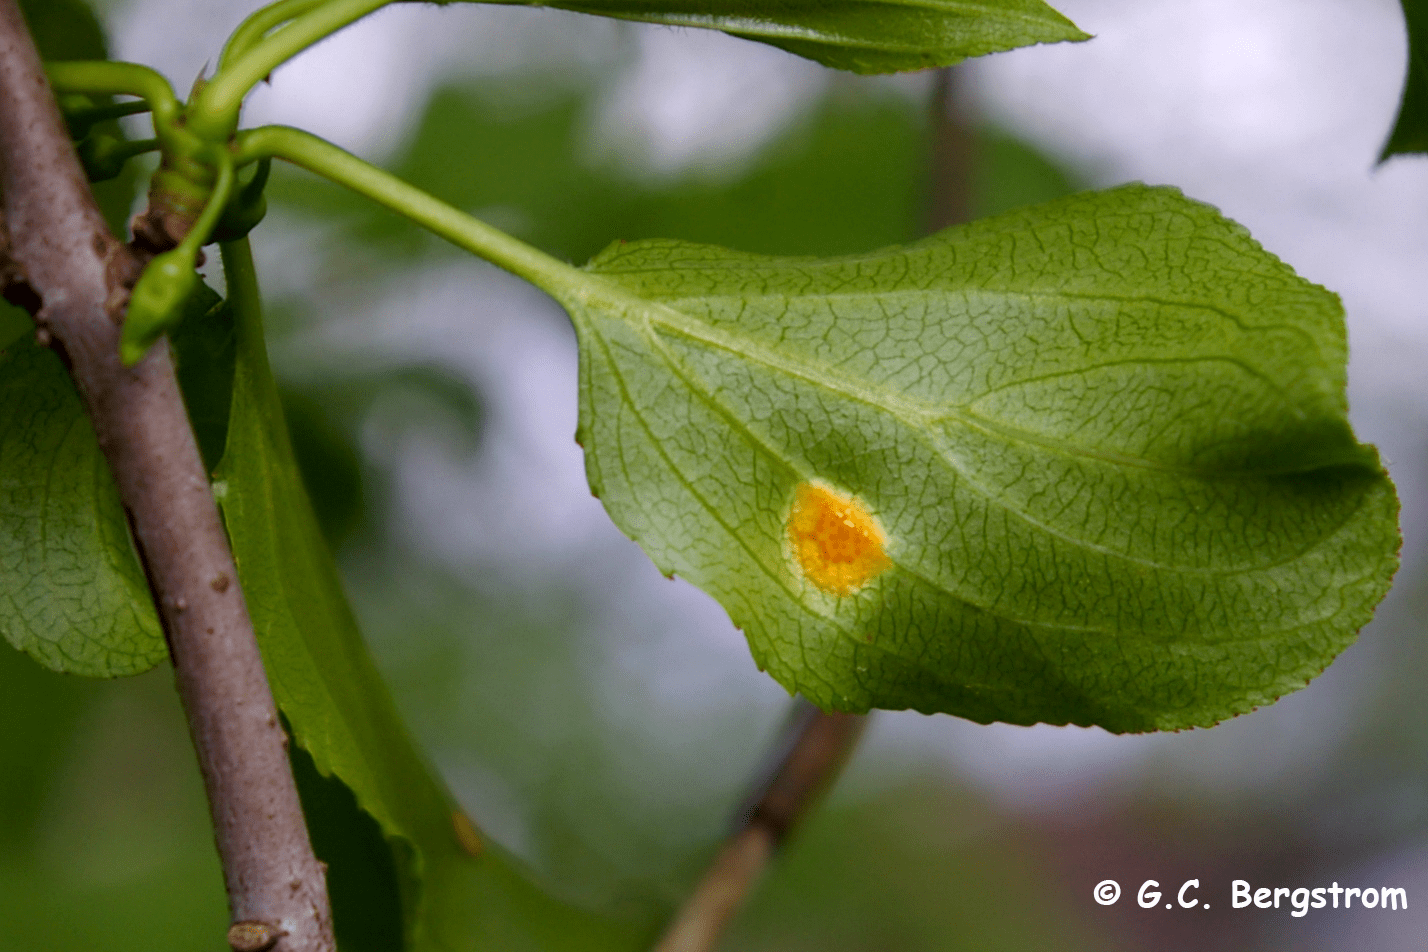
The pathogen requires living plants to survive so it rarely persists through the winter on oat in New York. However, viable crown rust spores from maturing oat crops in states to our south arrive in New York on wind currents each spring to commence annual epidemics. Some overwintering can occur in New York when the fungus moves back and forth between oat and common buckthorn (Figure 2).
Figure 2. Yellow-orange aecia (bearing aeciospores) of crown rust on buckthorn leaves in May.
Management of crown rust is best achieved through careful selection of an oat variety. Few options exist to combat the disease after plants are in the field. Some fungicides are labelled for crown rust control in New York, and some growers have realized a return in investment from a timely fungicide spray at or prior to panicle emergence. Crown rust significantly impacts the yield of susceptible varieties and in extreme cases may cause crop failure. Even slight visual symptoms around the soft dough growth stage can translate to yield loss (Figure 3). Rust pathogens are known to evolve quickly to overcome resistance, but based on several years of observation we have identified the varieties that currently are most resistant in New York (Table 1). If you are considering a spring oat planting, choose a variety with proven resistance to current populations of the crown rust fungus in New York.
Figure 3. Effect of crown rust infection on oat yields. Crown rust infection can significantly impact spring oat yields. This plot shows the average predicted yields observed at different disease severities. This data was taken from 360 small research plots spread across western, central and eastern New York in 2015-17. The amount of crown rust damage to flag leaves in each plot was measured during early grain filling. Even when visual disease severity recorded at the soft dough growth stage appears as low as 5%, yield may be limited by crown rust.
Late summer forage plantings are at a higher risk for infection since the spores that cause disease will increase and spread throughout the growing season. When these forage plantings are infected, pathogen overwintering on buckthorn can be increased. This contributes to crop epidemics the following year and may speed the breakdown of oat varietal resistance.
Crown rust will continue to threaten oat yields, but you can reduce the spread of this disease by planting resistant varieties and notifying your local Cornell Cooperative Extension Field Crop Specialist or the Cornell Field Crops Pathology Program if you find the pathogen in your fields.
Reference on the complete study:
Fulcher, M.R., D. Benscher, M.E. Sorrells, and G.C. Bergstrom. 2020. Preserving spring oat yields in New York through varietal resistance to crown rust.Plant Health Progress Published On-line 21 January 2020 https://apsjournals.apsnet.org/doi/10.1094/PHP-05-19-0037-RS
Bill Cox, John Hanchar, Eric Sandsted, and Mark Sorrells
The organic corn-soybean-wheat/red clover rotation was the most profitable rotation from 2015 to 2018.
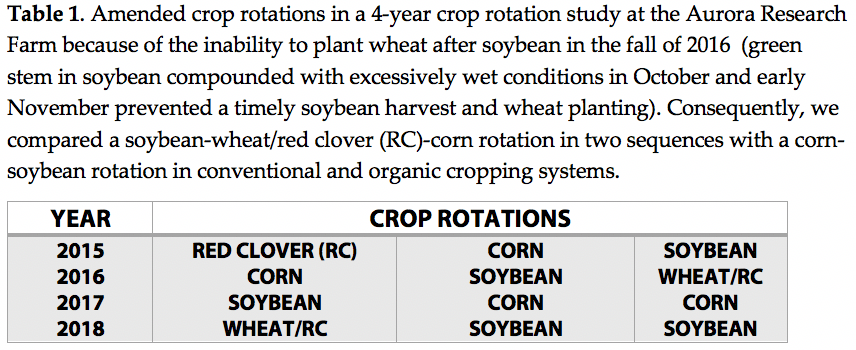
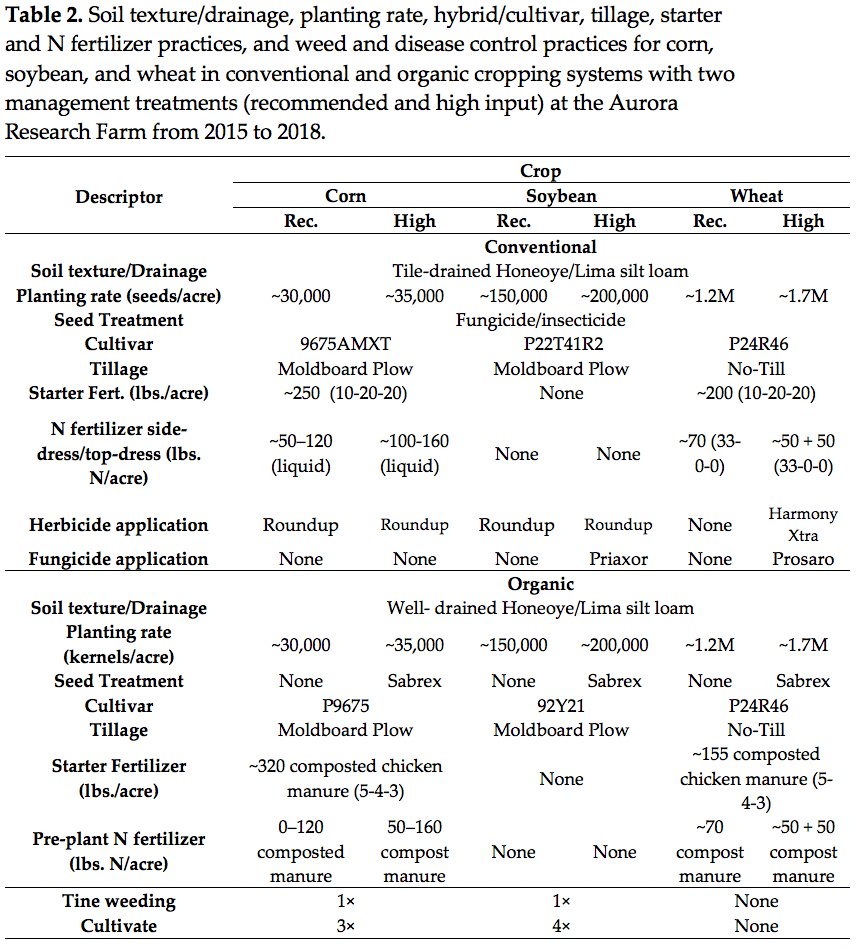
We conducted a 4-year study at the Aurora Research Farm from 2015 to 2018 to compare different sequences of the corn, soybean, and wheat/red clover rotation in conventional and organic cropping systems under recommended and high input management. Unfortunately, we were unable to plant wheat after soybean in the fall of 2016 because green stem in soybean, compounded with very wet conditions in October and early November, delayed soybean harvest until November 9, too late for wheat planting. Consequently, corn followed soybean as well as wheat/red cover in 2017 so we compared two sequences of the corn-soybean-wheat/red clover rotation with a corn-soybean rotation (Table 1). Please refer to previous What’s Cropping Up? articles from 2015 to 2018 for the various inputs for each crop for each year within each cropping system (https://scs.cals.cornell.edu/extension-outreach/whats-cropping-up/). Also, you can refer to Table 2 for a general overview of the management inputs for each crop within cropping systems across years. This article will first discuss the economics of the three crops in Year 3 or 4 of the study. We will then discuss the economics of the three rotations during the 36-month transition period (Year 1 and 2 of the study), the 2-year period after the transition (when the organic premium is in place), and the total 4 years of the study.
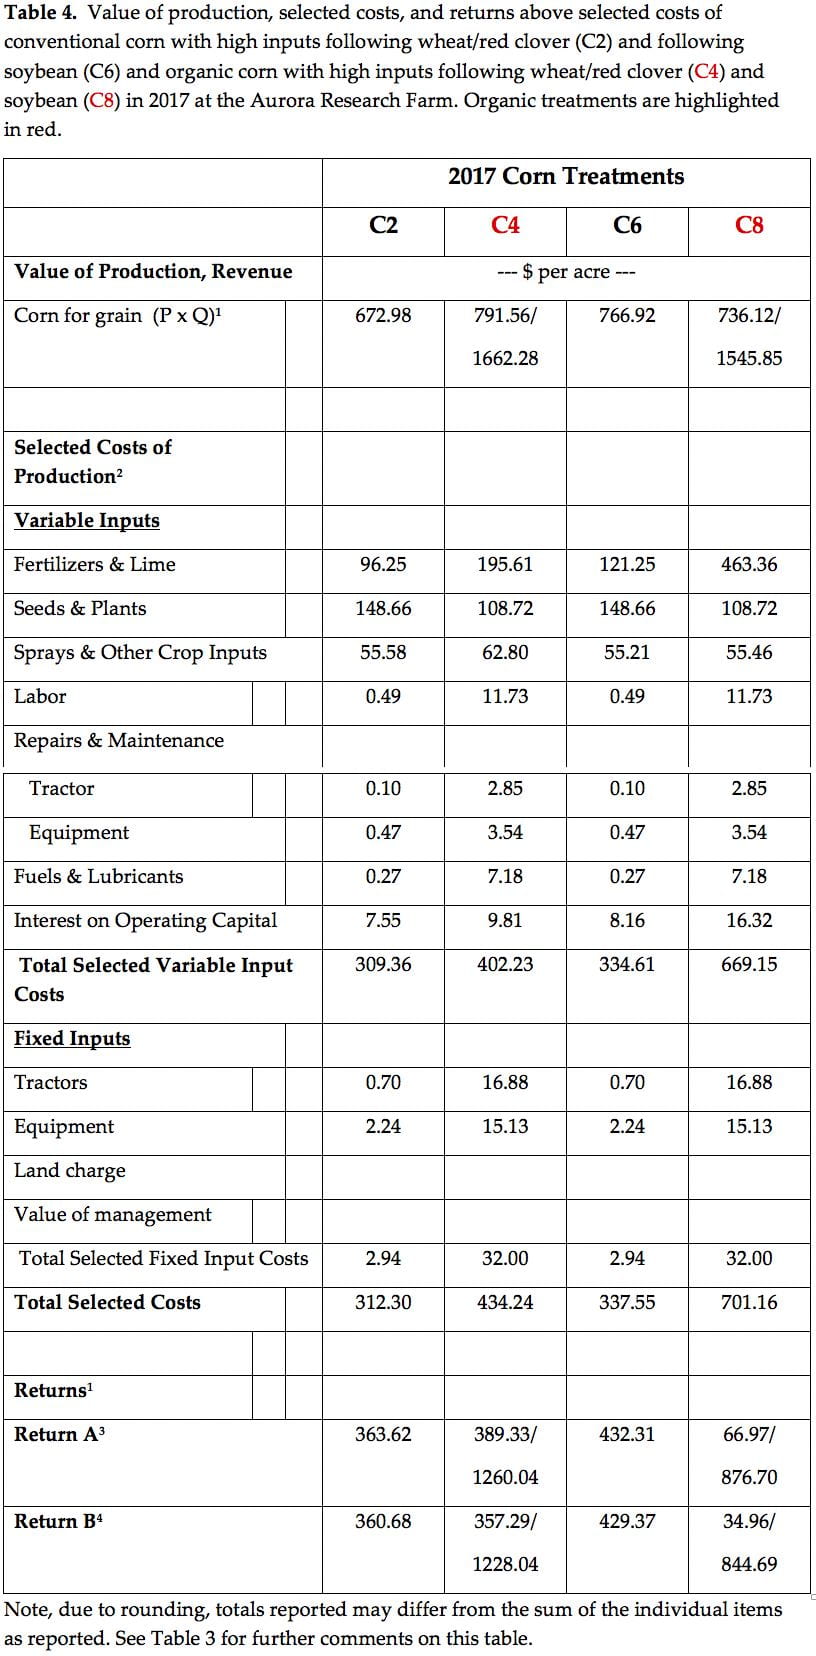
Tables 3-6 show the revenue, selected costs, and returns above selected costs for corn in 2017, soybean in 2017, and wheat in 2018. The selected costs differed slightly for each crop across years because of changes in input prices (for example fertilizer and fuel prices change somewhat from year to year). The differences in selected costs between cropping systems for each crop, however, are consistent across years so Tables 3-6 are very representative of selected costs of each crop. On the other hand, revenue and returns for each crop differed significantly across years mostly because of different yields (for example, organic corn averaged ~115 bushels/acre in 2015 but ~185 bushels/acre in 2017), but also because commodity prices varied somewhat across years. So use Tables 3-6 as references in the discussion on selected costs for each crop but not for the revenue and returns for each crop in each year. We didn’t include the 2018 soybean economics data, however, because the differences in revenue and returns between organic and conventional systems were similar as were comparisons between rotations, and the costs did not vary by more than $6/acre for each treatment.
Organic compared with conventional corn with recommended inputs had ~$15/acre lower selected costs following wheat/red clover (C3 vs. C1 comparison, Table 3) but ~$275/acre higher selected costs following soybean (C3 vs. C7 comparison, Table 3). With high inputs, organic compared with conventional corn had ~$120/acre higher selected costs following wheat/red clover (C4 vs. C2 comparison, Table 4) and ~$365/acre higher selected costs following soybean (C8 vs. C6 comparison, Table 4). As expected, organic compared with conventional corn had lower seed costs because the organic hybrid did not receive a seed treatment and did not have GM traits (Tables 3 and 4). Organic compared with conventional corn had higher fertilizer costs because of the much greater cost for composted poultry manure relative to conventional starter and N fertilizer. The fertilizer and selected costs were much greater for organic corn following soybean (C7 and C8, Tables 3 and 4) compared with following wheat/red clover (C3 and C4) because of the greater N requirement for corn when following soybean. Organic compared with conventional corn also had higher labor, repair and maintenance, and fuel and lubricant costs because of the 4-time use of labor and equipment for mechanical weed control in organic corn (rotary hoe 1x and cultivation 3x) compared with the 1-time use of labor and equipment in conventional corn (herbicide application). Organic compared with conventional corn also had greater fixed costs because of greater wear and tear with the 4-time use of tractors and equipment compared to 1-time use of tractors and equipment for weed control purposes.
Organic compared with conventional corn with recommended inputs had ~$70/acre greater revenue when following wheat/red clover in 2017 (C3 vs C1 comparison, Table 3) and similar revenue when following soybean (C7 vs. C5 comparison, Table 3) in the absence of an organic premium. All prohibited inputs (synthetic fertilizer, GM crops, pesticides, etc.), however, had been applied to the three fields in our study by June of 2014, more than 36 months prior to corn harvest in 2017, so organic corn would have been eligible for the organic premium. We will thus use organic prices for 2017 corn and soybean crops grown under organic management in this study. Organic compared with conventional corn with recommended inputs had ~$830/acre greater revenue following wheat/red clover and ~$685/acre greater revenue when following soybean in the presence of the organic premium (Table 3). Likewise, organic compared with conventional corn with high inputs had ~$990/acre greater revenue when following wheat/red clover (C4 vs. C2 comparison, Table 4) and ~$780/acre greater revenue following soybean (C8 vs. C6 comparison, Table 4). Please keep in mind that organic corn yields averaged ~185 bushels/acre; whereas conventional corn yields averaged ~175 bushels/acre in 2017. In 2015, however, organic compared with conventional corn had much lower revenue because of ~35% lower yields and the organic premium was not in place (first year of the transition). Likewise, in 2016, organic corn had lower revenue because of 7% lower yields, similar or higher selected costs, and no organic premium (2nd year of the transition). So please use Tables 3 and 4 as representative of selected costs but not of revenue and returns above selected costs.
Organic compared with conventional soybean had ~$20/acre higher selected costs with recommended inputs (S3 vs. S1 comparison, Table 5) but ~$5/acre lower selected costs with high inputs (S4 vs. S2 comparison, Table 5). Organic compared with conventional soybean had lower variable costs because of lower seed and other crop input costs, despite higher labor, repair and maintenance, and fuel and lubricant costs (Table 5). As with organic corn, organic compared with conventional soybean had higher fixed costs because of more wear and tear on the machinery with 5 trips (1x rotary hoeing and 4x cultivations) compared to 1 trip over the field (herbicide application) with recommended inputs or 2 trips over the field (herbicide and fungicide applications) with high inputs .
Organic compared with conventional soybean had ~$55/acre lower revenue with recommended inputs (S3 vs. S1 comparison, Table 5) or with high inputs (S4 vs. S2 comparison, Table 5) in 2017 because of ~8% lower yield in the absence of an organic premium (Table 5). In the presence of an organic premium, organic compared with conventional soybean had ~$370/acre greater revenue with recommended or high inputs. Unlike corn that had inconsistent yield differences between organic and conventional corn across years, organic and conventional soybean yield differences did not vary much (similar yields in 2015 and 2016; ~8% lower in 2017; and ~11% lower in 2018). Because of the small differences in yield and selected costs, organic and conventional soybean had similar returns above selected costs in 2015 and 2016 and higher returns in 2017 and 2018. Organic soybean with recommended and high inputs had similar returns in 2017 (S4 vs. S3 comparison) as well as in 2015 and 2016 but somewhat higher returns in 2018.
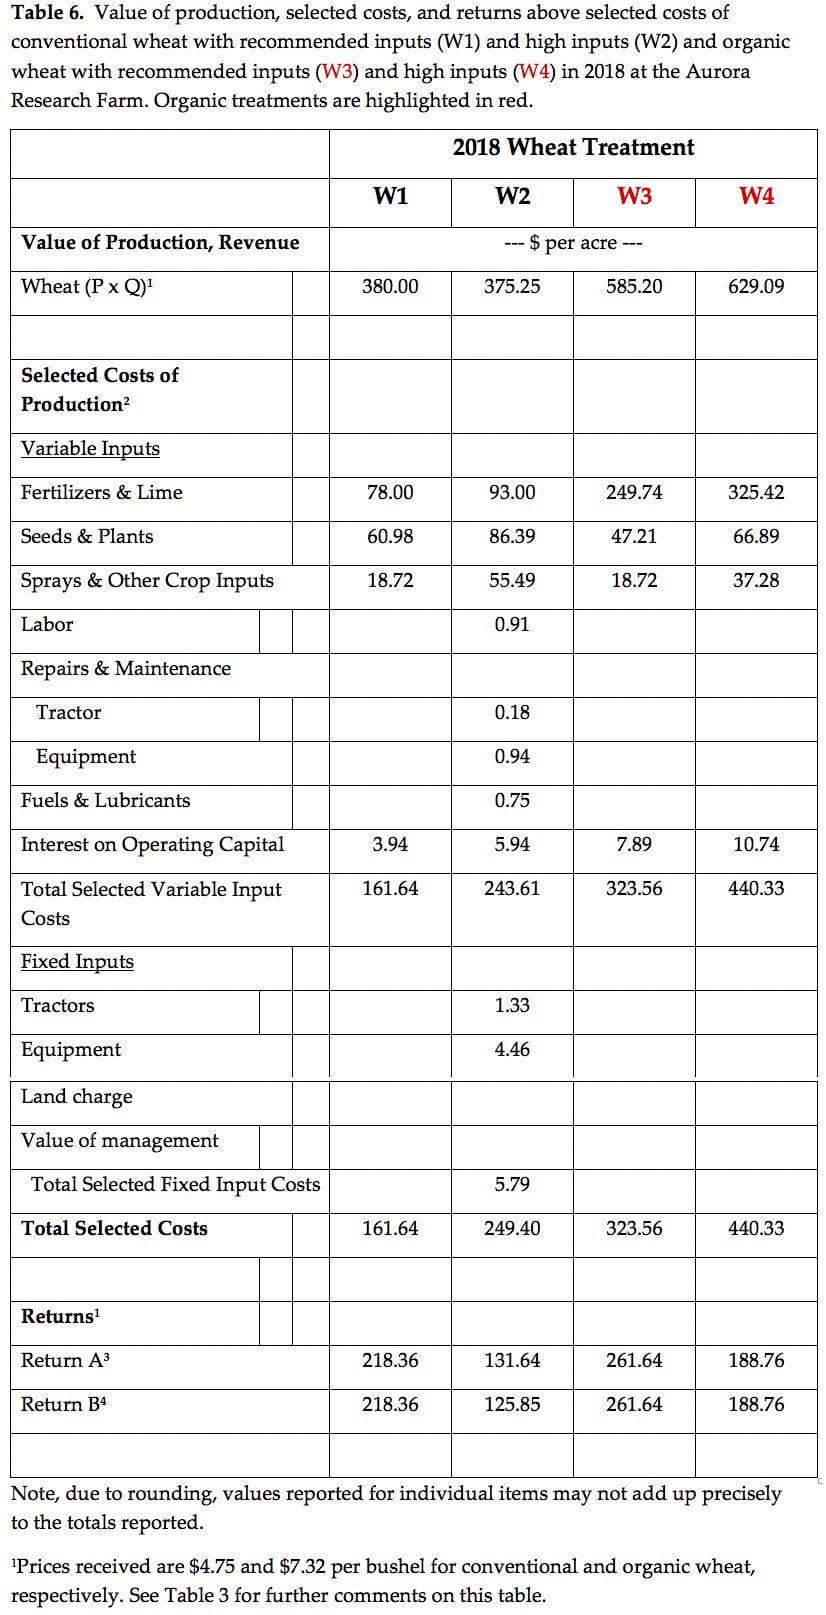
In 2018, organic compared with conventional wheat had ~$160/acre greater selected costs with recommended inputs (W3 vs. W1 comparison, Table 6) and ~$190/acre greater costs with high inputs (W4 vs. W2 comparison, Table 6). Organic compared with conventional wheat had lower seed costs (same variety but no seed-applied pesticide), but much higher fertilizer costs, associated with the use of composted chicken manure, which costs almost 13x the cost of the ammonium nitrate (33-0-0) used on conventional wheat. Organic compared with conventional wheat with recommended inputs in 2018 had ~$205/acre greater revenue because the yields were similar and organic wheat received the organic price premium. Also, organic compared with conventional wheat with high inputs had ~$255/acre greater revenue because of ~7% higher yields and the presence of an organic premium.
Organic compared with conventional wheat with recommended inputs (W3 vs. W1 comparison, Table 6) had ~$45/acre higher return in 2018, despite the ~$160/acre higher selected costs. Obviously the increased revenue, associated with the organic premium, offset the higher selected costs, associated with the use of composted chicken manure. Likewise, organic compared with conventional wheat with high inputs had ~$65/acre higher returns above selected costs (W4 vs. W2 comparison, Table 6). Despite the higher revenue of organic wheat with high vs. recommended inputs, organic wheat with recommended inputs had ~$75/acre higher returns (W3 vs. W4 comparison) because the added revenue from the ~7% yield increase did not offset the higher selected costs, associated mostly with the higher rates of composted manure. Organic compared with conventional wheat, however, had lower returns in 2016 because yields were ~7% lower, selected costs were higher, and the organic premium was not in place (2nd year of transition).
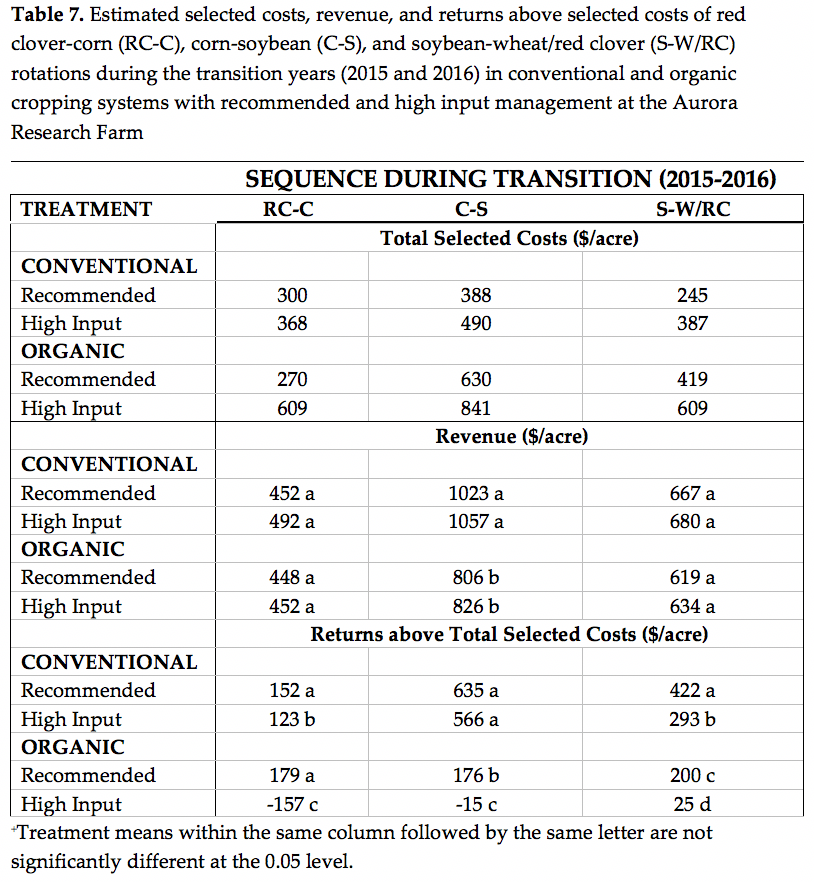
Table 7 shows the costs, revenue, and returns above selected costs of the red clover-corn, corn-soybean, and soybean-wheat/red clover rotations during the transition period, the first 2 years (2015 and 2016) of the study. (A value in Table 7 equals the sum of the 2015 and 2016 values for that treatment). As explained in previous news articles, we planted red clover alone in the early summer of 2015 and plowed it under in the spring of 2016 to see if a green manure crop would provide agronomic and economic benefits to subsequent organic crops in the rotation. The 2-year organic compared with conventional rotations generally had higher selected costs, especially with high input management, mostly because of the very high costs for the composted manure applied to corn and wheat. Revenue was similar as were returns between conventional ($152/acre) and organic ($179/acre) red clover-corn rotations with recommended inputs. Most conventional growers, however, would not plant a green manure crop so a comparison of the organic red clover-corn rotation vs. the conventional corn-soybean rotation with recommended inputs is more appropriate. In this comparison, the organic red clover-corn rotation had ~$455/acre lower returns, similar to the comparison between the conventional vs. organic corn-soybean rotation. The organic compared with the conventional soybean-wheat/red clover rotation with recommended inputs had ~$220/acre lower returns, which proved to be the most economical organic rotation in this study during the transition years. Many conventional growers, however, use high inputs on soybean (200,000 seeds/acre, fungicide/insecticide seed treatment, and foliar fungicide application) and even more so on wheat (high seeding rate, seed treatment, fall herbicide application, split-N application, and foliar fungicide application). A comparison of the organic soybean-wheat/red clover rotation with recommended inputs vs. the conventional soybean-wheat/red clover rotation with high inputs shows only ~$95/acre lower returns during the first 2 years of the transition. All rotations in conventional and organic cropping systems with recommended vs. high inputs had greater returns, except for the conventional corn-soybean rotation, which had similar returns.
During the first 2 years after the transition (2017 and 2018) in this study, selected costs were once again mostly higher in the organic compared with the conventional rotations, especially with high input management (Table 8, a value in the table equals the sum of the 2017 and 2018 values for that treatment). Again, the higher costs for composted manure on organic corn and wheat compared to synthetic fertilizer contributed to the higher costs. The organic compared with the conventional cropping system in all three rotations had much greater revenue because of similar to greater corn and wheat yields or slightly lower soybean yields, coupled with the organic premiums. So despite the mostly higher selected costs for organic compared with the conventional rotations, higher costs did not offset the higher revenue, resulting in much higher returns above selected costs for the organic rotations (Table 8). When averaged across input treatments, organic compared with the conventional cropping system had ~$410/acre higher returns in the red clover-corn-soybean-wheat/red clover rotation, ~$720/acre higher in the corn-soybean rotation, and ~$1200/acre higher in the soybean-wheat/red clover-corn-soybean rotation. When averaged across input treatments in the organic rotation, the organic soybean-wheat/red clover-corn-soybean rotation had ~$435/acre higher returns than the organic corn-soybean rotation and ~$930/acre higher returns than the organic red clover-corn-soybean-wheat/red clover rotation. Similar to the transition period, the soybean-wheat/red clover-corn-soybean rotation was the most economical organic rotation during the first 2 years after the transition.
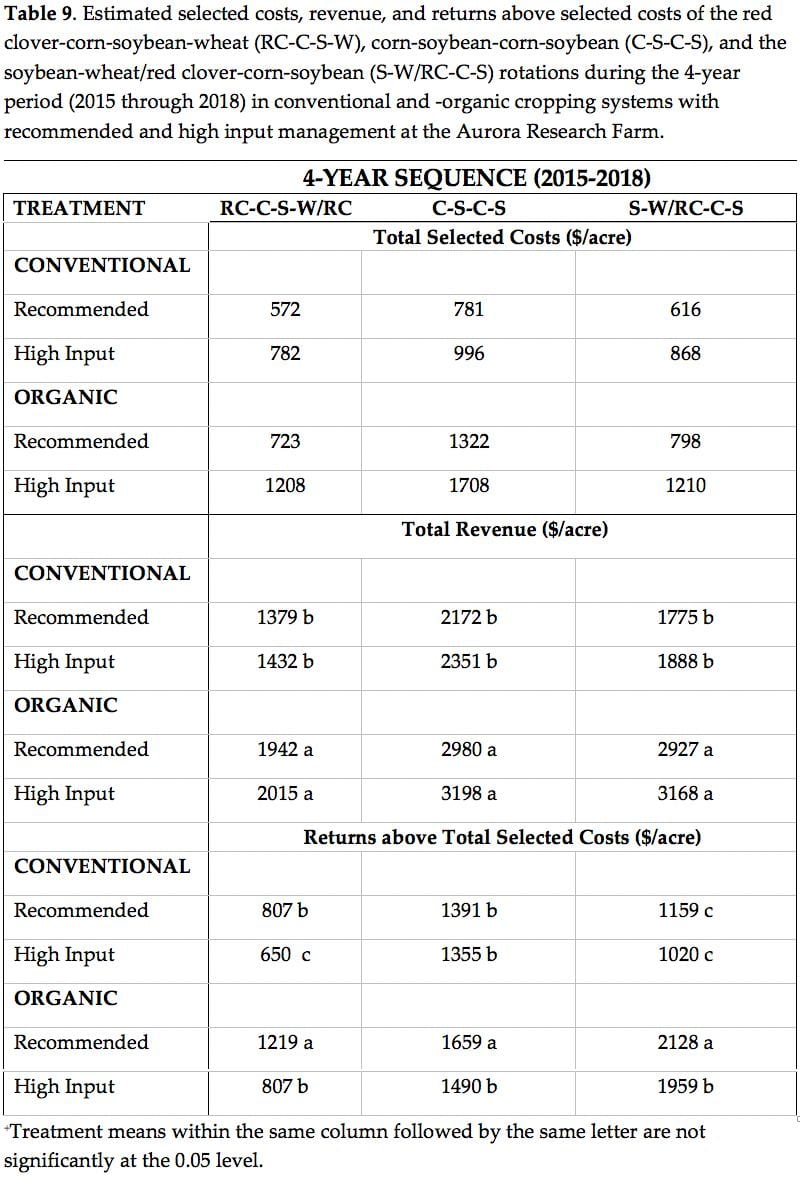
The organic compared with the conventional cropping system had much higher total selected costs in all 4-year crop rotations, which was more than offset by the much greater revenue in all 4-year crop rotations (Table 9). When averaged across input treatments, the organic compared with the conventional cropping system had ~$270/acre higher returns above selected costs in the red clover-corn-soybean-wheat/red clover rotation, ~$200/acre higher returns in the corn-soybean rotation, and ~$955/acre higher returns in the soybean-wheat/red clover-corn-soybean rotation. When averaged across input treatments in the organic rotation, the organic soybean-wheat/red clover-corn-soybean had ~$470/acre higher returns than the organic corn-soybean rotation and ~$1030/acre higher returns than the organic red clover-corn-soybean-wheat/red clover rotation. Obviously, planting a green manure crop was the least profitable organic rotation to select. Despite the lower returns for organic wheat compared with organic soybean or organic corn, the inclusion of wheat/red clover in the organic rotation was far more profitable than just the corn-soybean rotation over the 4-year period. In contrast, the corn-soybean rotation was most profitable for the conventional cropping system.
In the organic cropping system, recommended input compared with high input management had $412/acre higher returns above selected costs in the red clover-corn-soybean-wheat/red clover rotation and $169/acre higher returns in the corn-soybean and soybean-wheat/red clover-corn-soybean rotation. Consequently, the results clearly suggest that organic cropping systems, regardless of rotation, did not respond to high input management in this study. Many organic growers have been advised to use higher than recommended seeding rates with the goal of improved weed control. In our study, we saw statistically fewer weeds with high input management in corn, soybean and wheat but differences were so small that it had no effect on crop yield in this environment. Based on the returns above selected costs in our study, the use of higher seeding and N rates is not justified in the first 4 years of organic soybean-wheat/red clover-corn-soybean rotation on silt loam soils in central New York.
Conclusions
Field crop producers who transition to organic corn, soybean, and wheat production can generate greater returns above selected costs than conventional field crop producers after 4 years under the environmental conditions of this study, if they can successfully manage the cash-flow challenges during the transition period. To help manage the cash-flow challenges, transitioning growers should not apply prohibited inputs in their last conventional crop after late spring/early summer so the 36-month transition period can be accomplished in two growing seasons. Given the growing conditions during this study and the economic analyses reported here, transitioning growers should not use a green manure crop in the first year of transition but rather plant soybean. Soybean does not require N fertilizer, a major constraint to organic corn and wheat production, so growers should begin their transition in a field where soybean is the intended crop. In addition, soybean with the use of aggressive cultivation is also competitive with weeds, the other major constraint to organic field crop production.
Based on the economic results of this study, field crop producers should include winter wheat as the second crop in the transition after soybean. Organic growers may be able to no-till wheat after soybean harvest, if few winter perennial weeds are observed in the soybean crop. Growers should also frost-seed red clover into standing wheat in early spring, a typical practice for many conventional wheat growers.
Economic analyses of this study suggests that field crop producers, who transition to an organic cropping system, should plant corn in the 3rd year, or the first year when crops are eligible for the organic premium. Organic corn typically has a higher premium when compared with premiums for organic soybean and organic wheat. Corn should follow wheat with interseeded red clover, which provides considerable slow-release N to the subsequent corn crop. In addition, the wheat/red clover crops can disrupt weed cycles, as evidenced by the much lower weed densities in organic corn in the soybean-wheat/red clover-corn-soybean rotation compared with the corn-soybean rotation in 2017. In the 4th year of the study, field crop producers should begin the soybean-wheat/red clover-corn-soybean rotation again by planting soybean.
Based on the economic results of this study, field crop producers should use current recommended inputs for conventional crops and not use elevated seeding rates to improve weed control or use higher N rates to provide more available soil N to corn and wheat. Although the organic compared to the conventional cropping system generated greater returns above selected costs in this study, we recognize that commodity prices, farm size, individual/personal beliefs, and other factors influence a grower’s decision on whether to transition to an organic cropping system. Furthermore, we recognize that the growing conditions and soils were unique to this study so results could differ for different years or locations in New York.
Figure 1. White mold infected soybean stem. (Photo by J. Cummings, NYS IPM)
It’s that time of year where we typically consider fungicide applications for white mold protection in our soybeans. However, this year is a little different. Soybeans across NY range from V4 to R4 this week, making it a challenging decision regarding whether or when to spray. As you know, white mold (Sclerotinia stem rot) is our most challenging and undermanaged disease of soybeans across the state (Fig. 1). It typically rears its ugly head when the rows and canopies close between growth stages R3-R6. We have no silver bullet for this disease, and therefore rely on an integrated management approach for the best results.
The pathogen produces sclerotia, which are the hard, black survival structures that can easily survive in the soil for at least 10 years, with some reports of up to 20 years. These long-lived sclerotia, and the wide host-range of this pathogen, make crop rotation as a management strategy difficult, if not impossible. Resistance to this devastating disease is moderate, at best, in some elite commercial varieties, but none are immune or strongly resistant. Canopy management is a goal of some growers who struggle with white mold, and efforts include reduced seeding rates and wider rows. There is plenty of evidence that increased airflow in the crop rows can reduce white mold infection, because the disease is favored by the humid conditions of a dense and closed canopy. Research on biological control with a product called Contans WG has shown limited or variable efficacy in New York and Michigan, and requires a multi-year commitment for applications for the best results. However, some NY soybean growers have been successful at reducing white mold incidence and severity in their fields treated with Contans WG, and consider the results well-worth the $35 per acre cost. Recent research at Cornell by Dr. Sarah Pethybridge (vegetable pathologist) has shown that planting soybeans into roller-crimped rye cover crops can significantly reduce the sporulation of the white mold fungus, resulting in significantly less disease. Paying attention to the expected weather patterns and forecasting models, such as Sporecaster, are also critical in making white mold management decisions, because this disease can be particularly devastating in times of high precipitation or humidity during temperatures below 85°F. Though, we have seen fairly severe epidemics in some fields even in hot, dry years.
Figure 2. Nozzle recommendations for white mold suppression from Michigan State University.
Timely foliar fungicide applications with appropriate nozzles for canopy penetration (Fig. 2), in combination with crop rotation, genetic resistance, canopy management, and biological control remains our best approach for managing white mold in soybean fields. The main goal for your fungicide applications should be to get them applied BEFORE you have a major outbreak of white mold in your field. If you have soybeans in a field with a history of the disease, and if the weather conditions are forecasted to be favorable for disease, it’s recommended to get a protective fungicide on between the R1 and R3 growth stages. Fungicide applications can be a waste of money after R4. It’s important to note that once you have an epidemic in a field, no amount of fungicide will stop or cure the spread.
Figure 3. Research from North Dakota State University shows that combining wider row spacing with timely fungicide applications can decrease white mold disease severity and increase yields.
A number of foliar fungicides are labeled in NY for white mold protection on soybean that are rated ‘Good’ to ‘Very Good’ in the Cornell Guide for Integrated Field Crop Management, based on national replicated field trials. These include Aproach, Endura, and Omega. Other fungicides are rated as ‘Fair’, including Topguard, Proline, Domark, and Topsin-M. It’s important to follow all label recommendations, and note that some products, such as Aproach, recommend two applications when other products may only require a single application.
Figure 4. Field trial results in Michigan show that both Omega and Propulse fungicides each significantly increase soybean yields, particularly when white mold disease pressure is high.
There have been a lot of soybean white mold fungicide efficacy trials in other states that have similar weather patterns and epidemics to ours, including Michigan, Wisconsin and N. Dakota. Dr. Michael Wunsch of N. Dakota State University demonstrated that increased row spacing in combination with timely application of Endura fungicide resulted in significantly lower disease incidence and higher yields compared to narrow rows and the non-treated control (Fig. 3). Mike Staton of Michigan State University demonstrated that a comparison of the fungicides Omega and Propulse showed that they both significantly increased yields compared to the non-treated control, especially in trials with high disease pressure, but that Propulse was a much more cost-effective option (Figs. 4 and 5). Dr. Damon Smith of University of Wisconsin evaluated the effect of various fungicide combinations and application timings on disease incidence and yield, and found significant improvements in yields from applications of Propulse + Delaro, Proline + Stratego, and a double application of Delaro (Fig. 6). All registered products evaluated in these trials are labeled for use against white mold of soybeans in NY.
Figure 5. White mold fungicide trials in Michigan demonstrate the economics of fungicide applications in fields with high and low disease pressure.Figure 6. A table from University of Wisconsin outlines fungicide efficacy data on disease suppression and yield for various fungicides products and application timings. (Not all products evaluated in this trial are labeled for use in NY.)
Though we have a number of fungicides labeled for use on white mold in NY, not all field crop dealers carry all products, and pricing may vary by location. When opting to utilize a fungicide application as part of your integrated management strategy for white mold, keep in mind that there are wide ranges in efficacy and cost among products. A quick inquiry with only two sources provided prices or price ranges per acre of some of the products you may consider using, as outlined in Table 1 (in alphabetical order, at the highest labeled rates).
Considering the abnormally wide range in growth stages and canopy closure as we experience or approach flowering in our soybean fields, I think we can expect some difficulty in managing white mold in some locations this year. One of the most perpetuated fallacies I hear is that white mold requires soybean flowers for infection. Even though this is consistently mentioned in fact sheets and other resources, it is not entirely true. A soybean plant at any growth stage can succumb to infection by the white mold fungus if the conditions are favorable and if the spores are in the air. However, soybean flowering usually coincides with canopy closure, and this canopy closure encourages a humid environment within the rows which does enhance disease initiation and progression. And, shed flower petals do provide a nice food source for germinating spores. But, again, the flowers are not required for infection.
Although I have seen some nice soybean fields this year that were planted on time, either before or between all of the spring rain events we experienced, much of the soybean planting across the state was delayed this year due to wet conditions. That means there may be closed canopies with flowering soybeans across the road from fields with much younger or smaller plants. If the weather favors white mold with moderate temperatures, precipitation and humidity, the disease may initiate in one dense, flowering field and spread among many others. Or, it may initiate in a field where the plants are stunted with a fairly open canopy, if it’s a field with a history of this disease and favorable weather conditions. It’s anyone’s guess at when and where a white mold epidemic may happen this year given the variable growth stages and ranges in canopy closure.
Don’t despair, there’s still hope. I haven’t heard many reports of white mold yet from across the state, which means you still have time to make management decisions. Get out in your fields to scout, and pay attention to the weather. Know what growth stages your soybeans are at and how your canopies are looking, and what your neighbors’ beans are doing. If you have a history of white mold in your fields, and you know that the weather forecast for your area is favorable for the disease, then consider the most cost effective fungicide application to protect your crop. If you expect dry conditions in a field without a history of white mold, then you can probably skip the fungicide application. You know your fields best. But, be aware that the variable growth stages this year may add an unexpected layer of complication to white mold management and timing of fungicide applications.
Thank you to Jeff Miller and Josh Putman of CCE, and Danny DiGiacomandrea of Bayer for assistance with fungicide price ranges.


 Late summer forage plantings are at a higher risk for infection since the spores that cause disease will increase and spread throughout the growing season. When these forage plantings are infected, pathogen overwintering on buckthorn can be increased. This contributes to crop epidemics the following year and may speed the breakdown of oat varietal resistance.


