MOSS (Musgrave Organic Soybean Silage)

  The last experiment I worked on was the Musgrave Organic Soybean Silage (MOSS) experiment. The head person on this project was a new grad student, Kiera Crowley. The experiment aims to compare different winter cereal management in corn and soybean rotation. The winter cereal used in all of the management experiments was cereal rye. There are four different winter cereal management’s being tested in this experiment: a no-till with the cereal rolled and crimped, a plow down, a management where the rye is cut for silage and what’s left gets plowed under, and a no cover crop management. Kiera plans on running multiple tests on the experiment to see if these different managements are having any effect. I helped execute soil property tests and water infiltration tests. In addition to that, Kiera is analyzing weed suppression and yield.

From the last post, you can see that I have done some soil sampling before. We took sixteen samples from each plot and there are twelve plots. We took these samples in order to analyze the soil properties. Bigger soil core samplers were used so we could examine aggregate stability. Four samples were taken from each plot. When taking the soil cores for aggregate stability, it was a more challenging and time-intensive process than regular soil sampling. The soil core had to be 6 inches and the diameter of the sampler was greater than 2 inches. In order to get the sampler down 6 inches, it took force and some finagling. After taking the sample out of the ground, we had to be careful not to disturb the soil too much. The test was for aggregate stability which is a factor of soil structure, so the less disruption of the soil structure, the better. All the soil was taken back to the lab for processing. The processing of the samples dealt with chemistry. I was able to help with some of the processing of the mineralizable carbon test. Kiera had done all of the prep work and my job was just to extract the mineralizable carbon.

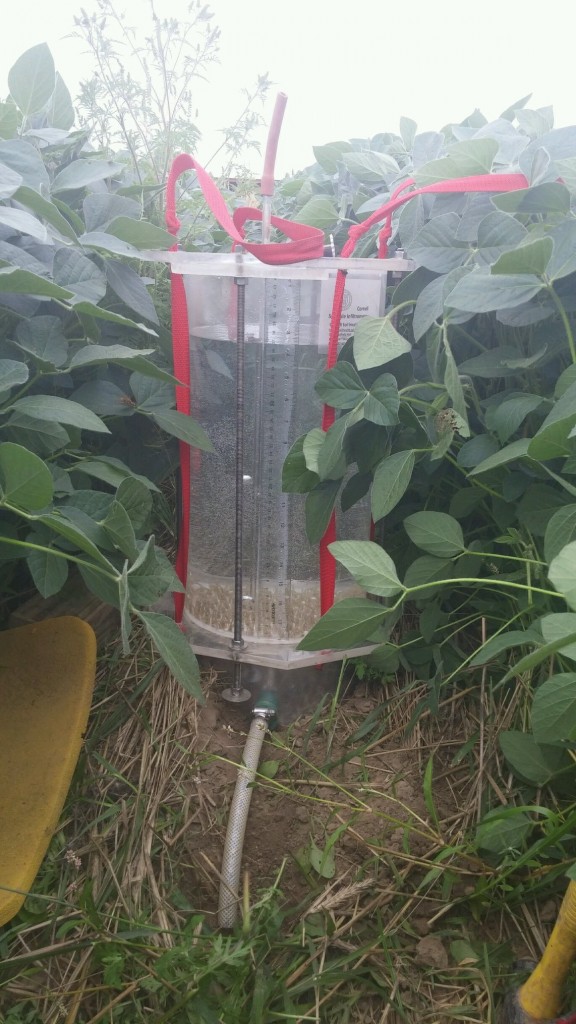
The second piece of the experiment I worked on was the water infiltration tests. The water infiltrometer is a device used to measure the water infiltration (the process by which water flows into the soil).
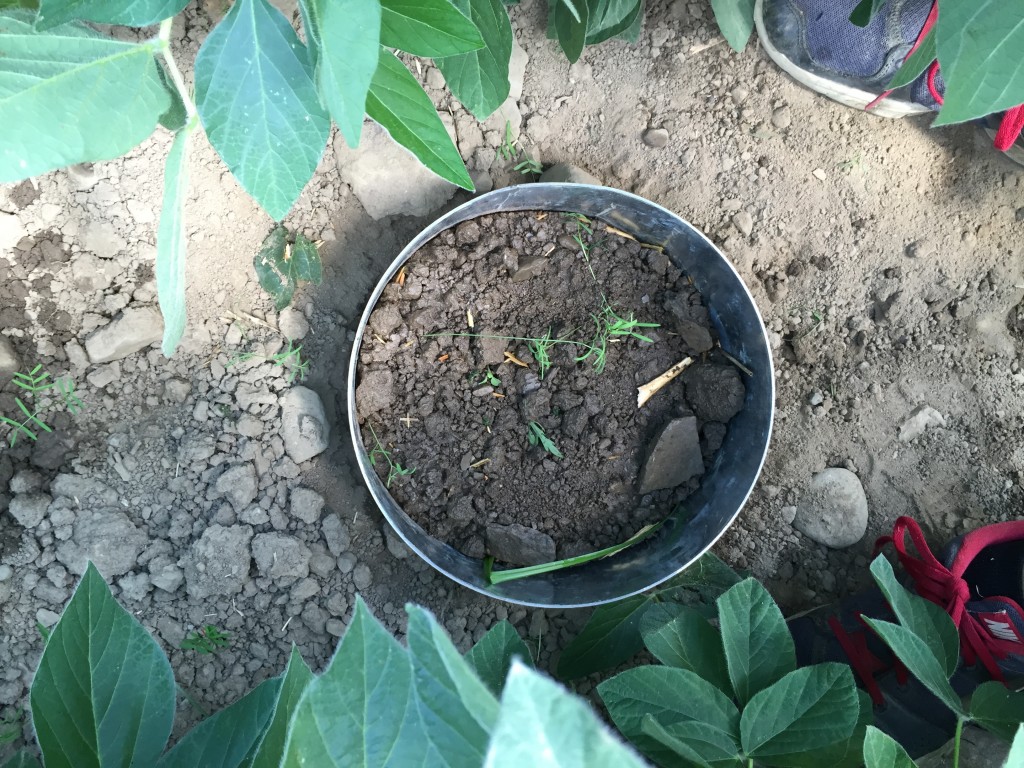
IMG_3005

Base of the Infiltrometer

IMG_3006

Infiltrometer all ready to go

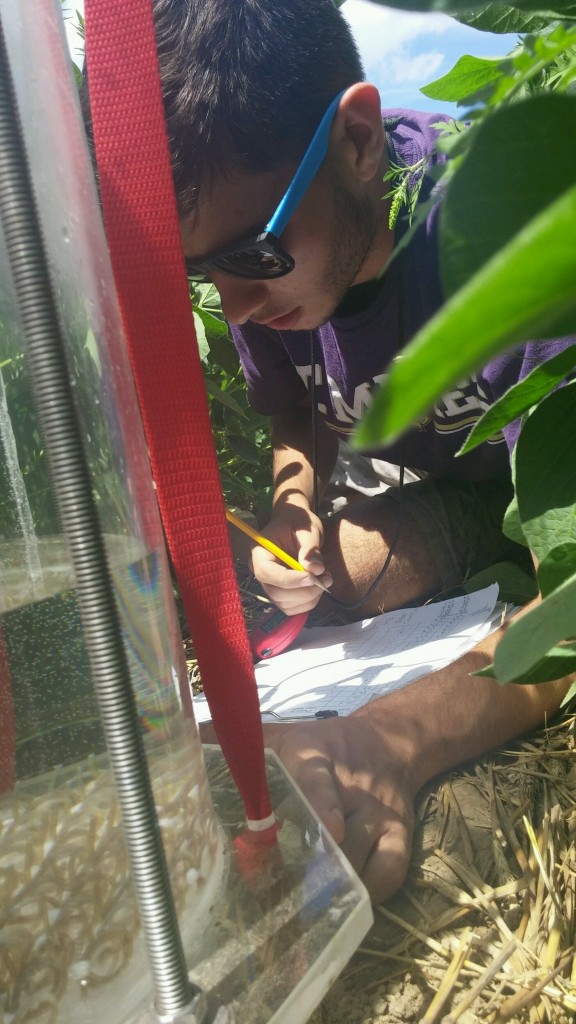
IMG_3003

Recording results from Infiltrometer


Infiltrometers let you fix a rate of water dispersal onto soil. Infiltrometers can be used different ways depending on what you are looking for. We were interested in time until runoff. This involved recording the height of the water in the infiltrometer every minute. This way you can find the rate for each minute and can check to make sure it is staying consistent. This process is continued until there is runoff. After runoff had occurred, we recorded the amount of water that was used and the time it took to runoff. Working with the water infiltrometers was a very interesting and educational experience. The first time we tried to do water infiltration it didn’t go as planned. The rate is meant to stay consistent the whole time. While we had some successful infiltrations, during many of the infiltrations the rate kept decreasing and with some we never got runoff. We weren’t even able to finish all of the plots and this is very important because all of the samples should be taken within the same day. After some clarification and advice from a few people, we made some adjustments. The second time running the water infiltration tests were much more successful. The rates were staying consistent and we were able to finish within one day.

The models used to fit the data of yield nitrogen fertilizer response

As I’ve been working in the project that try to determine the optimum nitrogen rate for double cropping winter cereal in New York State, one basic but important part in it is to fit the yield nitrogen fertilizer response data from individual experiment site into different statistical models.

  • The following is the general regression model:

general regression model

where Yi refers to the yield response variables, β0 refers to the intercept, Xi refers to the nitrogen fertilizer rate, βi refers to the coefficient of the nitrogen fertilizer rate, and εi is the random error.

Then the following is the five specific models based on the general regression model, which is quadratic model, exponential model, square root model, quadratic plateau model and linear plateau model.

  • Quadratic model:

quadratic

where Yi refers to the yield response variables, β0 refers to the intercept, Xi refers to the nitrogen fertilizer rate, β1 refers to the linear coefficient, β2 refers to the quadratic coefficient, and εi is the random error.

  • Exponential model:

exponential

where Yi refers to the yield response variables, β0 refers to the maximum yield when the nitrogen rate is not limited, β1 refers to the increase of yield per unit of nitrogen rate, β2 refers to the nitrogen value in soil with the same unit as the nitrogen fertilizer rate, and εi is the random error.

  • Square root model:

square root

where Yi refers to the yield response variables, β0 refers to the intercept, Xi refers to the nitrogen fertilizer rate, β1 refers to the linear coefficient, β2 refers to the square root coefficient, and εi is the random error.

  • Quadratic plateau model:

quadratic plateau

critical point

where Xm is the critical point after which the increase of nitrogen fertilizer can no longer increase yield, and Ym is the maximum yield. The other coefficients have the same meaning as those in quadratic model. The plateau occurs when the quadratic curve comes to its maximum point.

  • Linear plateau model:

linear plateau

maximum yield

where Yi refers to the yield response variables, β0 refers to the intercept, Xi refers to the nitrogen fertilizer rate, β1 refers to the linear coefficient, and εi is the random error. Xm is the critical point after which the increase of nitrogen fertilizer can no longer increase yield, and Ym is the maximum yield.

I use R to fit the data with these models. Among them, we can easily use linear regression function when dealing with quadratic and square root model. For example:

fit_quadratic<-lm(Yield~I(NTrmt)^2+NTrmt, data= site_1_2013)

However, we need to use nonlinear regression function to fit with exponential, quadratic plateau and linear plateau model. An easy and understandable way to do it is followed:

linear.plateau=function(A,B,C,x){
   ifelse(x<C,A+B*x,A+B*C)
 }
fit_linear.plateau<-nls(Yield~linear.plateau(A,B,C,x=NTrmt),
                        data = site_1_2013,start=list(A=1.33,B=0.017,C=60))

This means that we can create a function of the formula of that model first, and then use this newly created function in the nonlinear regression function.

However, One of the biggest challenges here is to determine the starting value, as it is shown in the code:

start=list(A=1.33,B=0.017,C=60)

The starting value can be regarded as a guessing value of each coefficient. The reason we need to input such a starting value is that only when the starting value is close to the “real value” can the computer find out the “real value” within certain number iterations.

The proper starting value can usually be estimated following these steps:

  • Plot the data point.
  • Understand the meaning of each coefficient, and obtain the possible value of some coefficients based on the plot. For instance, in linear plateau model, β0 is the intercept, so we can estimate β0 by using the intercept of Y-axis in the plot.
  • Select some representative points in the plot, and use the data of these plots in the corresponding formula to calculate possible coefficients. For example, in linear plateau model, we choose two representative points (0,b) and (c,d), where (0,b) is the a point on the Y axis, and (c,d) is the point of highest yield, so that Xm=c, Ym=d, β0=b, β1=(d-b)/c.

Empire Farm Day

Last week, my colleagues and I attended the Empire Farm Day at Rodman Lott and Son Farms. When I arrived, I was surprised to see that there were so many visitors and business men attending this big local event, and soon I found that it was a great opportunity for people like me to know more about agriculture development in New York State.

The first tent we visited was about soil health seminar. We have learned most of the content in the soil health seminar before in soil science courses, but we could  find that the lecturer used simpler words and more examples so that the contents could be easier comprehended and better remembered.

IMG_5348 IMG_5349

There were a variety of agriculture machinaries showing on the grass land. The farmers could conveniently talk to the dealers, in order to know more about the strength of these machinaries.

IMG_5351 IMG_5392

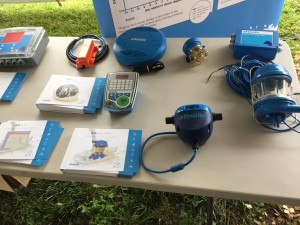
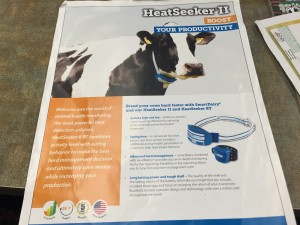
Also, there were a diversity of agriculture equipments that could be used to farm, keep livestock or market in a more convenient and precise way. I suppose that increasing use of such high-tech equipment must be a irreversible tendency nowadays.

IMG_5372IMG_5370

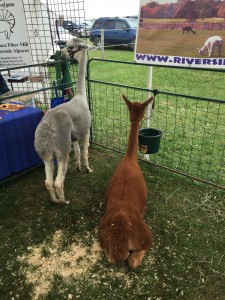
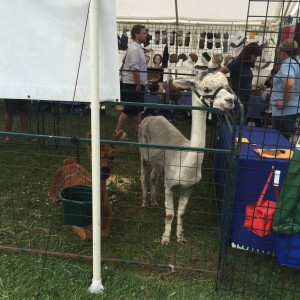
The most exciting thing for me was two alpacas. Before, I had only seen such cute animals on the websites, and I was so surprised to see that there’s a farm of alpacas in New York State. By the way, it’s interesting that these two alpacas showed their “somber” back to people from beginning to end.

I think this kind of event could definitely act as a great platform for local farmers to improve their knowledge, facilities and equipment that were useful for their farming work.

Organic Cropping Systems (OCS)

Organic Cropping Systems (OCS) is a study comparing four different organic cropping systems. The four different systems are a high fertility system, low fertility system, enhanced weed management system, and reduced tillage system.  The experiment is headed by several people. The head person in our lab is Brian Caldwell. All the work that I have done has been on a sub-experiment within the OCS experiment. This experiment is run by Margaret Ball, one of the grad students in our lab. From this point when I mention OCS, I will be talking about Margaret’s sub-experiment. Margaret’s experiment compares weed suppression, weed community composition, weed-crop competition and effect of nutrient addition among soybean in all four systems.

Weeds are a major problem for organic growers since organic systems exclude the use of conventional herbicides. By exploring these four organic cropping systems Margaret can examine which system is best at managing the effects of weed competition or which systems that are more conducive for soybean resilience  For example, last year the experiment saw results that suggested the low fertility system was most favorable for soybeans because of competitive yield, good weed suppression, and low input costs.

IMG_9764

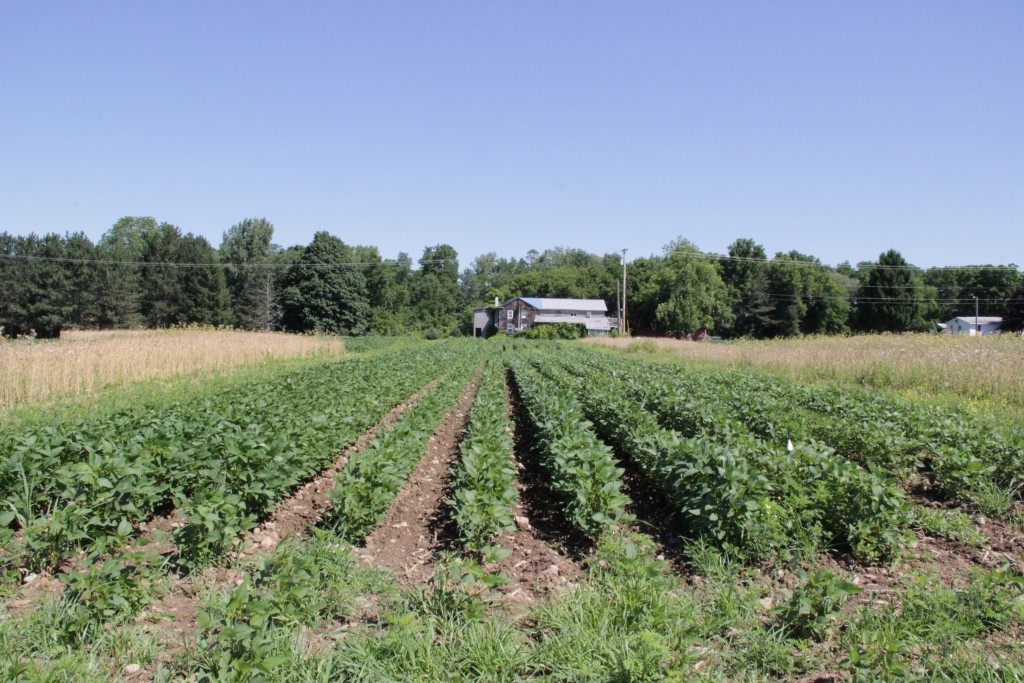
Picture of a system plot. For example 1.1A, 1.1B, 1.3B, etc. (refer to map)

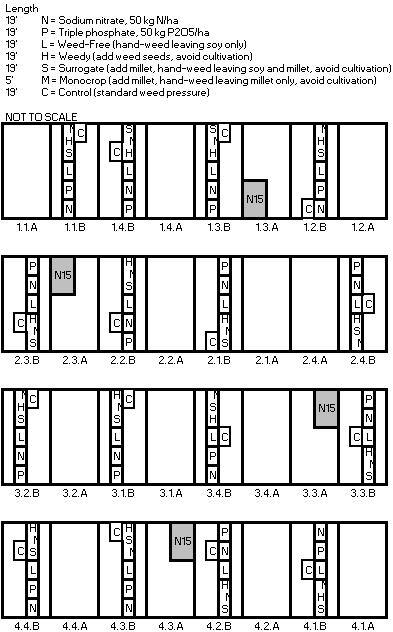
OCS plot map

Picture of a plot map and treatments. Each rectangle represents a system plot. Each little rectangle within the system plot represents a subplot with a specific treatment.


The OCS experiment is where my work has been the most diverse. Here is a list of what I have worked on so far:


1)We first measured out where the soybeans were going to be planted in the experiment.

2) The individual treatments(subplots) needed to be measured out. Soybean rows had already been planted and were starting to emerge from the soil. In all there were six treatments (excluding the control treatment). The six treatments were:

  • Sodium nitrate application
  • Triple Phosphate application
  • Weed-free (hand-weed leaving soybeans only)
  • Weedy (add weed seeds and avoid cultivation)
  • Surrogate (add millet, hand-weed leaving soybean and millet, and avoid cultivation)
  • Monocrop (add millet, hand-weed leaving millet only, and avoid cultivation)
IMG_9713

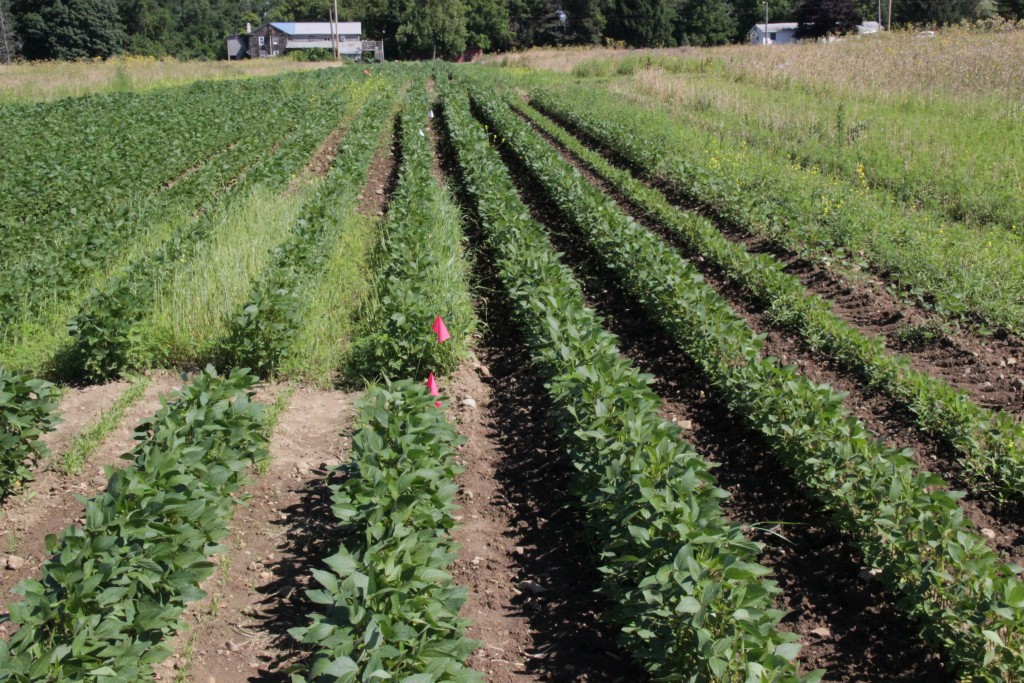
Example of the differences among subplots. At the bottom left corner is the Surrogate subplot, next is the Monocrop subplot, then the Weedy subplot, and lastly the Weed free plot.


3)After the treatment plots had been measured out we broadcasted the millet seed, weed seed, and fertilizers. The Millet plots were designed to create consistent competitive pressure for the soybeans between all systems. The weed seed was planted to show the effect of having a high density of weeds.

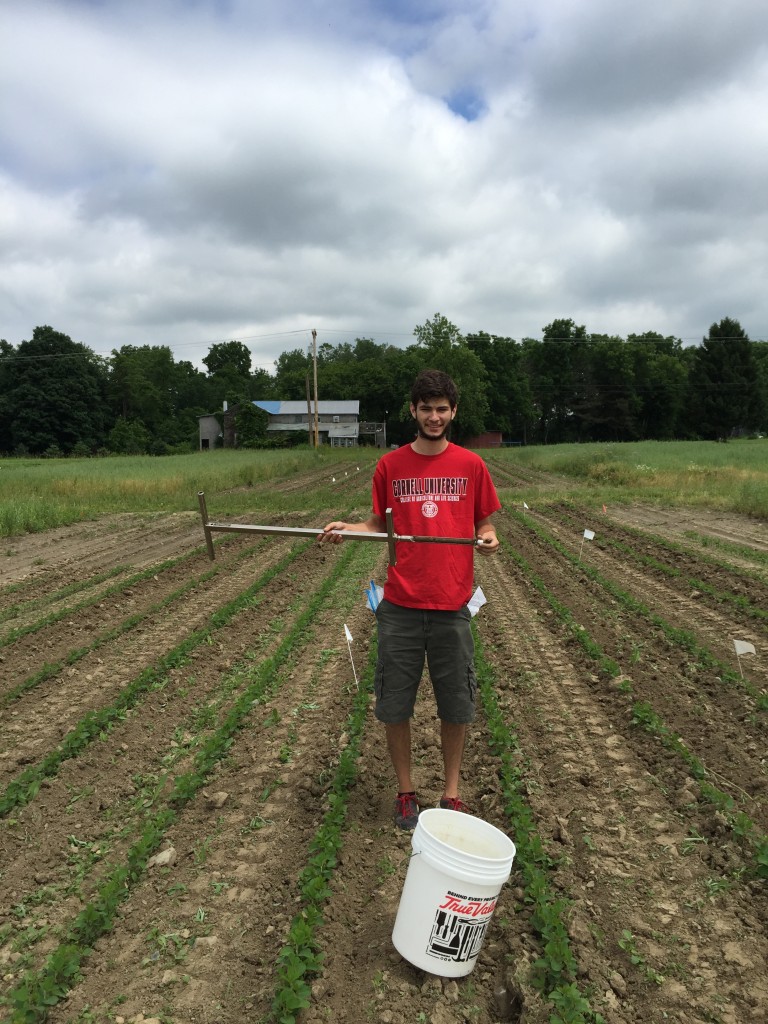
4)Soil samples were taken from plots to compare the soil properties among each system.

IMG_2746

Taking soil samples.


5) Due to improper germination, millet had to be replanted. When we replanted millet we planted it in rows instead of broadcasting because it makes it easier to differentiate between millet and other grasses like Foxtail.

6) Weekly weeding of weed free plots.

7) Lastly, we took weed and soybean biomass samples. In my first post I talked about biomass sampling. The process was very similar in this experiment. Within the quadrat we identified and counted the weed species and counted how many soybeans were present.

Ciao for Now, Casa Caponetti!

Missing Tuscania already!

Missing Tuscania already!

Well, the last six weeks went by quickly, but it’s been a wonderful experience getting to spend my summer working on a farm in Italy. I’ve gained a ton of first-hand knowledge about planting and growing vegetables, independent research projects, and travelling by myself. I hope the practical farming skills I’ve gained here will stick with me and prove useful in the future, but I think the most valuable part of this summer for me was experienced on a more personal level. When I first arrived at the farm I was the only one working in the garden, shy and nervous about asking questions or messing something up. Eventually I settled into a routine, asked to be included in the decision making processes of managing the garden, and finally got people to save their 1.5 L plastic bottles for my experiment.

I’ve figured out that in most situations, you don’t just get everything you need handed to you. Being assertive is something I sometimes struggle with, but over the course of my time at the farm I’ve learned how much of an ability I have to get what I want out of any experience. The opportunity to travel by myself has also been incredibly rewarding. There’s something about navigating multiple trains and buses in a foreign country and actually managing to get where you’re trying to go that can make you feel quite independent and satisfied with yourself. To my pleasant surprise, I made it back home without any bumps along the way – I didn’t miss any of my flights and none were delayed! I’m so thankful for my internship experience this summer and I’m excited to finish up the ag science major and make the most of senior year. Back to Ithaca in less than a week!

New Sprouting Experiment

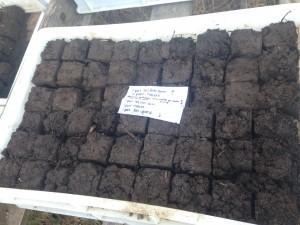
In addition to my olive fruit fly control research project, I started a small experiment to test the effects of different potting mixtures on seed germination rates. The method typically used here at Casa Caponetti is sprouting seeds in soil blocks with a mixture of 1 part soil from the farm, 1 part manure, and 1 part pre-made outdoor potting soil with peat and fertilizer. I wanted to see how effective it would be to keep the amount of regular soil the same, and change the ratios of manure and potting soil.  I sprouted lettuce in 4 different combinations: 1 part farm soil and 2 parts manure, 1 part farm soil, 1 part manure, 1 part potting soil, and 1 part farm soil and 2 parts potting soil, and a control of 100% pre-made potting soil. As one might expect, the pre-made potting soil seems to be the most effective in germinating seeds quickly, since that is what it’s designed for. The sprout heights were measured, and the ones that germinated in the potting soil were longer than those in the other three mixtures. This was likely because there is fertilizer in the potting soil already, which speeds up the growth. The combination of just soil from the farm and manure was very unsuccessful, and only resulted in 3 out of 27 seeds germinating because of the high levels of ammonia in the fertilizer. The mixture of equal parts manure, potting soil, and farm soil was not far behind the 100% potting soil group and seems to be the most effective texture for making the soil blocks. It’s an added bonus that this mixture uses resources that are already on the farm and reduces the amount of external resources needed to produce and transport the potting soil. It is also a less expensive option.

IMG_2623

Week 10: End of Season

Tuesday marked my last day as an intern at Cornell University’s Long Island Horticultural Research and Extension Center. This internship proved to be both enjoyable and educational. I was introduced to the fundaments of scouting, interviewing, research and agriculture in general. This phenomenal experience could not have been possible without the support and guidance of Professor Bjorkmann at the Geneva research station and the Vegetable Extension specialist at LIHREC, Sandy Menasha. As a result of this internship I feel more secure in my decision to continue to pursue a degree in Agricultural Sciences, and I am eager to use my new knowledge in all my future endeavors.

IMG_3792

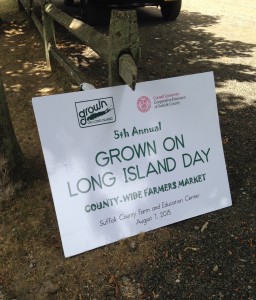
Celebrating my last day at the annual Grown on Long Island Day farmers’ market

IMG_3786

Saying goodbye to the plethora of cabbage loopers on our crops


Fun Work Days

As a part of my internship, I encountered many opportunities to attend agriculturally-related events as well as visit beef cattle farms in the Finger Lakes Region.

The first event I attended while working under the NMSP was the Cornell Seed Growers Field Day, where the topic of discussion focused on small grains and forages. Many speakers talked about the varieties of small grains and forages, all providing pros and cons for each option. Identification and prevention of disease and pests were other components of the seminars given at this field day.

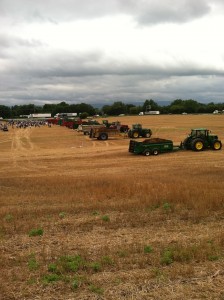
The second event, the North American Manure Expo, was located in Chambersburg, PA. The morning was filled with seminars on manure application (specifically injection) and the benefits of injection. Tractors and manure application equipment lined the Expo grounds as well as exhibits with businesses, services and research projects for public display. Demonstrations for dry- and liquid-based manure ended the Expo, leaving the audience impressed with the liquid injection of manure.

Manure injection was the primary project I worked on this summer, so the event was an eye opening experience since it showed me how my research with NMSP was part of a bigger picture in the scheme of agriculture.

Manure Expo Demonstrations

Manure Expo Demonstrations

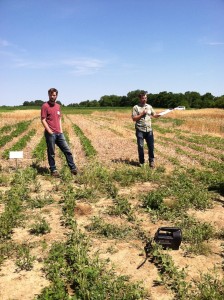
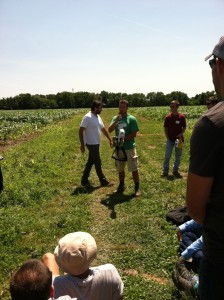
The Aurora Field Day at the Musgrave Research Farm encompassed most of the research I have conducted with the NMSP and encountered from other Cornell University research programs this summer. Many interns from other programs at Cornell participated in the trials happening at the research farm. Besides learning about all of the research happening at Musgrave, it was satisfying hearing my supervisors explain our greenhouse gas emissions, manure injection and green seeker projects I am a working on and, again, hearing the big picture concepts to our research.

Matt Ryan explains his research with cover crops

Matt Ryan explains his research with cover crops

Fellow intern, Isaac, demonstrates how Greenseeker equipment functions in Field Z

Fellow intern, Isaac, demonstrates how Greenseeker equipment functions in Field Z

I made three additional trips (with Quirine’s permission) based off my interests in beef cattle. Nancy Glazier, a Cornell Cooperative Extension small farms specialist, guided me through each event. The first beef-related trip I took part in was a monthly meeting where a group of experienced and inexperienced beef cattle farmers shared their financial struggles in starting up and maintaining beef cattle. I learned a great ordeal from the trip and met a great group of people, which set the stage for my next trip.

These black angus seem to dislike me

These black angus seem to dislike me

The following week Nancy took me on tours to multiple farms raising beef cattle, namely High Point Farm, Adventureland Devons, Just Serependity Farm, and Hidden Canyon Farm. Each location managed their herd with different methodologies and bases of knowledge, making each farm unique. With each visit I gained a lot of advice and support in raising beef cattle.

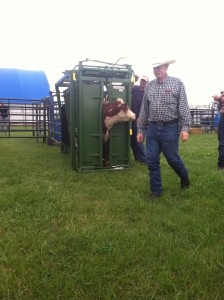
I traveled to Seneca Falls to check out the Empire Farm Days a week after my visits. Similarly to the Manure Expo, there was plenty of farm equipment and exhibits for display as well as seminars on cover crops and soil health. Here I watched Dr. Mike Baker demonstrate cattle handling and received my Beef Quality Assurance Certification (BQA). The required seminar for BQA was long and a test was administered. Following the test, we had to give a cow a subcutaneous injection. I never gave a subcutaneous injection before, so it was quite the experience and no harm was done to the animal.

Dr. Mike Baker shows his audience how the handling system functions

Dr. Mike Baker shows his audience how the handling system functions

Manure Injection Study

The use of manure as an organic fertilizer is a critical component of dairy cropping systems. It essentially allows the farmer to find a cheap, productive use of manure while supplying crops in the field with necessary nutrients.

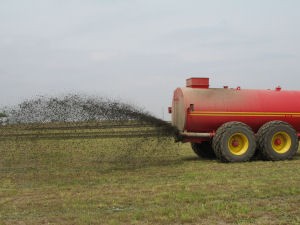
There are many different methods for applying manure. Broadcasting is the most commonly used method of manure application since it is typically fast and cheap. However, you get what you pay for. When the ammonia (NH3) lays on the surface of the soil, you will experience losses in nitrogen due to volatilization, leaving much less nitrogen behind than the initial amount available. Another issue with broadcasting is uniformity. Since the actual distribution of the manure varies with broadcasting, uniformity of application leaves some areas of the field with more/less manure than other. Furthermore, if you live relatively close to “city folk” and plan to broadcast manure, you will receive many complaints about the foul odor from your fields.

The only way to reduce losses and limit odor would be to make another pass through the field and incorporate (disk the manure into the field), and attempting to increase uniformity with broadcast would only create more variability in abundance of ammonia. However, more passes through the field mean more soil compaction, more fuel and more soil disturbance.

Manure Broadcasting

Manure Broadcasting

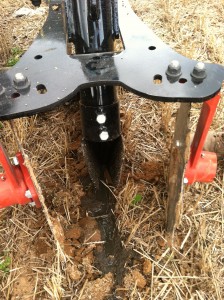
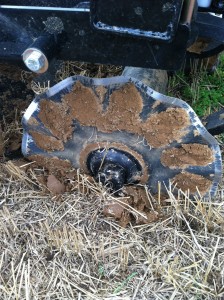
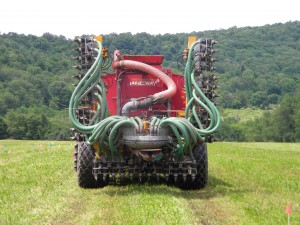
Manure injection is another method in applying manure to fields. With injection, multiple hoses feed from the tank. Disks are used to create slits in the soil large enough to allow manure, which feeds through a series of hoses and exits out of the end from the boot, to enter the first few inches of the soil. Immediately after manure is injected into the soil, another set of disks recovers the manure with the disturbed soil surrounding the slits.

Frontal view of manure injector with boot and disks to recover manure

Frontal view of manure injector with boot and disks to recover manure (from the NA Manure Expo)

Disk used to create a slit in the soil to allow manure insertion

Disk used to create a slit in the soil to allow manure injection (from the NA Manure Expo)


On the other hand with manure injection, the ammonia is buried beneath the soil, eliminating major losses due to volatilization. With more ammonia preserved in the soil over the course of the growing season, the need for side dressing later in the season can be eliminated, saving farmers thousands of dollars. In addition, the manure is covered underneath the soil, drastically reducing odor in the field. Another benefit of injection includes uniformity of application. With uniform application, nutrients are dispersed evenly, and with this, the likelihood of excess or deficient amount of nutrients will be much less prevalent throughout the field. However, injection requires experience, so the process of applying manure will become faster and more efficient over time.

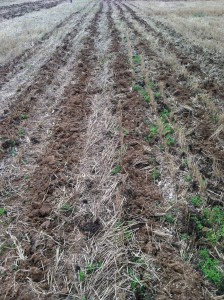
Injected Manure

Injected Manure

Here at NMSP, I am partaking in a project to determine the impact of manure injection on grass and alfalfa yield and quality, stand health, environmental indicators (soil nitrate, phosphorus and potassium) and greenhouse gas emissions.

For our manure injection research, we used four different fields (Fields 33 and 47 near the Cornell University Ruminant Center and Field Z Grass and Alfalfa at the Musgrave Research Farm). The fields at CURC each contained six replications (rep), and each rep contained four plots. The alfalfa field at Musgrave contained 12 reps and the grass field contained six reps. Four treatments were used in our study: broadcasting, injection with manure, injection with no manure, and no injection and no manure (control). Each plot in every replication represented one of four the treatments. We used, in collaboration with Scott Potter, a Veenhuis manure injector model for our trial.

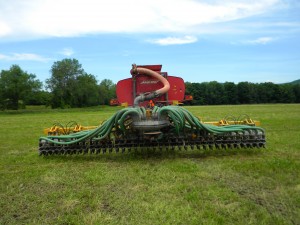
Veenhuis Manure Injector with wings folded up

Veenhuis Manure Injector with wings folded up

Veenhuis Manure Injector

Veenhuis Manure Injector

No manure was applied to the fields before the first cut of grass and alfalfa. When the time was right to harvest the alfalfa, we cut samples from the fields with clippers that resemble hand sheers used in sheering sheep. We determined the yield per acre from the three quadrats (frames with a 3’ x 1’ dimension) of samples from each plot once they were dried in the Caldwell ovens for least four days at 60 degrees Celsius. Once weighed, the samples were grounded so they could be sent to and analyzed in the lab. Once the first cut was harvested, we readied for manure application.

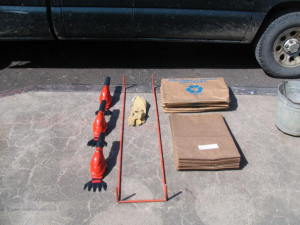
Quadrat with clippers used to collect plant samples

Quadrat with clippers, gloves and paper bags used to collect plant samples

As for our second cut, we repeated the same procedure for hand harvesting with no further manure application for the rest of this year’s trial, and we are hoping to get our third cut in soon. We are still looking over and collecting data, so there are no inconclusive results from our study yet.

Crossing the Finish Line: Back to St. Louis

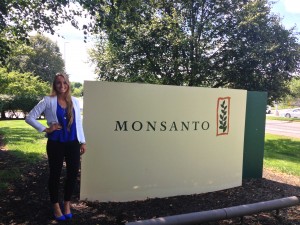
Just a glimpse of the Monsanto main campus in St. Louis.

Just a glimpse of the Monsanto main campus in St. Louis.

Just as our internship this summer began with a training week in St. Louis, MO at the company headquarters, we finish with a final wrap-up week back at the same location. While the first week was all about preparing us for our role and helping us to understand what to expect, the final week is all about recapping our experiences and gauging what we learned throughout our time with the company.

After catching up with friends and sharing our own adventures, we worked on adding finishing touches to our presentations, practicing our deliveries, and brushing up on our interview questions. The day after our arrival, we all broke out into different groups to present our corporate projects with our student teams and mentors. Each student was evaluated by the designated mentors with a form, which would eventually be used to critique our possible return for another internship or trainee position after the conclusion of the week. In my case, I gave two presentations: One was the wrap-up of my summer experience with brief comments about my corporate project, and one solely dedicated to the Vistive Gold project to the special analytics team (the rest of the students combined their comments about their summers and projects into one presentation). We were asked to give two because this was the first time data regarding grain-handling facilities was recorded and they wanted to get an idea for it right away.

After a break from presenting, everyone had the opportunity to sign up for an interview slot. For rising seniors, they could interview to be DSMTs (District Sales Manager Trainees), and for rising juniors, they could interview to be retuning interns. I decided to interview for the returning role, which I can gladly say I was offered another position that I accepted for the summer of 2016.

Later in the day, all of the interns had the chance to sit down and eat lunch with their St. Louis connection, or an employee at the headquarters who somewhat acted as a “link” or a “sponsor” just to be there to answer questions and provide guidance over the course of the internship. I was already well acquainted with mine prior to the beginning of the internship, as I had the opportunity to travel to St. Louis in December of 2014 to meet with different individuals in roles across the company as hosted by an upper-level member of Monsanto, which I am very grateful for as it gave me the chance to get to know many people before arriving. My St. Louis mentor and I talked about where I could take my experience with Monsanto in the future, and it really helped capture my interest in post-graduate careers.

As the few days wrapped up, we turned in our equipment and vehicles and prepared our trips back home, all leaving with a great experience, good friends, and a new perspective in working in the agricultural business world. I am nothing short of impressed with the company and the learning opportunity they provided us. See you next summer, Monsanto!

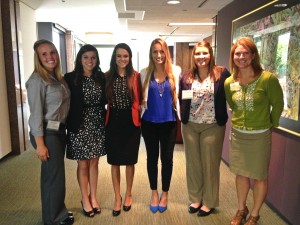
The power ladies of the Vistive Gold project & our mentor.

The power ladies of the Vistive Gold project & our mentor.

A remarkable experience at a remarkable company.

A remarkable experience at a remarkable company.

Skip to toolbar