
The last day of field work of my summer intern

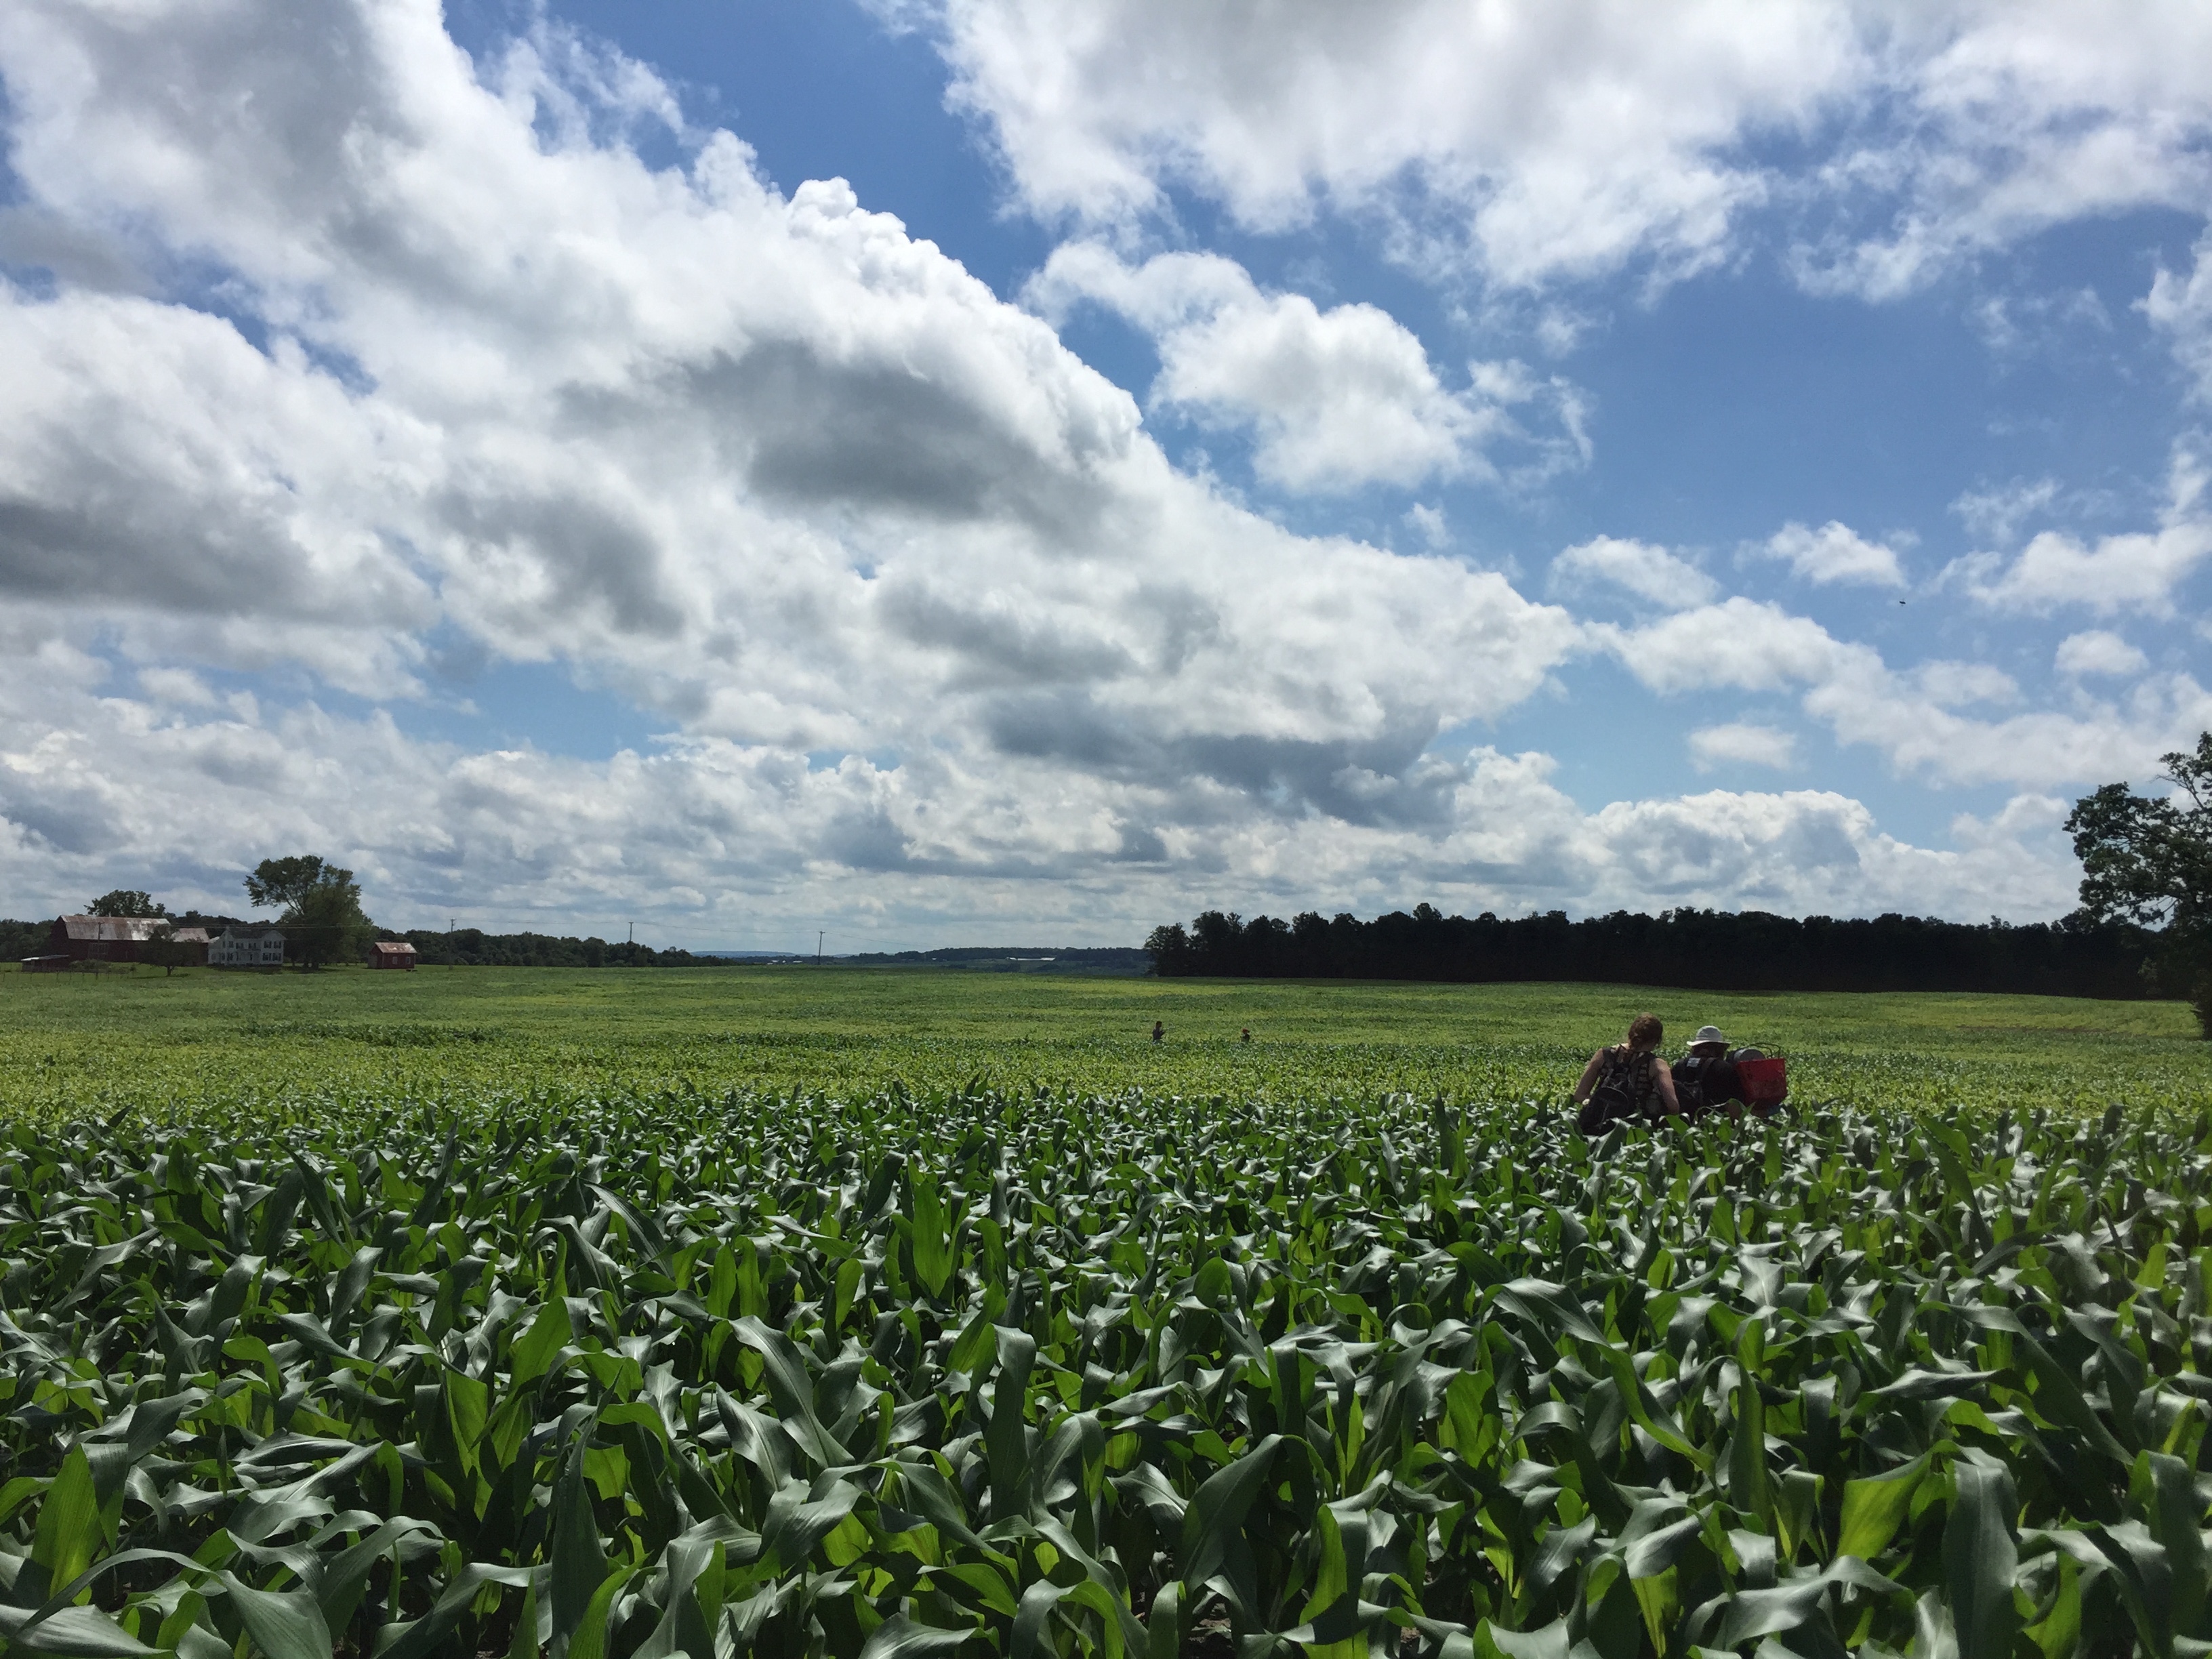
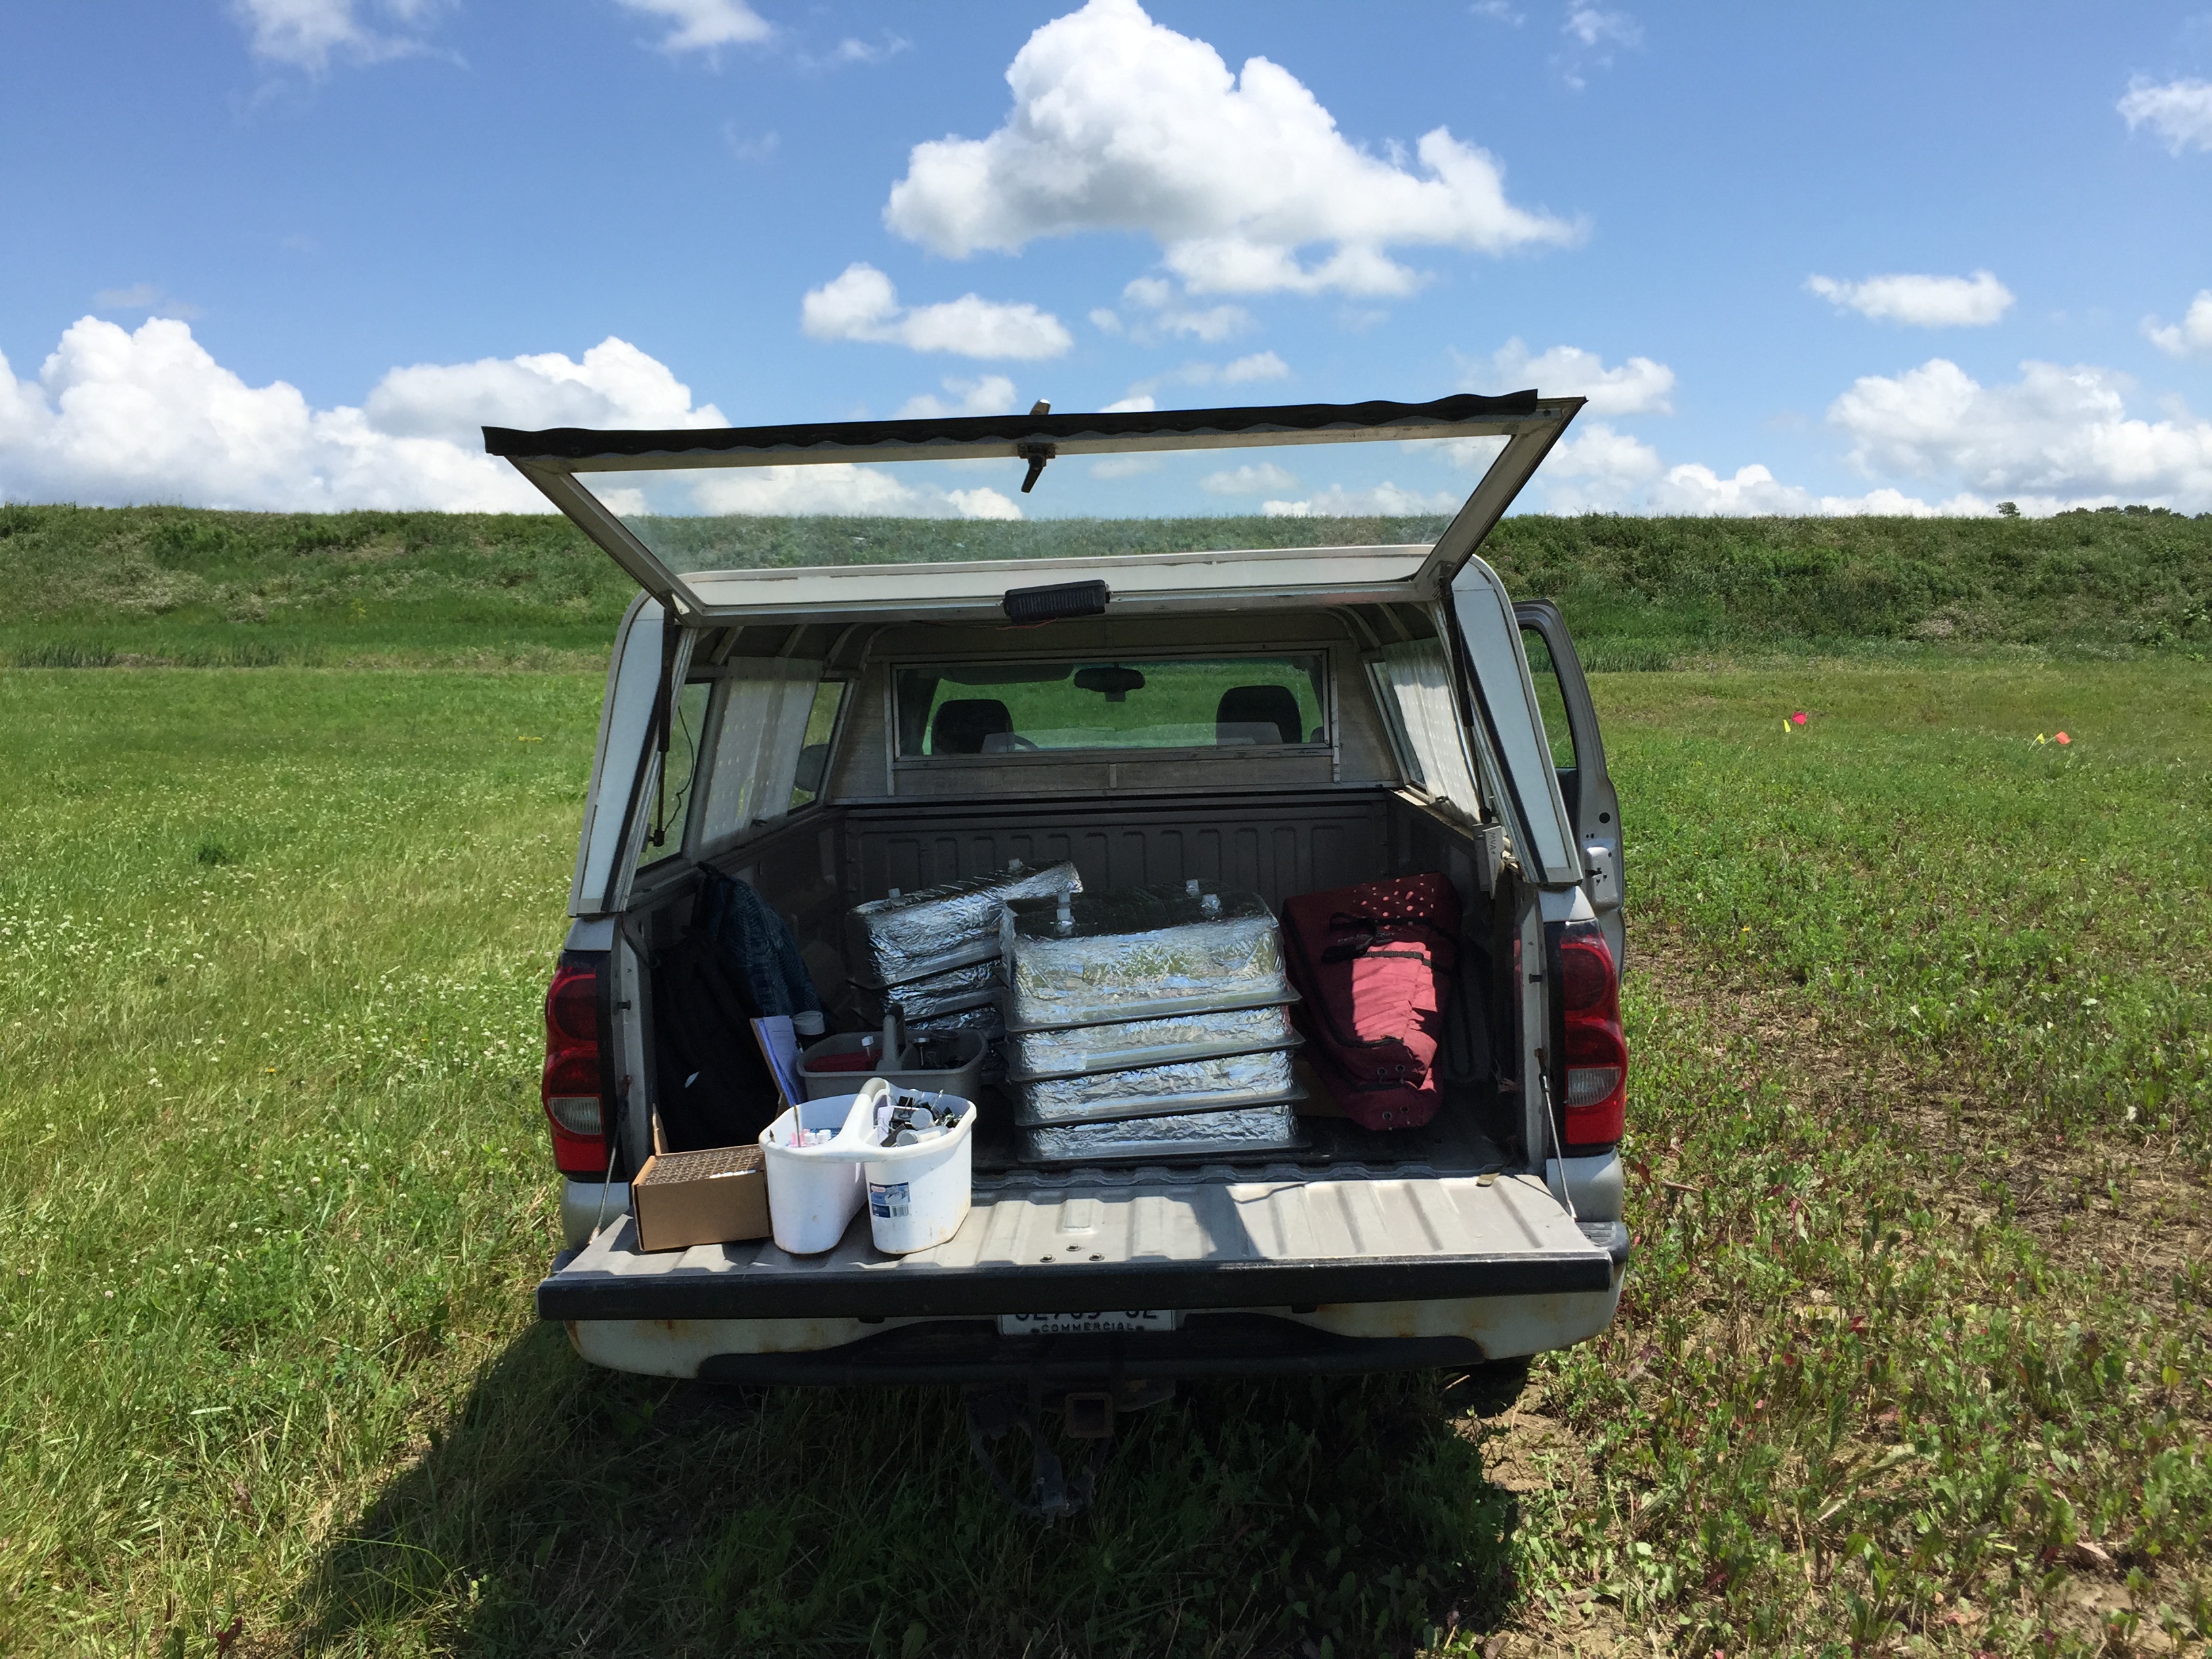
Last Friday, Aug 21th, was my last day of field work of my summer intern. Amir, Greg and I went to Aurora Research Farm to collect green house gas sample in the corn field.

IMG_5411

It was a nice day to do field work, as the weather is not so hot and is not cold either, and on that day I finished my work quite smoothly, making no small mistakes.

IMG_5409

I remember that on the first day that I learned to do the collecting work, Amir instructed me very patiently, making sure that I understood every single step.

I also remember that there’s one extremely cold and windy day, Amir, Jeff and I worked in Aurora that day, and Jeff didn’t know it was such a cold day, and thus was still wearing his T-shirts and shorts, and he got a cold after that day’s work.

I also remember that there’re more than one day when it’s very dry in the field, and the soil became very compacted, so some bases of our chambers got out of the soil. Dennis, our hercules, hammered heavily on the wood board above the base, to put the base back to the soil.

This is the first summer I spend abroad in the US, it’s so lucky for me to have such a valuable chance to work in NMSP with these interesting and great people.

IMG_5415

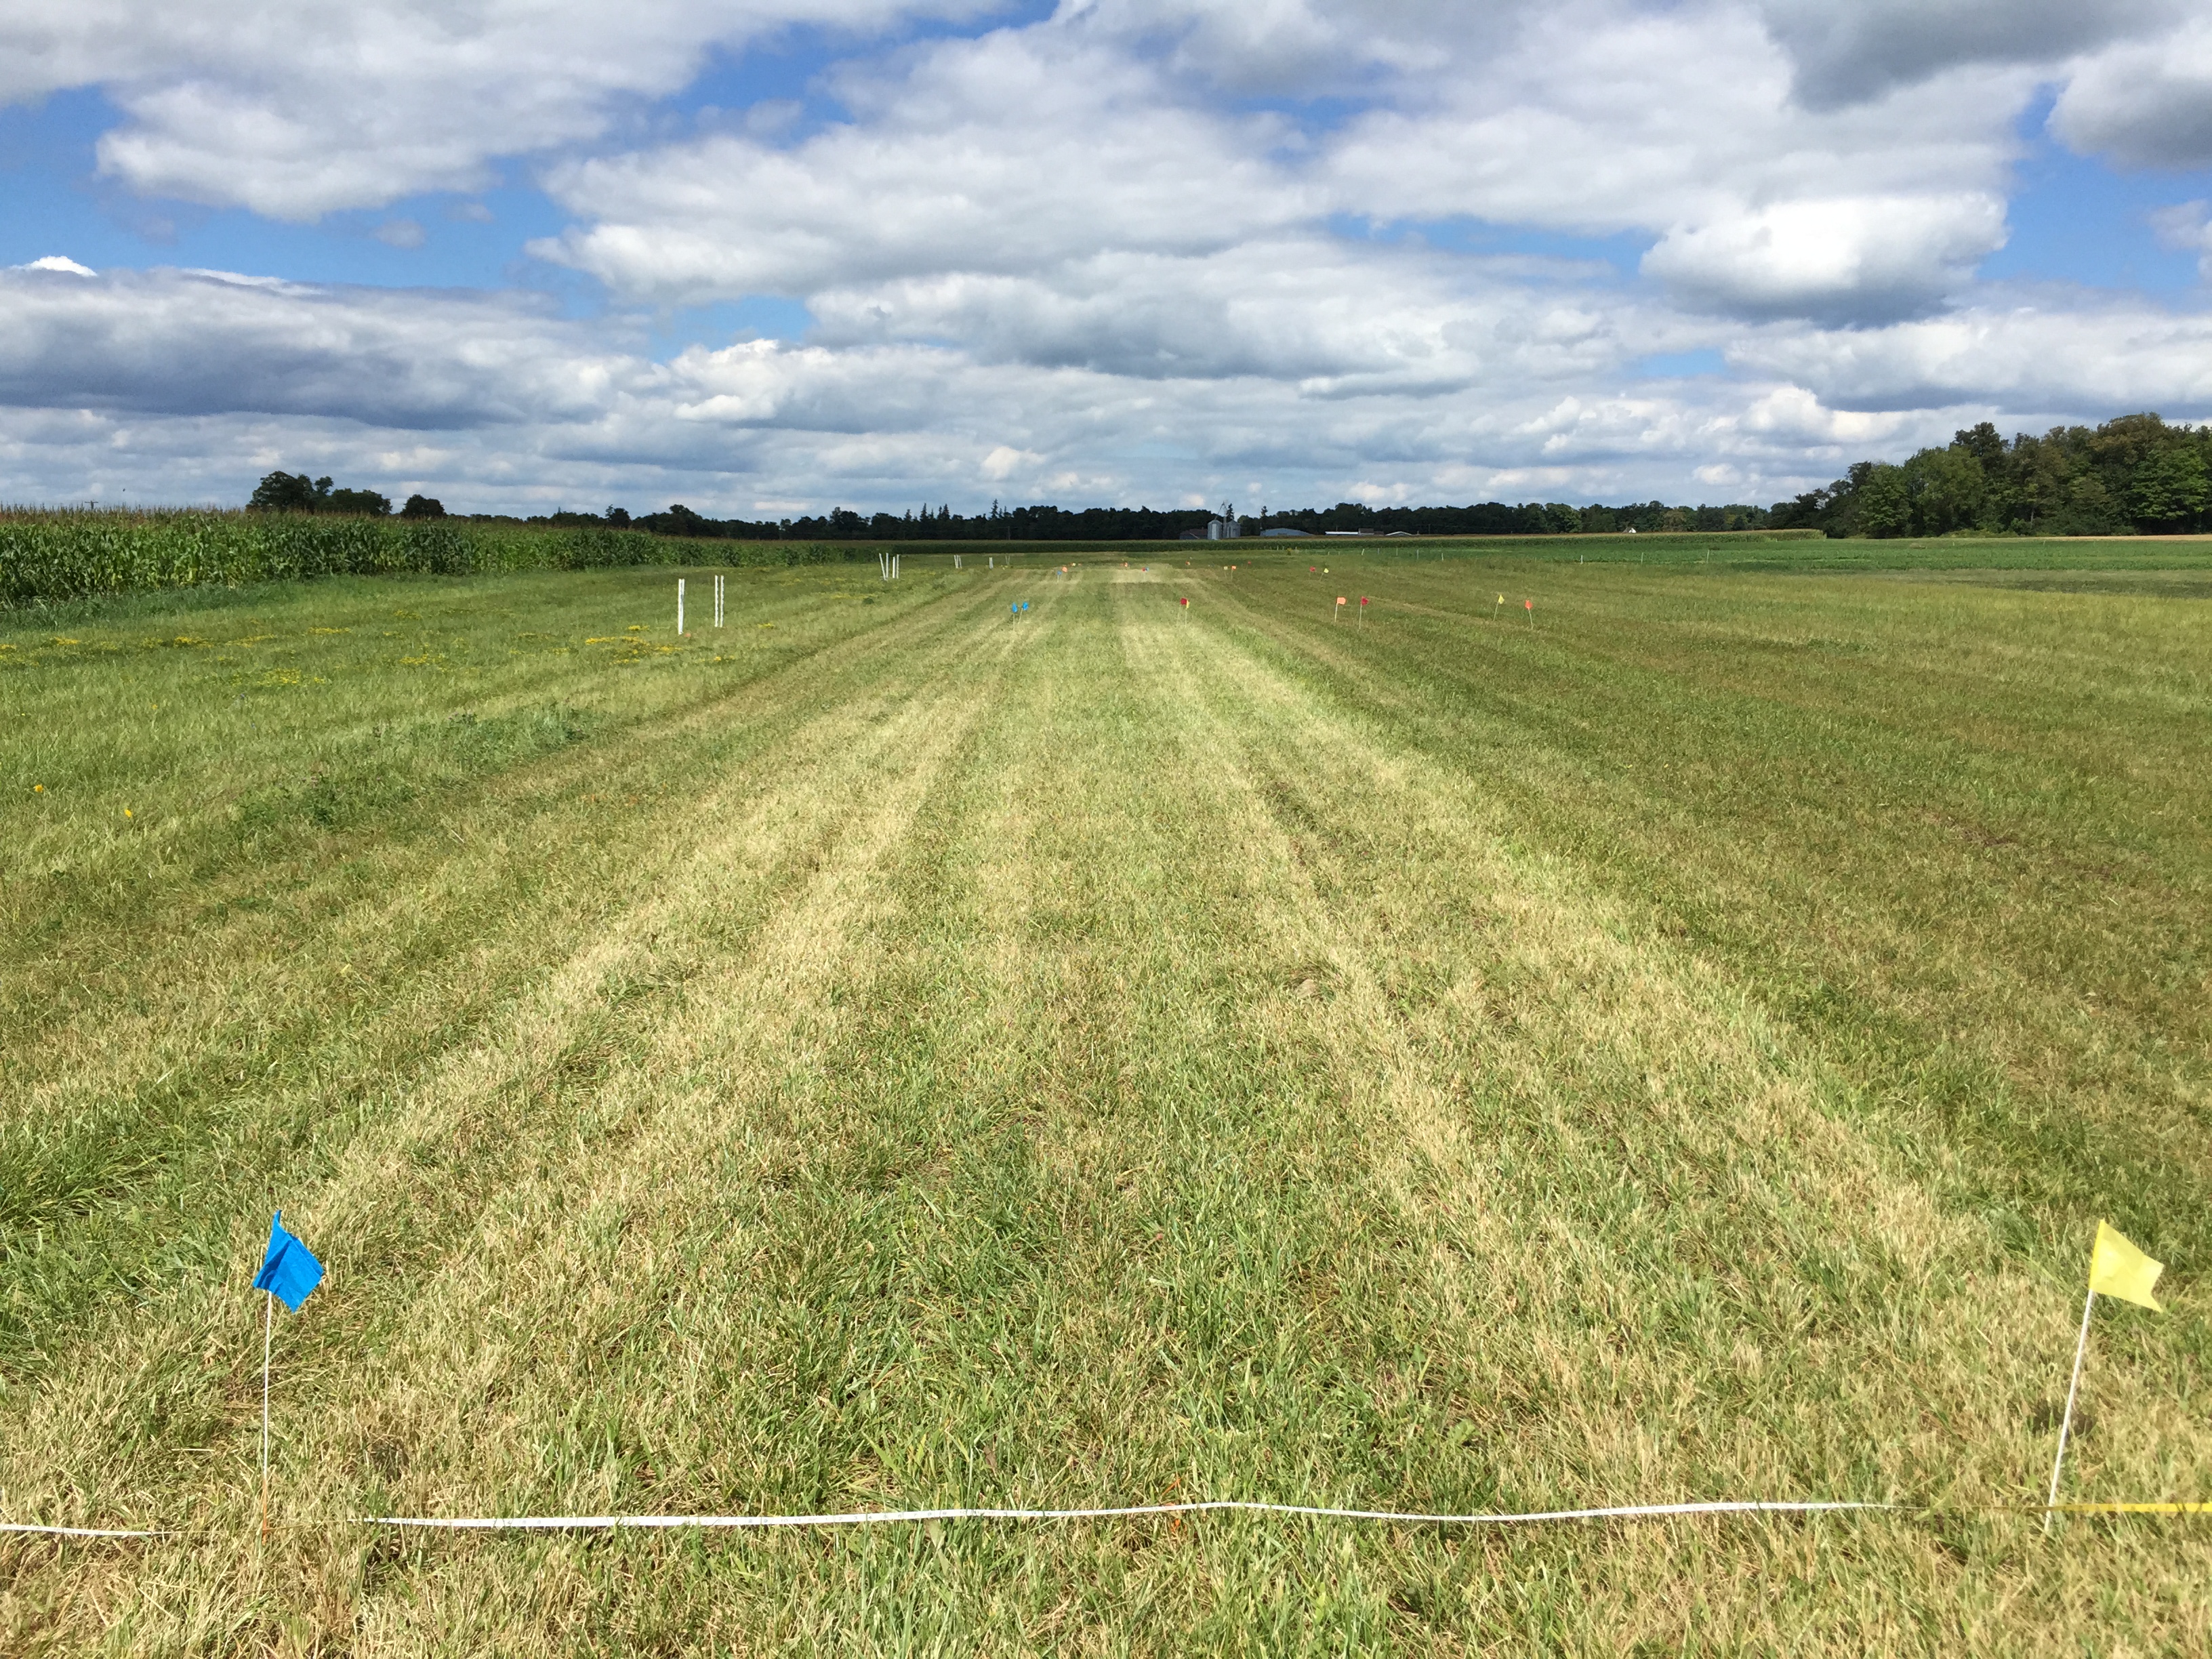
At the end of the day, Amir and Greg were talking about the tall fescue grassland. They harvested the grassland just several days before, so the grassland seemed to be very flat. Amir said, I really like to look at the grassland in this direction, this is my favorite scenery. Greg said, yeah, it’s really nice, it looks like an airplane runway. A lot of people have worked in this “airstrip”, someone have left, someone is still working on it, and I hope everyone’s life and career can take off from here soon.


MERN calculation and the criteria to determine the optimum model when fitting

I wrote a blog post about the models used to fit the data of yield nitrogen fertilizer response in my winter cereal project:

https://blogs.cornell.edu/agsci-interns/?p=2918.

There are five models in it: quadratic model, exponential, square root, quadratic plateau and linear plateau model. However, the reason why we need to fit these models is that we need to calculate the MERN (Most Economic Rate of Nitrogen), and based on different models, the most MERNs are various.

  • The following is the general way to calculate the MERN:
Max(pY(N)-wN)

where N refers to the nitrogen fertilizer rate, Y(N) refers to the corresponding yield under that nitrogen fertilizer rate, p is the assumed unit price of dry biomass of forage yield, and w is the assumed unit price of the nitrogen fertilizer. Let

F(N)=pY(N)-wN

F(N) is maximized when the first derivative of F(N) equals zero, so

F'(N)=pY'(N)-w=0 

so that MERN is calculated by solving this equation:

Y'(N)=w/p
  • The necessity of selecting the optimum model:

an example of how MERNs are various based on different models, using the data from a site.

various MERN

The MERNs range from 94.23 to 68.52, and the yield at MERN ranges from 1.079 to 1.101 in this site, and the yield’s range can be much bigger in other sites. The diversity of MERNs suggests that in some cases, the farmers may apply too much nitrogen fertilizer using improper model, which would lead to the waste and pollution of N fertilizer, while in other cases, the farmers may apply too little nitrogen fertilizer using improper model, which would result in less yield of forage.

  • The criteria to determine the optimum model:

Traditionally, a lot of researchers tend to use the coefficient of determination to measure the goodness of these models, but many papers point out that in some cases, the R square of these models are very close and all high enough. For instance, if the R squares are 0.8543, 0.8678, 0.8462, 0.8514, 0.8401 respectively, there’s no significant difference between them, and they are all close to 1. It’s not a good idea to draw a conclusion of which is better directly from the coefficient of determination.

Similarly, some use criteria like root mean square error, residual mean square etc. , which have similar function and magnitude with R square.

In general, one important criterion to evaluate a regression model is its normality, and thus the normality of the residuals, which is the observed yield minus predicted yield based on the regression model, is regarded as a significant criterion in some paper.

residuals when fitting a square root model

In the plot above, the data of residuals are plotted with the corresponding nitrogen treatment. If the data point is above the x-axis, then the regression model tends to underestimate the yield, while if the point lies beneath the x-axis, then the model tends to overestimate the yield. Therefore, under the same treatment, when the data points lie symmetrically between two sides of the x-axis, the normality of the residuals are good enough, or the regression model has systematic bias.

deviation from mern

Also, after calculation of MERN, some use the nitrogen treatment deviation from MERN instead of nitrogen treatment as the x-coordinator. It has similar function, but focuses more on whether there’s any systematic bias around MERN.

In addition to using residual plots to visualize the goodness of the normality, some use Shapiro-wilk test to quantify the normality of the residuals. The null hypothesis of this test is that the population is normally distributed, so the more the p-value is close to 1, the better the normality is. Similarly, some others use Kolmogorov test to compare the normality, but this test is thought to be less powerful than Shapiro-wilk test.

Eventually, some would calculate the potential economic loss. The general steps of calculating potential economic loss are followed:

  • Assume that one model is the correct model, calculate the MERN and yield at MERN based on this “correct model”
  • Calculate the profit of the “correct model” by using the formula: (yield at MERN*price of forage)-(MERN*price of N fertilizer)
  • Calculate the profit of the other models by using the same formula. The MERN here is still based on the “correct model”, but the yield at MERN is calculated using the “incorrect models” to predict yield at MERN of “correct model”.
  • Calculate the difference between the profit between the “correct model” and the “incorrect models”.
  • Evaluate the risk of choosing the “incorrect models”.

The models used to fit the data of yield nitrogen fertilizer response

As I’ve been working in the project that try to determine the optimum nitrogen rate for double cropping winter cereal in New York State, one basic but important part in it is to fit the yield nitrogen fertilizer response data from individual experiment site into different statistical models.

  • The following is the general regression model:

general regression model

where Yi refers to the yield response variables, β0 refers to the intercept, Xi refers to the nitrogen fertilizer rate, βi refers to the coefficient of the nitrogen fertilizer rate, and εi is the random error.

Then the following is the five specific models based on the general regression model, which is quadratic model, exponential model, square root model, quadratic plateau model and linear plateau model.

  • Quadratic model:

quadratic

where Yi refers to the yield response variables, β0 refers to the intercept, Xi refers to the nitrogen fertilizer rate, β1 refers to the linear coefficient, β2 refers to the quadratic coefficient, and εi is the random error.

  • Exponential model:

exponential

where Yi refers to the yield response variables, β0 refers to the maximum yield when the nitrogen rate is not limited, β1 refers to the increase of yield per unit of nitrogen rate, β2 refers to the nitrogen value in soil with the same unit as the nitrogen fertilizer rate, and εi is the random error.

  • Square root model:

square root

where Yi refers to the yield response variables, β0 refers to the intercept, Xi refers to the nitrogen fertilizer rate, β1 refers to the linear coefficient, β2 refers to the square root coefficient, and εi is the random error.

  • Quadratic plateau model:

quadratic plateau

critical point

where Xm is the critical point after which the increase of nitrogen fertilizer can no longer increase yield, and Ym is the maximum yield. The other coefficients have the same meaning as those in quadratic model. The plateau occurs when the quadratic curve comes to its maximum point.

  • Linear plateau model:

linear plateau

maximum yield

where Yi refers to the yield response variables, β0 refers to the intercept, Xi refers to the nitrogen fertilizer rate, β1 refers to the linear coefficient, and εi is the random error. Xm is the critical point after which the increase of nitrogen fertilizer can no longer increase yield, and Ym is the maximum yield.

I use R to fit the data with these models. Among them, we can easily use linear regression function when dealing with quadratic and square root model. For example:

fit_quadratic<-lm(Yield~I(NTrmt)^2+NTrmt, data= site_1_2013)

However, we need to use nonlinear regression function to fit with exponential, quadratic plateau and linear plateau model. An easy and understandable way to do it is followed:

linear.plateau=function(A,B,C,x){
   ifelse(x<C,A+B*x,A+B*C)
 }
fit_linear.plateau<-nls(Yield~linear.plateau(A,B,C,x=NTrmt),
                        data = site_1_2013,start=list(A=1.33,B=0.017,C=60))

This means that we can create a function of the formula of that model first, and then use this newly created function in the nonlinear regression function.

However, One of the biggest challenges here is to determine the starting value, as it is shown in the code:

start=list(A=1.33,B=0.017,C=60)

The starting value can be regarded as a guessing value of each coefficient. The reason we need to input such a starting value is that only when the starting value is close to the “real value” can the computer find out the “real value” within certain number iterations.

The proper starting value can usually be estimated following these steps:

  • Plot the data point.
  • Understand the meaning of each coefficient, and obtain the possible value of some coefficients based on the plot. For instance, in linear plateau model, β0 is the intercept, so we can estimate β0 by using the intercept of Y-axis in the plot.
  • Select some representative points in the plot, and use the data of these plots in the corresponding formula to calculate possible coefficients. For example, in linear plateau model, we choose two representative points (0,b) and (c,d), where (0,b) is the a point on the Y axis, and (c,d) is the point of highest yield, so that Xm=c, Ym=d, β0=b, β1=(d-b)/c.

Empire Farm Day

Last week, my colleagues and I attended the Empire Farm Day at Rodman Lott and Son Farms. When I arrived, I was surprised to see that there were so many visitors and business men attending this big local event, and soon I found that it was a great opportunity for people like me to know more about agriculture development in New York State.

The first tent we visited was about soil health seminar. We have learned most of the content in the soil health seminar before in soil science courses, but we could  find that the lecturer used simpler words and more examples so that the contents could be easier comprehended and better remembered.

IMG_5348 IMG_5349

There were a variety of agriculture machinaries showing on the grass land. The farmers could conveniently talk to the dealers, in order to know more about the strength of these machinaries.

IMG_5351 IMG_5392

Also, there were a diversity of agriculture equipments that could be used to farm, keep livestock or market in a more convenient and precise way. I suppose that increasing use of such high-tech equipment must be a irreversible tendency nowadays.

IMG_5372IMG_5370

The most exciting thing for me was two alpacas. Before, I had only seen such cute animals on the websites, and I was so surprised to see that there’s a farm of alpacas in New York State. By the way, it’s interesting that these two alpacas showed their “somber” back to people from beginning to end.

I think this kind of event could definitely act as a great platform for local farmers to improve their knowledge, facilities and equipment that were useful for their farming work.

Field Trip in Nutrient Management Spear Program

I am Zhehan Tang and I’m a rising senior in agriculture science major. Luckily, I can spend my first summer abroad in Cornell Nutrient Management Spear Program with Professor Quirine Ketterings, six undergraduate interns and other researchers.

Our team works on several different projects about nutrient management, for instance, some people do research about manure application, some focus on Greenseeker and NDVI, some work on corn stalk potassium study, etc. For me, I work on the project of double cropping winter cereal for forage after corn silage, and focus on the optimum nitrogen treatment of winter cereal.  Although we seven interns work for different projects, we are all willing to go to the field trip when someone need to do experiments in Aurora Research Farm or some other farms.

For me, averagely, I go to the field 2 days a week, and I always feel excited about the field trip, because born in a big city, I have never done so many experiments in the field, and almost doing everything in the field can be a new experience for me.

I remember that my first field trip was with Rachel, Issac and Aritotelis. We applied nitrogen fertilizer in the corn field for the entire afternoon. We have nine plots in that huge corn field, which I thought was the biggest corn field I have ever seen. Carrying bags of urea and walking through the field from plot to plot was a tiring but impressive experience. I felt like we were on a small boat in a green ocean, and when I walked across a line of tall corn, the leaves were just like green waves, and sometimes when I was in a low land, I couldn’t even see the edge of the field.

IMG_5156

From then on, I have done several times of green house gas emission extraction in Aurora with Amir, who is a post-doctor in our group.

IMG_5172

The picture above is the truck filled with the chambers, moisture meters, needles, tubes and other equipments that we use to do the green house gas extraction experiment.

IMG_5174Basically, we put chambers on the bases, which was fixed in the soil before. Then, we use clamps to make the gap between chamber and base small enough so that no gas will get out. Every two or one and a half minutes (depending on the field type), we use needles to extract the gas from the chambers and collect gas samples in small tubes. In the meantime, we need to measure soil temperature and soil moisture close to the chambers. I find that this is really a labor intensive and time consuming work, as one person can only manage an individual plot in an entire hour.

It’s true that these field works are all laborious, but maybe due to curiosity and novelty, I feel that field trips bring me a lot of fun.

Skip to toolbar