Vipan Kumar1, Michael Helms2, Mike Hunter3, Mike Stanyard4
1School of Integrative Plant Sciences -Soil and Crop Sciences Section, Cornell University, Ithaca, NY 14853, 2Cornell Pesticide Safety Education Program, 3Field Crops IPM Coordinator, New York State Integrated Pest Management Program (NYSIPM), Redwood, NY, 4Cornell Cooperative Extension Northwest New York Dairy, Livestock, and Field Crops Program
On February 06, 2024, the U.S. district court in Arizona vacated 2020 registrations of three dicamba containing products (XtendiMax, Engenia and Tavium) for over-the-top (OTT) applications in dicamba-tolerant (Xtend and XtendFlex) soybean. In response to the U.S. district court ruling, the EPA issued an Existing Stock Order on February 14, 2024, that allows limited sale, distribution, and use of these dicamba OTT products that were already in the possession of growers, distributors or in the channels of trade and outside the control of pesticide companies as of February 06, 2024.
According to this Existing Stock Order, the manufacturers/registrants are no longer allowed to distribute these dicamba products in the US other than for disposal or lawful export. However, any dealer with an existing stock may sell these dicamba products until May 31, 2024 (cutoff date in New York (NY)). If soybean producers and applicators in NY are planning to grow Xtend or XtendFlex soybean and thinking to use these dicamba products in 2024 growing season, they should consider the following important points:
Only three dicamba containing products (XtendiMax, Engenia and Tavium) are labelled for OTT applications in Xtend or XtendFlex soybean.
Only certified applicators (private or commercial) are allowed to use XtendiMax, Engenia and Tavium herbicides for OTT applications in Xtend or XtendFlex soybean.
NY growers and applicators must read and understand the EPA’s Existing Stocks Order on the use of XtendiMax, Engenia and Tavium herbicides for OTT applications in Xtend or XtendFlex soybean.
Product that dealers had on hand prior to February 06, 2024 can be sold or distributed in NY through May 31, 2024 (the cutoff date for NY).
Applicators are allowed to use existing stocks of these dicamba products for OTT applications in Xtend or XtendFlex soybeans until June 30, 2024 (cutoff application date for NY).
The NY registrations for XtendiMax, Engenia and Tavium herbicides are set to expire on July 31, 2024. Unfortunately, there are no CleanSweepNY programs currently scheduled for 2024, so alternative disposal options may need to be found.
Mandatory dicamba training: Applicators must take mandatory annual dicamba training before applying XtendiMax, Engenia and Tavium herbicides in Xtend or XtendFlex soybean. These online dicamba trainings are offered by following manufacturers/registrants:
Training is reciprocal across brands and applicators only need to take one dicamba-specific training each year (i.e. only one training session either from BASF, Bayer or Syngenta). Contact your local dealer for further information.
Note that other dicamba-containing products (e.g. Banvel, Clarity and the many generics) are not labelled for OTT applications in Xtend or XtendFlex soybeans. However, some glyphosate products (Roundup PowerMax, Durango, etc.) can be used in OTT applications in Xtend or XtendFlex soybeans. Some glufosinate (Liberty) products can only be used for OTT applications in XtendFlex soybean, not in Xtend soybean.
Disclaimer: Brand names appearing in this publication are for product identification purposes only. Persons using such products assume responsibility for their use in accordance with current label directions of the manufacturer.
Juan Carlos Ramos Tanchez1, Kirsten Workman1,2, Allen Wilder3, Janice Degni4, Paul Cerosaletti4, Dale Dewing4, and Quirine M. Ketterings1
Cornell University Nutrient Management Spear Program1, PRO-DAIRY2, Miner Agricultural Research Institute3, and Cornell Cooperative Extension4
Introduction
Manure contains all seventeen nutrients a plant needs, making it a tremendously valuable nutrient source for crop production. Applying manure to fields can also build soil organic matter, enhance nutrient cycling, reduce reliance on commercial fertilizer, and improve overall soil health and climate resilience. The Value of Manure Project of the New York On-Farm Research Partnership is funded by the New York Farm Viability Institute (NYFVI) and the Northern New York Agricultural Development Program (NNYADP). This statewide project evaluates nitrogen (N) and yield benefits of various manure sources and application methods to corn silage and corn grain crops. Eight trials were conducted in 2023, adding to three trials established in 2022. Here we summarize the findings of the trials conducted in 2023.
What we did in 2023
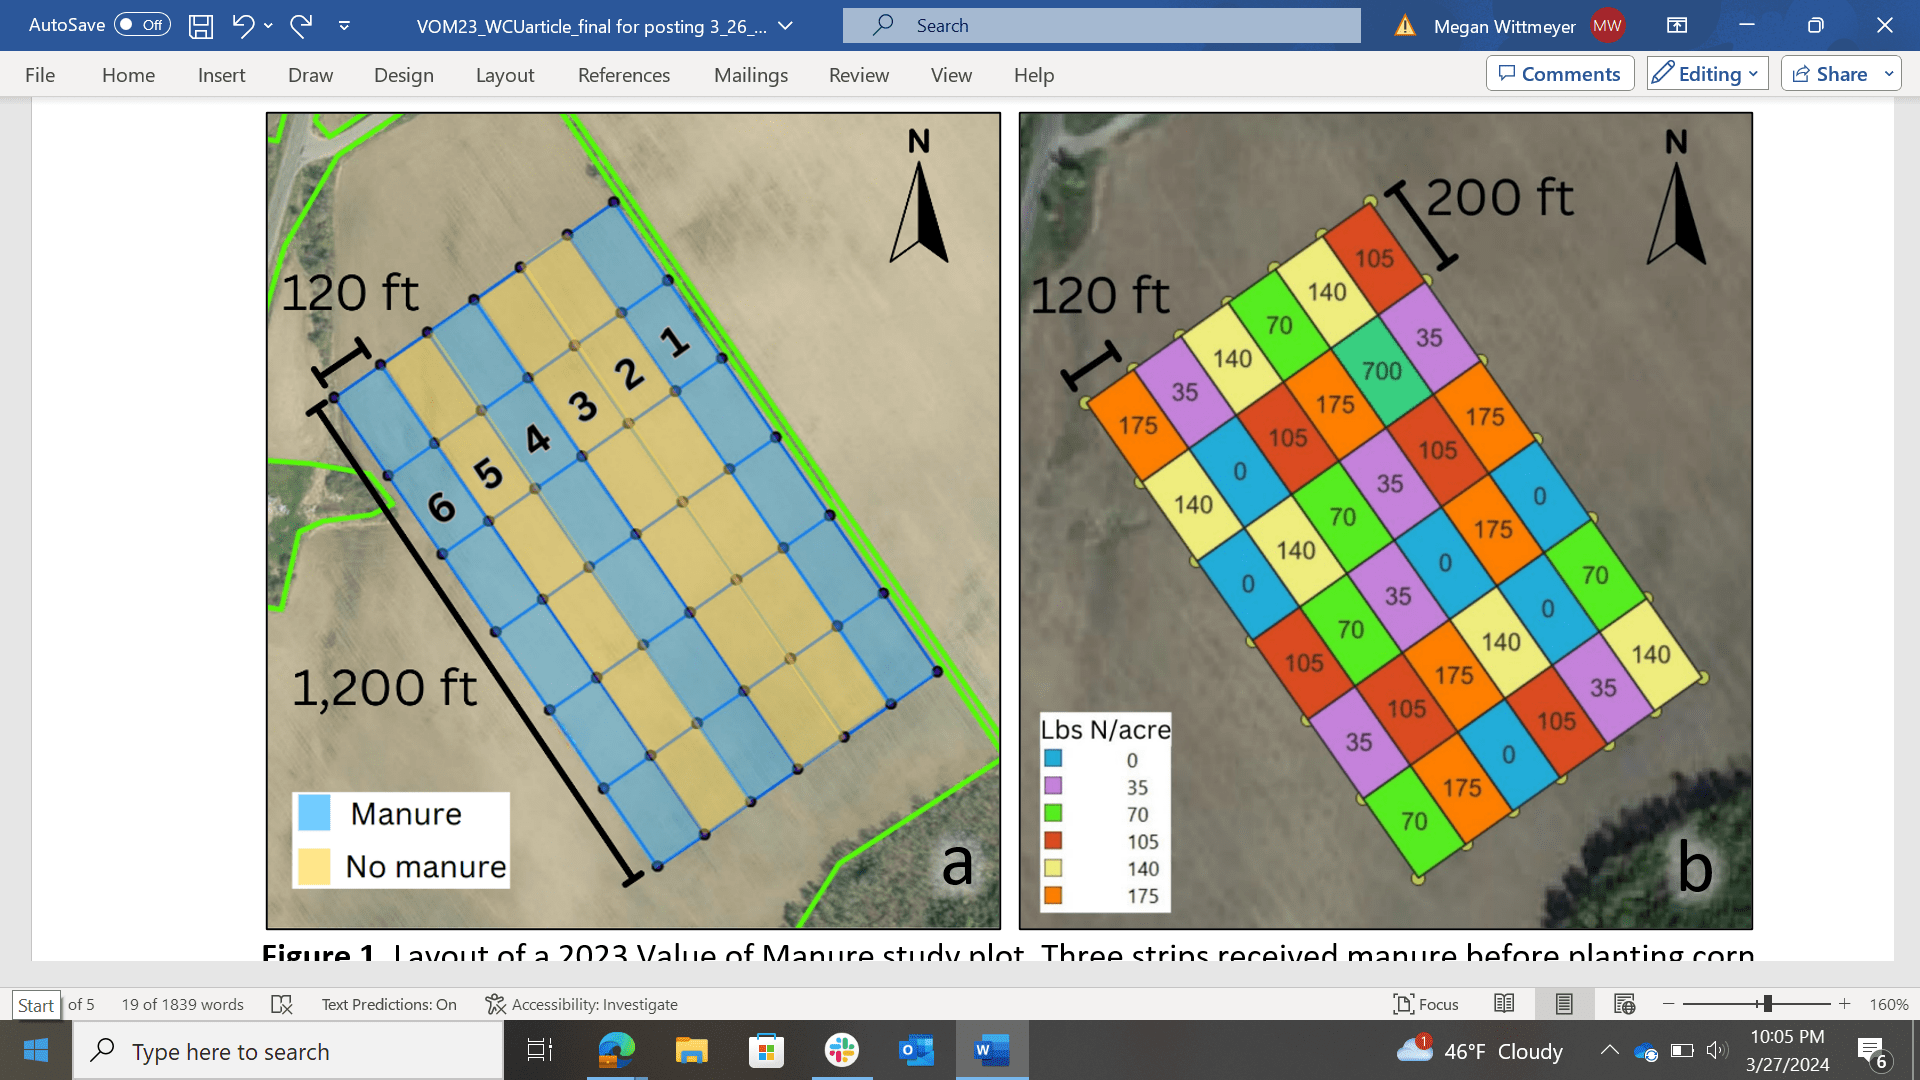
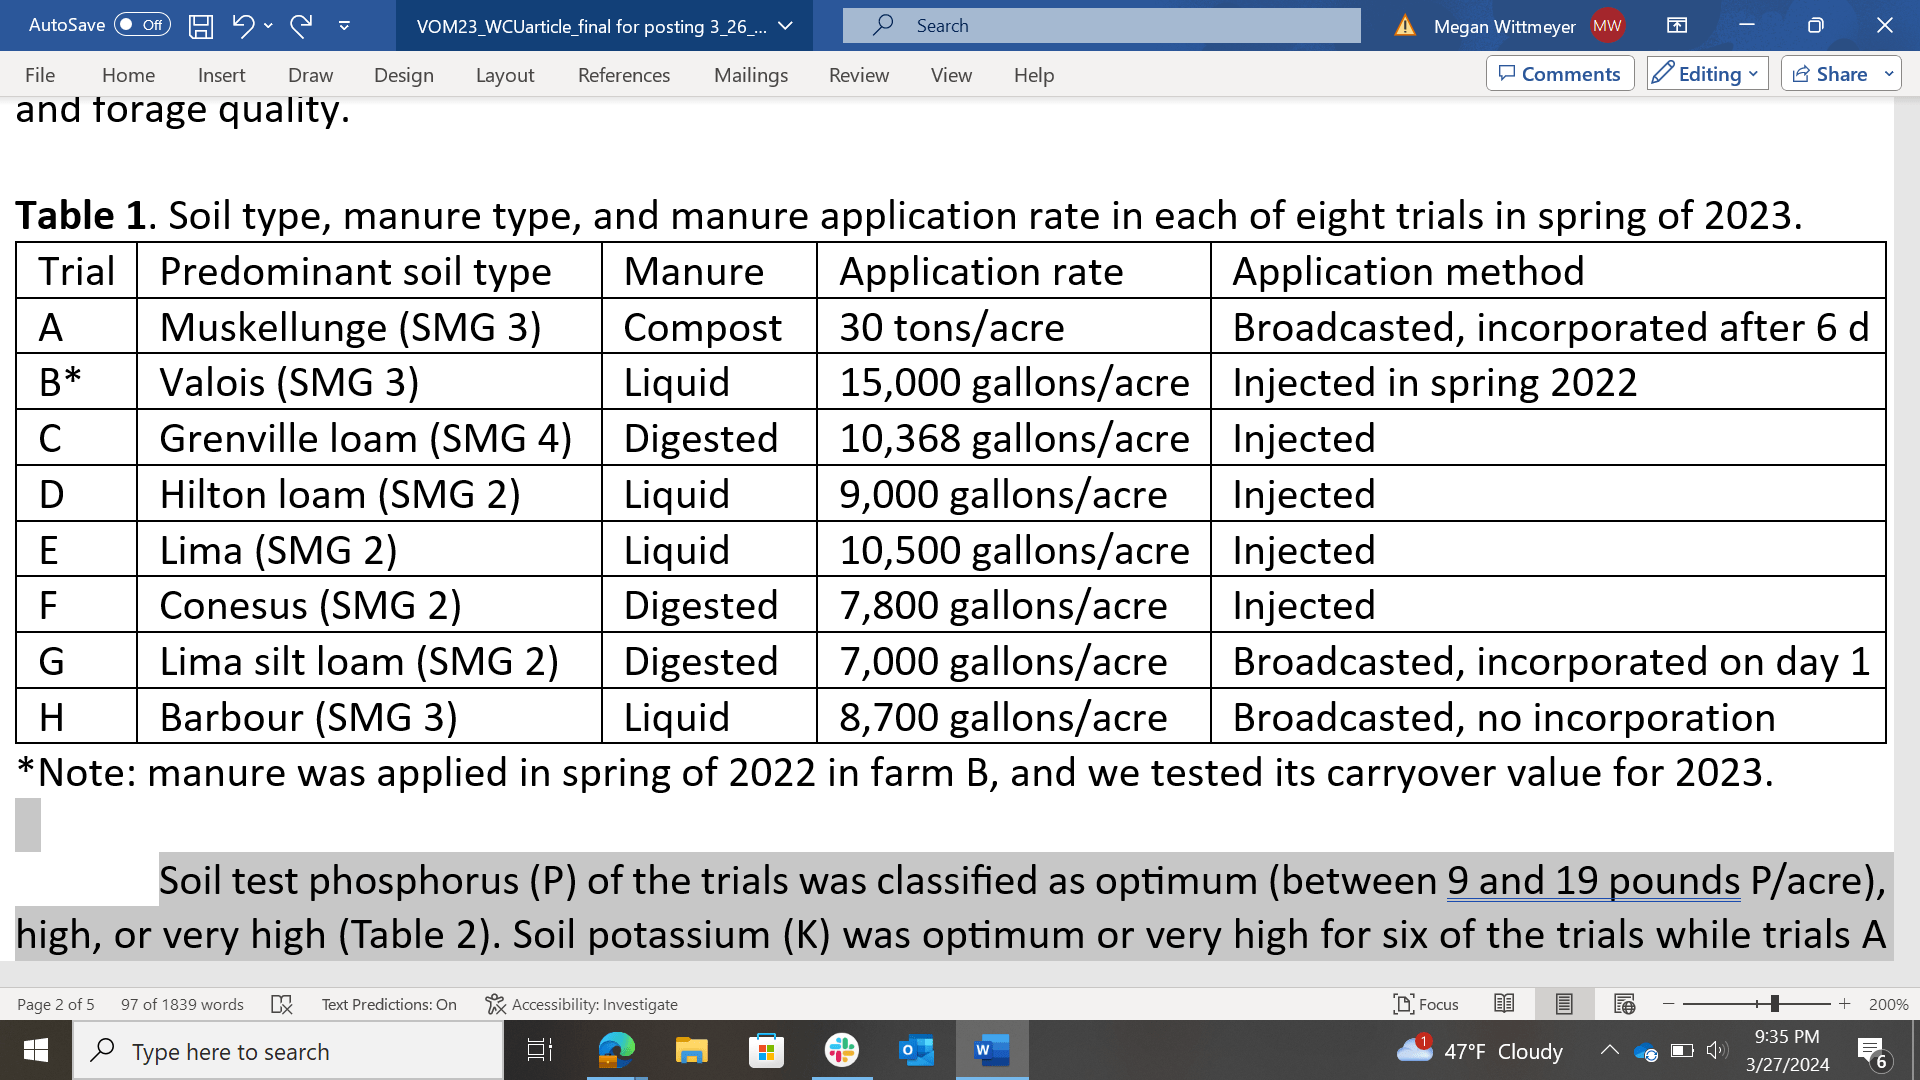
Trials were implemented within commercially farmed corn fields in western (2 trials), northern (2 trials), central (3 trials), and southeastern (1 trial) New York. Each trial had three strips that received manure and three that did not, for a total of six strips per trial (Figure 1a). One trial (Trial B) received manure in spring of 2022. For this trial we tested carryover benefits into the 2nd year (2023). For all other trials, manure was applied in spring 2023 before planting corn. Manure source and application method varied across sites (Table 1).
Figure 1. Layout of a 2023 Value of Manure study plot. Three strips received manure before planting corn (1a). At the V4-V6 stage each of the six strips received six different inorganic N sidedress rates (1b).
Strips were 1200-1800 ft long and 35-120 ft wide for all but one site, where strips were 300 ft long 35 ft wide. When corn was at the V4-V6 stage, each strip was divided into six sub-strips (Figure 1b) and subplots were sidedressed at a rate ranging from 0 up to 300 pounds N/acre. Sidedress rates were trial-specific, based on the expected N requirement of each field. For each trial, we measured manure nutrient composition, general soil fertility, Pre-Sidedress Nitrate Test (PSNT), Corn Stalk Nitrate Test (CSNT), yield, and forage quality.
*Note: manure was applied in spring of 2022 in farm B, and we tested its carryover value for 2023.
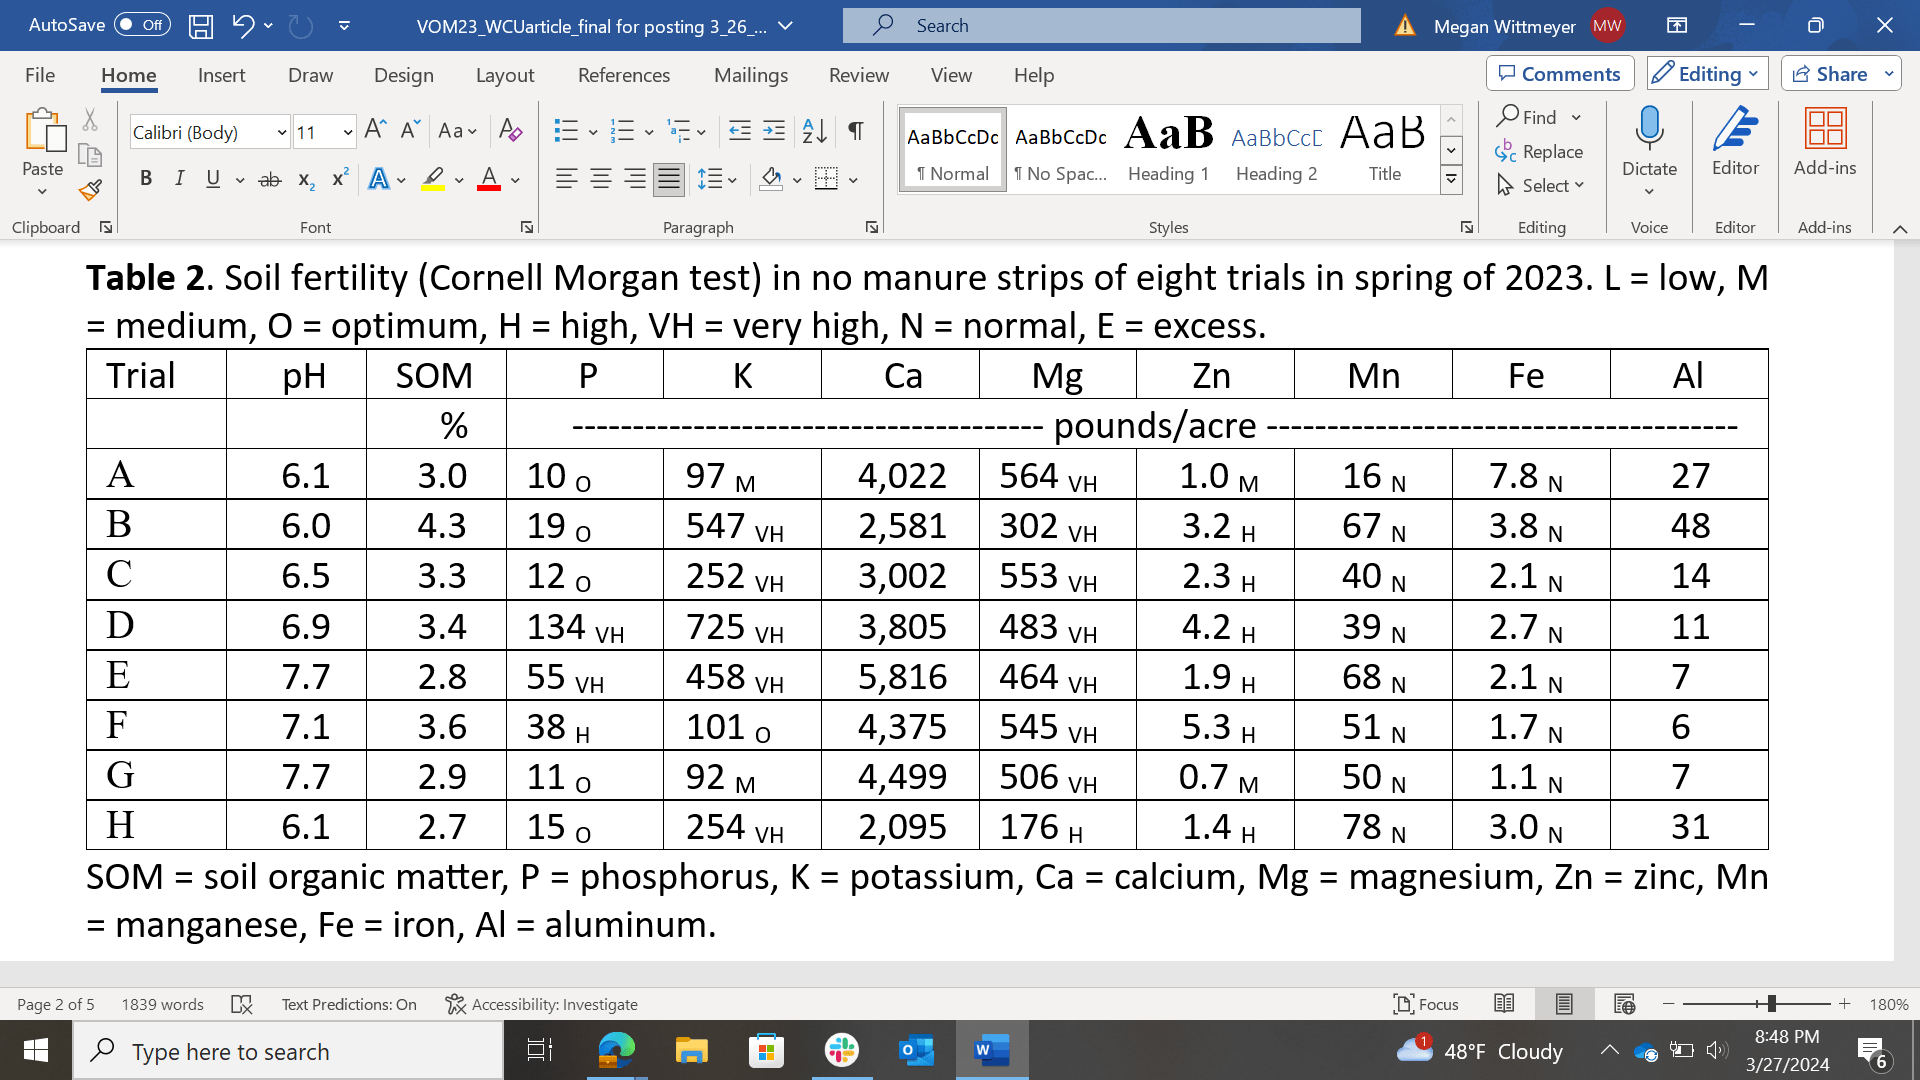
Soil test phosphorus (P) of the trials was classified as optimum (between 9 and 19 pounds P/acre), high, or very high (Table 2). Soil potassium (K) was optimum or very high for six of the trials while trials A and G tested medium in K. Magnesium soil test values were high (> 101 pounds Mg/acre) or very high. Soil test zinc (Zn) was medium for trials A and G (between 0.5 and 1.0 pounds Zn/acre) and high for all other trials. Manganese and iron were in the normal category (< 49 pounds Fe/acre, < 99 pounds Mn/acre).
SOM = soil organic matter, P = phosphorus, K = potassium, Ca = calcium, Mg = magnesium, Zn = zinc, Mn = manganese, Fe = iron, Al = aluminum.
What we have found so far
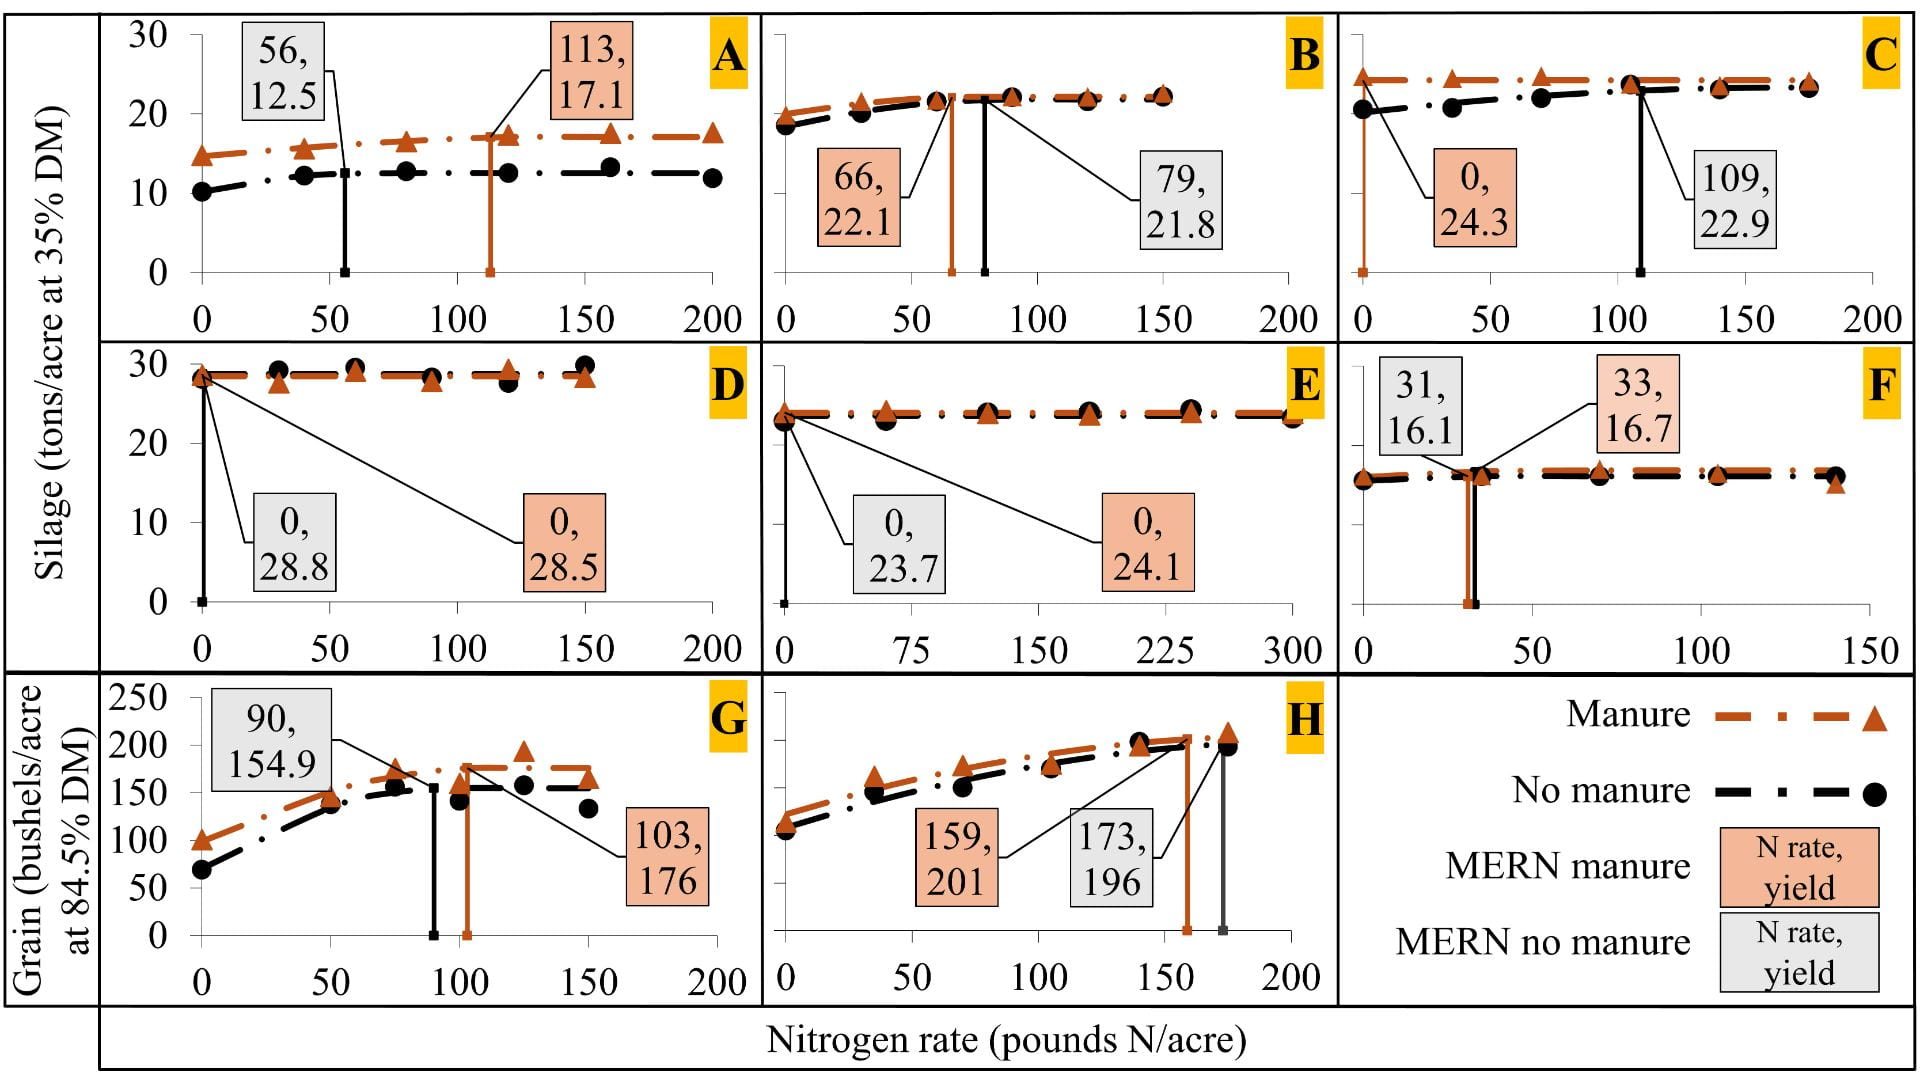
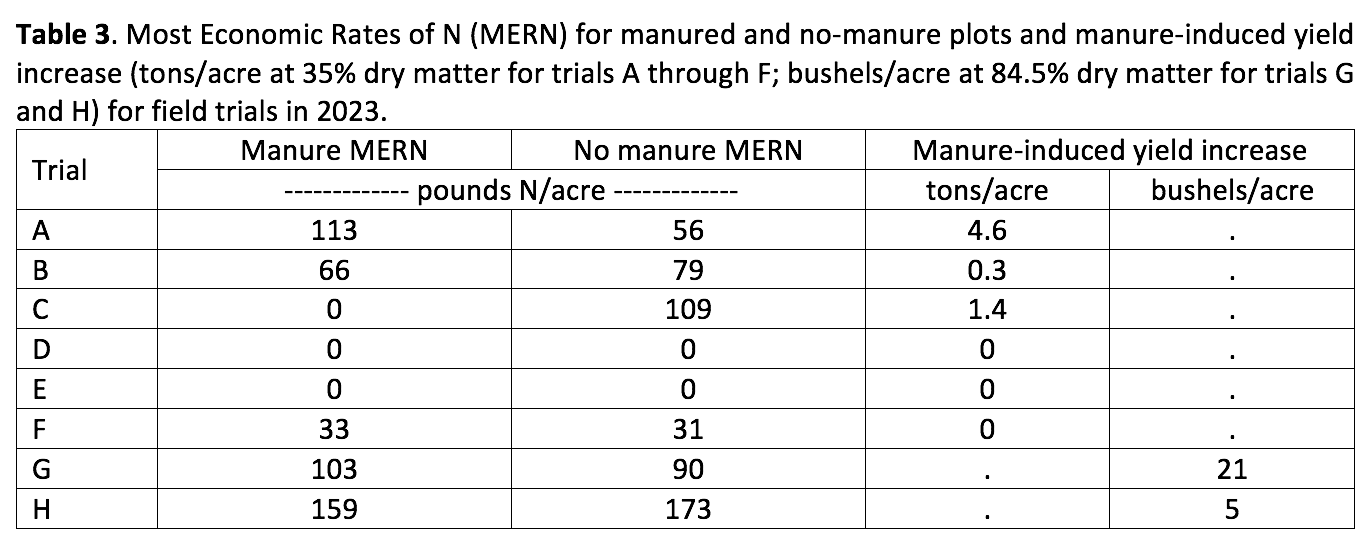
Similar to what we found in 2022, trials differed in their responses to manure and inorganic N (Figure 2). Trials D and E did not respond to manure or N sidedress application likely due to past N credits providing enough N to the crop. In trials A, B, C, G, and H, yield increased due to both manure and sidedress N application. Yields increased in manured plots beyond what could be obtained with fertilizer N by 0.3 to 4.6 tons/acre, and 5 to 21 bushels/acre (Table 3). In trials A and G, the ones with medium K and Zn classification, manure applications increased yield to such elevated levels (4.6 tons/acre for trial A and 21 bushels/acre for trial G), that it also increased the crop’s need for fertilizer N (in other words, the required sidedress N rate also increased). In both trials, manure application shifted soil K levels from medium to optimum and increased K content in silage, suggesting K was yield limiting at these locations.
Figure 2. Most Economic Rate of Nitrogen (MERN) in eight trials. Orange text boxes are the MERN and yield at MERN for manured plots; gray text boxes are MERN and yield at the MERN for no manure plots. Corn silage yields are in tons/acre at 35% dry matter (DM), and corn grain yields are in bushels/acre at 84.5% DM.
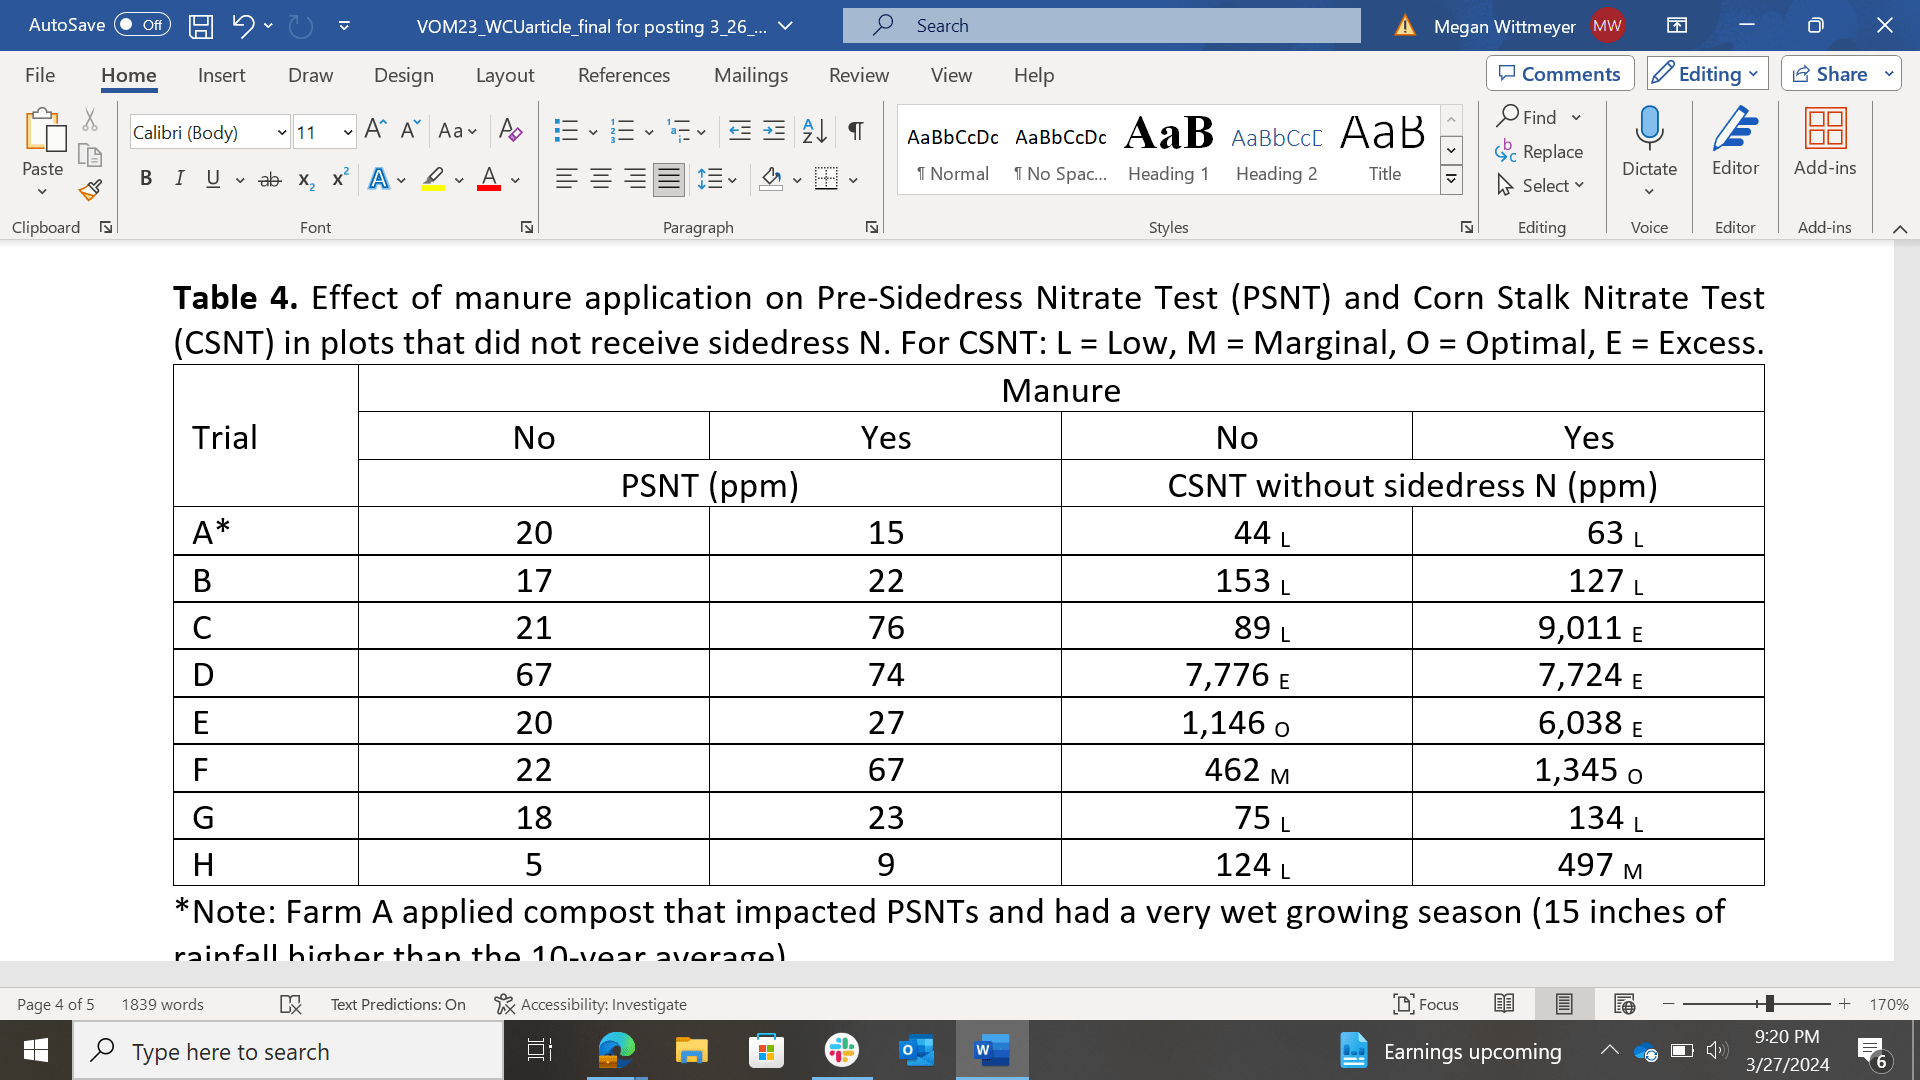
The PSNT levels of the manured plots were higher than their no-manure counterparts for all trials where liquid or digested manure was applied, showing that manure supplied crop available N to the soil (Table 4). In contrast, for farm A the PSNT-N was 15 ppm where compost had been applied versus 20 ppm without compost application, likely due to the high carbon content compared to N content of the compost used in that site. (Table 4). The impact of manure applications was also reflected in CSNT levels (Table 4). For trials D and E, CSNT levels of the plots that did not receive manure or sidedress fertilizer N were optimal or excessive, consistent with the lack of a yield response to N for those two sites. Similarly, for site F, the marginal classification suggested that limited (very little) to no N was needed, consistent with the lack of a manure-induced yield response and minimal fertilizer N response at that site. For the five trials where a crop response to N was determined (trials A, B, C, G, H), the CSNT’s of the zero N plots were low, accurately reflecting the need for additional N. For four trials, the CSNTs where manure but no N fertilizer was applied, were low (trials A, B, and G) or marginal (trial H), consistent with the response to sidedress N in the manured strips. For trials C, D, and E, the CSNTs were excessive in the manure strips without N fertilizer addition, consistent with the lack of a response to sidedress N (MERN = 0 pounds N/acre, Table 3). For trial F, the CSNT of the manured plots without sidedress N application was optimal. This trial showed a small response in yield to the addition of just over 30 pounds N/acre (Table 3).
*Note: Farm A applied compost that impacted PSNTs and had a very wet growing season (15 inches of rainfall higher than the 10-year average).
Conclusions and Implications (and Invitation)
In 2023 we documented “yield bumps” resulting from manure application beyond what could be obtained with fertilizer only in five of the eight trial, consistent with observations for two of the three trials in 2022. For the sites with optimal or high fertility status, this yield increase shows that manure is not just supplying nutrients, but also benefits yield beyond nutrient contributions. The PSNT and CSNT results consistently reflected where N was needed and allowed for documentation of the N contributions of the various manure sources. The Value of Manure Project will continue in 2024. We will be testing additional manure types and manure application methods in various soil types and weather conditions. Join us in the Value of Manure Project in 2024 and obtain valuable insights about the use of manure in your farm! If you are interested in joining the project, contact Juan Carlos Ramos at jr2343@cornell.edu.
We thank the farms participating in the project for their help in establishing and maintaining each trial location, and for providing valuable feedback on the findings. For questions about this project, contact Quirine M. Ketterings at 607-255-3061 or qmk2@cornell.edu, and/or visit the Cornell Nutrient Management Spear Program website at: http://nmsp.cals.cornell.edu/.
1CCE Central NY Dairy, Livestock, and Field Crops Team 2CCE Chenango County
Introduction
Potato leafhopper (PLH) is a major pest to alfalfa crops across the US and in Central New York. It causes damage to young plants and successive regrowth, resulting in a decrease in overall quality with the potential to cause financial losses to farmers. With funding from the Chobani Community Impact Fund and leadership from the Central New York Dairy, Livestock, and Field Crops (CCE CNYDLFC) regional team and Cornell Cooperative Extension of Chenango County (CCE Chenango), local Future Farmers of America (FFA) chapters worked together during the 2023 growing season to inform farmers about PLH population dynamics in their fields. The goal of this project was to monitor alfalfa fields for PLH, inform farmers if and when PLH populations had reached the action threshold (the population at which a farmer would want to take action to prevent economic loss) and gain a better understanding of the populations of potential insect predators of PLH through the growing season. In the process, community members of different ages and backgrounds had the opportunity to come together to gain hands-on experience with agriculture in the region, share skills and unique perspectives, connect with farmers, and participate in a local citizen science project.
Alfalfa is a good source of protein for livestock and a high-yielding crop for silage, hay, and pasture, and is an essential component of Total Mixed Rations on most dairy farms. Alfalfa is also useful in crop rotations because its root systems help improve soil structure and, as a legume, it is able to fix nitrogen from the atmosphere.
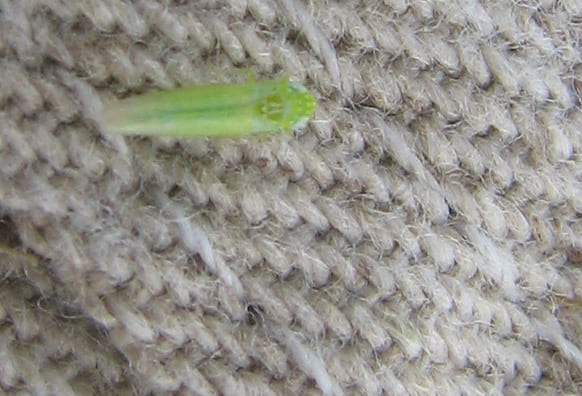
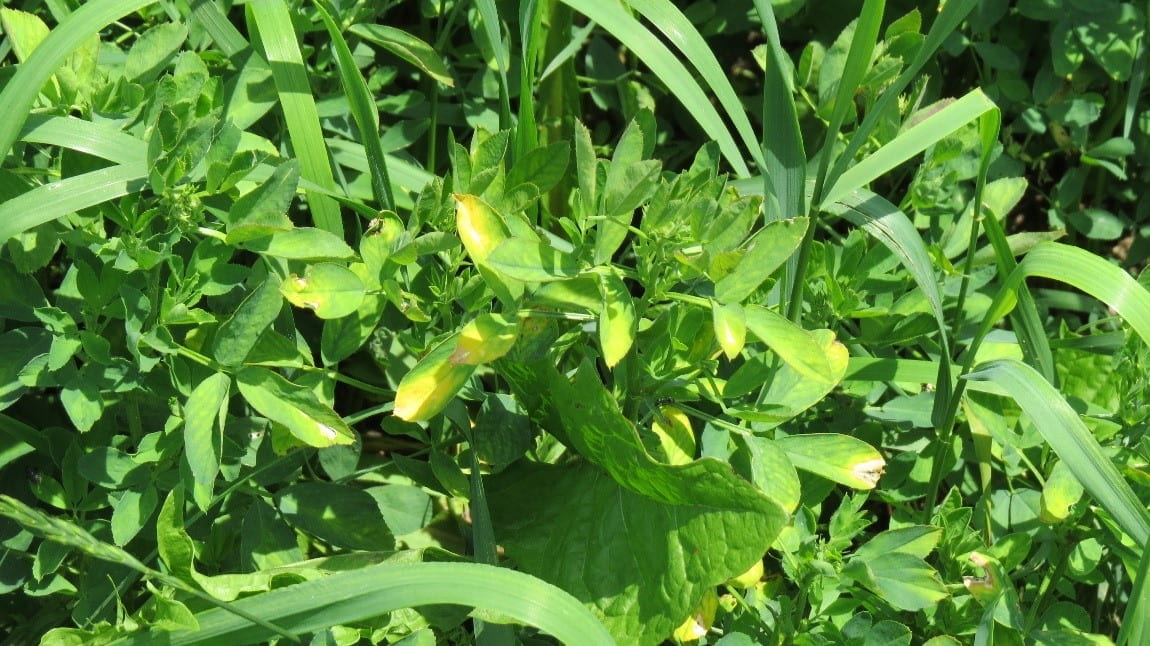
One of alfalfa’s most common pests in New York is potato leafhopper (Empoasca fabae) (PLH) (Fig. 1). Heavy PLH pressure can result in the reduction of stand quality and the loss of nutritional value, and it can impact the availability of successive cuttings. PLH is found across much of the eastern half of the United States and is a pest of many different crops, including clovers, potatoes, soybeans, and apples. At ¼ in, the small PLH can cause big problems. It feeds by using its straw-like mouthparts to extract sap from plants. While taking nutrients from the plant, the PLH also secretes a toxic saliva, which reduces the plant’s ability to photosynthesize. Leaves of infected plants will begin to yellow; this is known as “hopper burn” (Fig. 2).
Figure 1. A potato Leafhopper adult is about ¼ inches in length (Ken Wise)Figure 2. Hopper burn, PLH-damaged alfalfa (NYSIPM)
Potato leafhopper management
PLH pressure in alfalfa fields is commonly addressed in two ways: spraying the field with a pesticide to reduce PLH numbers or harvesting the field early. Costs and benefits exist between both options, but often the decision relies on the timing of the upcoming harvest.
Advising between when to cut and when to spray pesticides can help the farmer reduce the cost of pesticides, fuel, and labor used while also maintaining the value of the alfalfa stand.
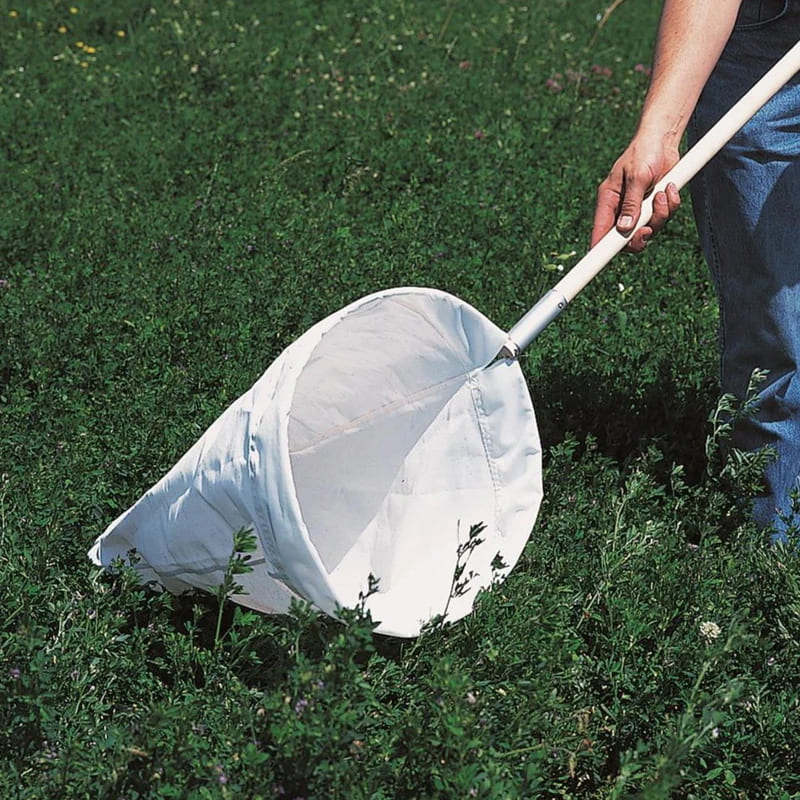
Farmers and pest scouts use large canvas sweep nets to sample PLH populations in alfalfa fields (Fig. 3). If the field has high PLH numbers, but the farmer is within one week of harvesting the field anyway, it would be more cost-effective to cut the field early. Cutting early allows the farmer to prevent further damage caused by PLH and maintain the quality of the alfalfa without unnecessarily expending time, fuel, and product by spraying with a pesticide. On the other hand, if the field is more than one week away from harvest and PLH numbers are high, it would make more economic sense to treat the field with an insecticide to provide the alfalfa more time to mature without PLH damage, since a low-yield harvest would have low economic value.
It is unclear whether PLH populations are predated upon by other insects or spiders to a degree that would affect alfalfa yield loss. Several species are reported to feed on PLH, but PLH are considered too fast to be captured by most predators. Still, insecticide applications intended to manage PLH would potentially affect other insects in the field, including those predating on pea aphid, another summertime insect pest of alfalfa that can cause yield loss in rare cases where populations get out of hand.
What is considered a high PLH number?
Table 1. Economic thresholds of PLH in non-PLH-resistant alfalfa (adapted from Cornell Guide for Integrated Field Crop Management)
Height of Alfalfa (in)
Max PLH/Sweep
<3
0.2
3-7
0.5
8-10
1
11-14
2
15+
2*
* No action needed if within 1 week of cutting, and consider cutting early.
For Example…
If the stand of alfalfa is 21 in. tall and the average number of PLH per sweep was 2.5, then the action threshold has been reached, and it would make sense to cut the stand early to prevent further damage because it is likely within one week of harvest.
However, if the alfalfa in the field is only 10 in. tall and an average of 1.5 PLH were found per sweep, the field should instead be managed with an insecticide application to prevent further PLH damage, since the next cutting will not happen within the next week.
If the alfalfa height is 20 in., but the average number of PLH per sweep was only 1.2, then the action threshold was not reached, and no action would be warranted for the field.
Methods
To help our extension staff collect data and provide management recommendations to local farmers, nine area youth groups including seven FFA chapters were provided with sweep nets, insect identification guides, and a comprehensive insect identification textbook, all of which they could keep at the end of the project. In-person training sessions and data sheets were also provided by CCE staff.
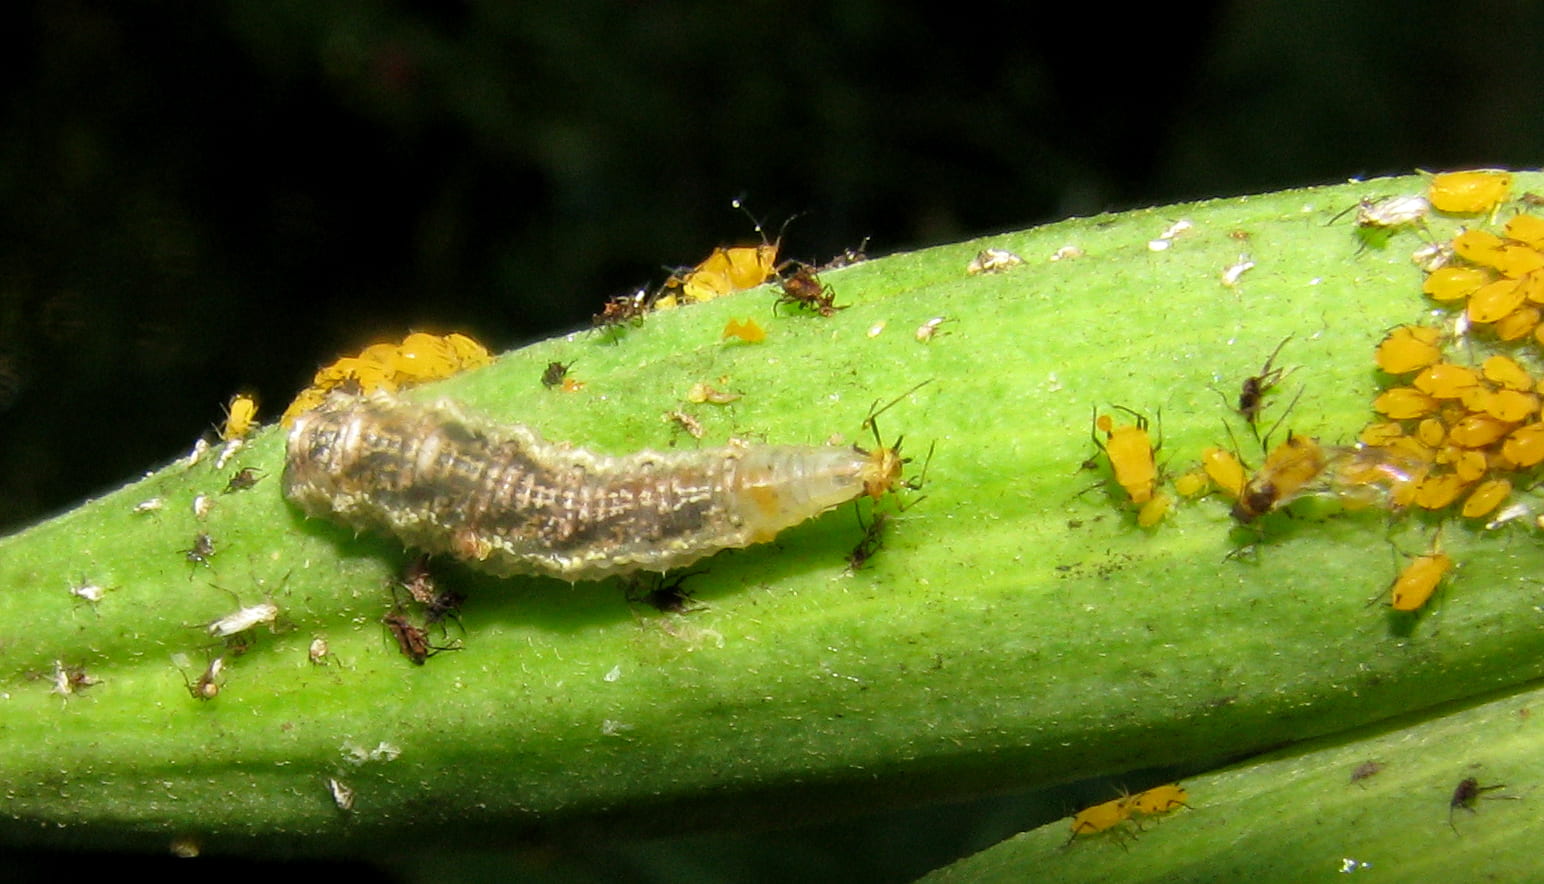
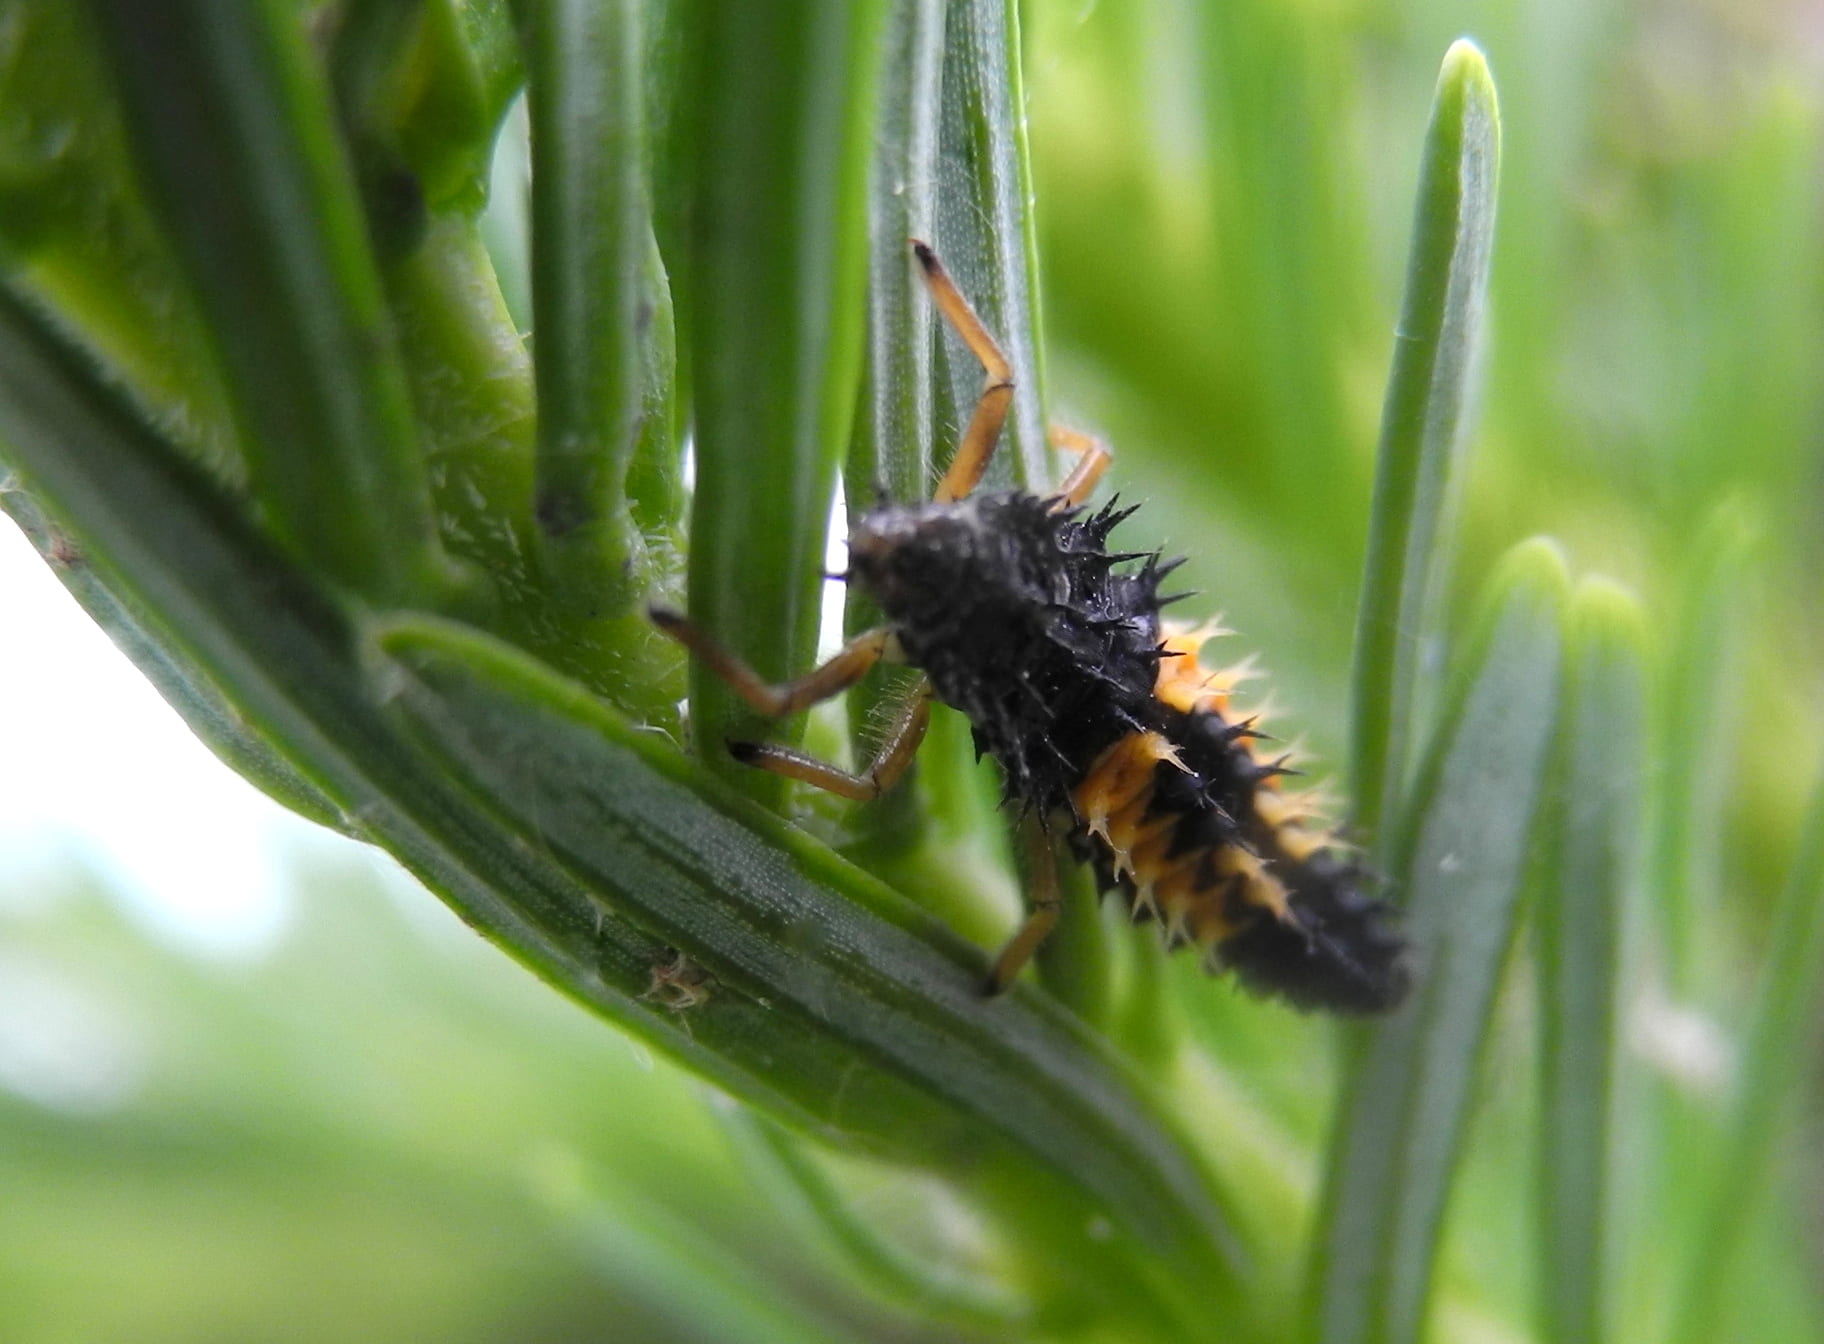
Data collection was performed with a standard 15-inch-diameter insect sweep net (Fig. 3). Participants swept the net a total of 10 times back and forth in a swinging motion while walking forward – each swing counting as one sweep – and at the end of the 10 sweeps, the number of insects in the net was recorded. In addition to PLH, participants also recorded seven types of predators that are known to feed on PLH and other insect pests. These included hoverfly larvae (Fig. 4), ladybugs and ladybug larvae (Fig. 5), lacewing larvae, damsel bugs, assassin bugs, minute pirate bugs, and spiders (including harvestmen, also known as daddy longlegs).
Figure 3. Sweep net (Gemplers)Figure 4. Hoverfly larva feeding on an aphid (Kerri Wixted)Figure 5. Ladybug larva (Cornell University)
This process was repeated for a total of three – five sets of sweeps, or 30-50 total sweeps per field. Fields were typically re-sampled weekly through the growing season, except immediately following harvest.
After counting the numbers of pests and predators and averaging those values across all sweeps, alfalfa height was recorded so that a determination could be made as to whether that field reached the threshold for management using the established economic thresholds (Table 1).
Results and Discussion
With four FFA chapters and one local youth group participating through the duration of the project, we were able to monitor PLH in 21 alfalfa fields on 13 farms in 5 counties over 12 weeks from June to August, when alfalfa crops are at highest risk of PLH and when producers are most likely to invest in insecticidal sprays to salvage yield.
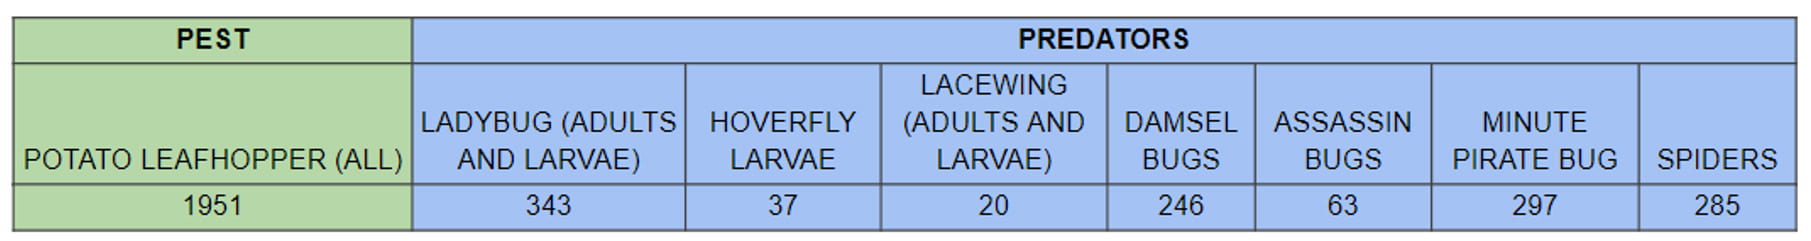
Across all fields and sampling dates, 1,951 PLH and 1,291 insect predators were recorded (Table 2). This does not include many other insects that were also observed in our sweep nets, like horse flies, deer flies, bees, aphids, and parasitoid wasps. The two most common insects sampled were aphids and several species of parasitoid wasps. Aphid populations seldom reach damaging levels in alfalfa, and these species of wasp parasitize other insects, primarily aphids in this setting.
Table 2. Total PLH and selected predators observed across all fields and dates
Out of 126 sampling efforts, the action threshold was reached only 10 times (7.9%). Of those 10 times, applying a short-residual insecticide was the most economical management strategy in five cases, while early harvest was recommended the other five times. This meant that it was only economical to spray in 3.97% of cases. Only eight fields of the 21 monitored during the growing season reached threshold at least once (38% of fields). Five of those eight were fields where early harvest was recommended due to being within one week of planned harvest. Interestingly, of the three fields where sprays were recommended due to reaching threshold more than a week from harvest, two were in this situation more than once during the season (twice each). This means that only very few fields experienced consistently high PLH pressure. These fields will be monitored in 2024 to see if these trends continue, or whether 2023 was unique. Without question, PLH populations can vary wildly between growing seasons due to their migratory nature, so more observation will be needed to see how different fields experience PLH pressure over time.
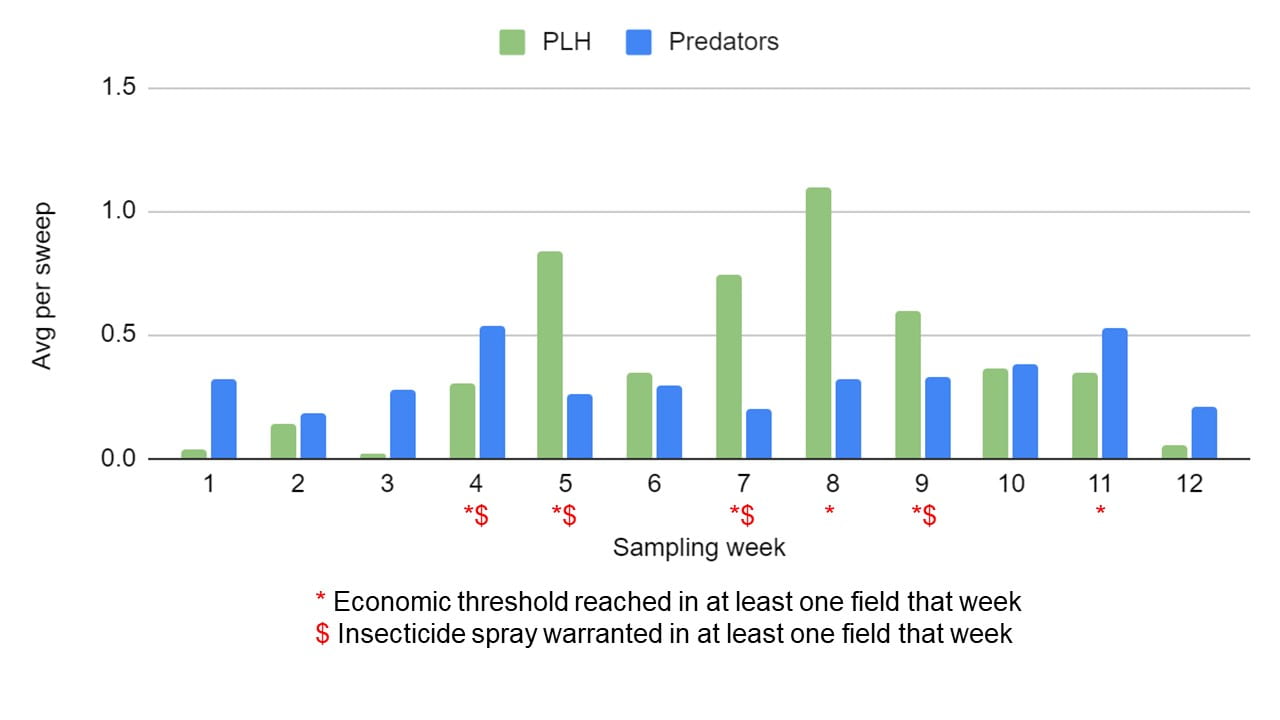
Predators outnumbered PLH in our sweeps until mid-July, and again after mid-August (Fig. 6). We know that the predators we recorded have been reported by others to feed on PLH, but we do not have a good understanding of how well they may be able to control PLH populations. But if they are, and if 2023 was a typical year for these species, there appears to be a period of about 5 weeks in the middle of summer that may be the highest risk for yield loss due to PLH infestation and potential yield loss. Alfalfa weevil is an important pest of alfalfa through late-June, and these predators may be exploiting this pest before PLH populations increase.
Figure 6. Insect population dynamics in Central NY alfalfa fields in 2023
Forage crops are unique because they are harvested multiple times per year, allowing for a partial reset of local pest populations with each harvest. But while the recommended short-residual sprays do not have extended activity directly, their effects can extend through the growing season if used incorrectly. Spraying without scouting to verify whether action thresholds have been reached, and spraying when pests are below economic thresholds not only wastes money in the short-term, but puts important insect diversity at risk. Not only non-target insects like pollinators, but also predators that may be feeding on PLH, alfalfa weevil, and aphids and preventing their populations from reducing forage yield and quality.
Potato leafhopper-resistant alfalfa varieties exist, and the economic thresholds of these varieties can be double, to nearly 10x the level of traditional alfalfa. If PLH-resistant varieties were used in this study, the economic threshold would have been reached no more than three times, all in different fields. For resistant varieties with economic thresholds higher than 3x the standard varieties, no fields in our study would have reached the economic threshold. However, farmers usually prioritize digestibility or other desired traits over pest resistance when choosing an alfalfa variety (these traits are not stackable with current varieties), so most alfalfa grown in NY is not PLH-resistant.
The partnership between CCE Chenango, the CNYDLFC regional team, and FFA chapters was instrumental to the project’s geographic reach and success. Through this partnership, young people in the community were able to aid farmers while learning about local agriculture, entomology, Integrated Pest Management, and the natural diversity that can be found on farms. While many of the young people involved with this project either lived on farms or were otherwise related to farmers, this was an enriching experience that gave them a better understanding of how crops are produced, and how farmers and CCE work together to make informed management decisions.
This project was made possible by Chobani through the Chobani Community Impact Fund and relied on leadership and participation from the Central New York Dairy, Livestock, and Field Crops team; Cornell Cooperative Extension of Chenango County; high school members of the local Future Farmers of America chapters; and each landowner that generously allowed sweeping to occur on their fields. The authors thank Joe Lawrence (PRO-DAIRY) and Ken Wise (NYSIPM) for reviewing the article. For questions, contact Erik Smith, erik.smith@cornell.edu.
Carly Bass1,7, Kirsten Workman2,3,7, Greg Albrecht4, Ron Bush4, Brendan Jordan4, Dale Gates5, Josh Hornesky5, Sara Latessa6, Kristan Reed7, Quirine M. Ketterings3,7
1Masters of Professional Studies in Animal Science, 2PRO-DAIRY, 3Nutrient Management Spear Program (NMSP), 4New York State Department of Agriculture and Markets (NYSAGM), 5United States Department of Agriculture Natural Resources Conservation Service (USDA-NRCS), 6New York State Department of Environmental Conservation (NYSDEC), and 7Department of Animal Science, Cornell University
Introduction
Farms that have more than 300 mature dairy cows (or an equivalent in other livestock animals) are required to operate under the New York State Pollutant Discharge Elimination System (SPDES) General Permit for Concentrated Animal Feeding Operations (CAFOs). The permit dictates that the farms follow environmental conservation practices and meet state standards designed to maintain the highest quality of water possible by mitigating the risk of pollution to New York waters. As only a small portion of our population is involved in agricultural production, it is not always understood what farms in New York State are required to do to stay in compliance. This article highlights and addresses some of the most common misconceptions surrounding New York CAFO farms and the CAFO permit.
Misconception 1:
“New York’s permit is less strict than the federal permit”
New York works closely with federal agencies such as NRCS and the EPA to ensure their standards and permit satisfy or exceeds the federal requirements. New York takes the minimum guidelines set forth in the federal Clean Water Act (CWA) CAFO Rule and makes additional requirements for farms to follow within their Comprehensive Nutrient Management Plan (CNMP) to meet water quality and sustainability goals of the state. The following are examples where the New York CAFO permit is more environmentally protective, and thereby restrictive, than the federal CAFO rule.
New York CAFOs must maintain no discharge from their production areas (farmsteads) through a 100-year, 24-hour storm compared to the federal no discharge standard which is for a 25-year, 24-hour storm.
New York CAFOs must utilize an AEM Certified Planner, whereas no professional certification is required by the CWA CAFO Rule.
New York CAFO permitted farms must follow an integrated system of NRCS Conservation Practice Standards for management of nutrients throughout their farmsteads and fields; such engineering and management standards are not required by the CWA CAFO Rule.
Farms must sample soil for nutrient values every three years versus every five years.
Farmer fields need to be planned and managed to conserve soil and reduce erosion, whereas this is not a CWA CAFO Rule.
New York CAFO’s must develop and maintain facility specific winter and wet weather application procedures and identify low-risk fields to be used for winter application in the case of an emergency.
New structural practices need to be designed considering future flood risk due to climate change.
Farm staff must be present and monitor active waste transfers from the production area (farmstead) while material is being transferred.
The NRCS-NY 590 Nutrient Management Standard and associated Land Grant University Guidelines require New York CAFOs to account for nitrogen already present on the farm (soil, manure, crop rotation credits, etc.) when developing spreading recommendations.
Misconception 2:
“Manure storages are not safe and impact drinking water”
Manure storages located and operated on New York CAFOs are required to be designed and constructed by a trained, State of New York licensed professional engineer to meet national standards (Natural Resources Conservation Practice Standard – NY 313). The NRCS-NY 313 Standard requires that manure storages are designed, built, and operated to fully contain manure nutrients and any direct precipitation for future application to crops as fertilizer while remaining isolated and protected from ground- and surface waters. These standards require geological investigations, prior to the design, to properly site these structures and ensure an appropriate liner is selected to minimize any risk of leaking. To date, there has been no evidence of a certified manure storage contributing to an impact to groundwater in New York. In addition to the groundwater protections outlined in the standards, there are measures to ensure and protect against these structures overtopping. The standards themselves require maximum fill markers to help ensure that safety volume requirements are maintained. The New York CAFO permit also requires the final as-built plans, certified by a professional engineer, be maintained on site; fill levels be monitored and recorded; and operation and maintenance measures outlined by the professional engineer be followed. Finally, no farm in New York is allowed to impact the water resources of the state, no matter the size of the farm. Any impact to Waters of the State is considered a significant violation of the Environmental Conservation Law and is subject to substantial penalties and/or fines.
Misconception 3:
“Farmers can spread manure under any weather conditions”
All CAFO farmers are required to have a current Comprehensive Nutrient Management Plan (CNMP) developed by an AEM Certified Planner in accordance with the permit, NRCS standards, and guidelines. The CNMP must be updated annually and prescribes how much manure and fertilizer can be spread on each field, as well as the anticipated application method and timing. In addition to their individualized plans, the New York CAFO permit sets maximum single-application spreading rates. New York’s CAFO permit also contains specific requirements pertaining to winter and wet weather spreading, including a prohibition against spreading if the field is saturated or frozen-saturated.
New York does not have a calendar-based ban on winter spreading because calendar-based regulations do not take current weather and specific field conditions into account. Drivers of nutrient losses are based on specific field, soil, and weather conditions/forecasts. New York’s CAFOs must assess field conditions every time they spread and follow the specific guidance outlined in the “Revised winter and wet weather manure spreading guidelines to reduce water contamination risk”.
Misconception 4:
“New York regulations allow phosphorus to be applied to fields even when the crop does not need it”
Manure contains all 17 essential nutrients for plant growth and is a key to building soil health by providing organic matter and enhancing the soil ecosystem. Properly managed, use of manure can offset the need for purchased fertilizer, reducing the amount of imported nutrients onto farms and into a watershed. However, nutrients in manure aren’t necessarily present in the balance required by a specific crop grown on a specific field. Within a farm’s CNMP, the New York P-Index governs how much phosphorus can be applied to fields each year to ensure proper recycling of on-farm nutrients through crops and long-term, sustainable soil test levels for the benefit of water quality. In accordance with the New York P-Index, a farmer and AEM Certified Planner must assess the risk of phosphorus leaving the field. This needs to be done for all fields on the farm. Those assessments will determine how and how much manure may be applied and must be documented in the farms’ CNMP. Farmers implement beneficial management practices to further reduce P runoff risk to lower the New York P-Index rating for fields. Making the most of manure nutrients is critical for water quality, air quality, and crop production, and to reduce N and P imports into watersheds. Most soils in New York are currently deficient in phosphorus so proper phosphorus management is needed to maintain productive and healthy soils for food production.
Misconception 5:
“Farmers pay AEM Certified Planners, therefore plans are biased”
New York has strict rules for who can develop and update CNMPs. A farm’s CNMP needs to be written by a state-certified planner who has gone through extensive training, is required to keep certifications current through training sessions, and has signed a code of ethics. Such a certification is akin to other state certified professionals used across sectors, such as professional engineers, architects, accountants, etc. To become an AEM planner, an individual must first become a Certified Crop Adviser (CCA), which involves passing two exams (an international and a regional exam) and meeting further educational and experience requirements to demonstrate their knowledge in agronomy and environmental conservation in agriculture. The next step is satisfying participation in the state led CNMP Training. After completing these two steps, the individual’s first three CNMPs must be submitted to CNMP specialists at the New York State Department of Agriculture and Markets (NYSAGM) for review, revision, and acceptance. Once the three plans satisfy the CNMP requirements, the individual becomes an AEM Certified Planner. Certified planners must sustain their CCA status, maintain compliant work through ongoing quality assessments by NYSAGM staff, and satisfy 40 credit hours of continuing education every two years to maintain their certification. In addition to this rigorous certification and assessment process, the NYSDEC reviews CNMPs during regular CAFO inspections and pursues enforcement if deficiencies are identified.
Misconception 6:
“Only large dairy farms are regulated”
New York State laws and regulations require all animal feeding operations (AFOs) that meet certain animal thresholds, to obtain coverage under a State Pollutant Discharge Elimination System (SPDES) permit prior to operation. However, per Environmental Conservation Law Article 17, Title 5, Section 17-0501, no farm, regardless of size or permit coverage, is allowed to contribute to a water quality violation and impact New York’s water resources. New York also funds several programs that are available to all farms, including smaller AFOs. The AEM program, Dairy Advancement Program (DAP), and NRCS’s program help farms with conservation plan development (including CNMPs) and implementation of best management practices. To date, 13,500 practices on over 2,500 farms have been implemented through the AEM programs, the DAP has helped more than 300 non-CAFO farms develop CNMPs, and those NYS program accomplishments can be doubled when considering projects completed through USDA NRCS and the Farm Service Agency. These programs augment the substantial investment by farmers and ensure that farms of all types and scales have the resources to implement nutrient management practices on their farms to aid with environmental management. Roughly 1,000,000 acres of cropland are impacted annually in New York by nutrient management guidelines due to the various programs in place.
Additional Resources
Bass, C., K. Workman, G. Albrecht, R. Bush, B. Jordan, D. Gates, J. Hornesky, S. Latessa, K. Reed, and Q.M. Ketterings (2023). Concentrated Animal Feeding Operation Regulations and Comprehensive Nutrient Management Planning in New York State. Cornell University, Ithaca NY. http://nmsp.cals.cornell.edu/publications/extension/CAFOCNMPNY2023.pdf.
The information shared in this article comes from a larger extension document that outlines regulations and comprehensive nutrient management planning in New York State (see additional resources above). We thank the members of the Nutrient Management Spear Program advisory committees for their feedback on the larger document. For questions, contact Quirine M. Ketterings (qmk2@cornell.edu) or Kirsten Workman (kw566@cornell.edu).
Vipan Kumar1, Lynn Sosnoskie2, Mike Hunter3, Mike Stanyard4
1School of Integrative Plant Sciences -Soil and Crop Sciences Section, Cornell University, Ithaca, NY 14853, 2School of Integrative Plant Sciences – Horticulture Section, Cornell AgriTech, Geneva, NY 14456, 3Cornell Cooperative Extension North County Regional Ag Team, 4Cornell Cooperative Extension Northwest New York Dairy, Livestock, and Field Crops Program
With recent rainfall events and a new flush of summer annual weeds, NY producers are busy applying postemergence herbicide applications in row crops. If you have planted dicamba-tolerant soybeans and are planning for postemergence applications of dicamba-containing products (Xtendimax, Engenia, or Tavium), the following points need to be considered.
Xtendimax, Engenia and Tavium are the only dicamba-containing products that are labelled in dicamba-tolerant soybeans (Roundup Ready 2 Xtend or XtendFlex soybeans).
Be sure of your trait technology! Do not confuse Xtend traits with Enlist traits. Enlist traits provide crop resistance to 2,4-D but not to dicamba.
As per the revised labels in 2021, the legal last day of postemergence applications of Xtendimax, Engenia and Tavium in dicamba-tolerant soybeans is June 30.
Only certified applicators with dicamba training are allowed to apply these products.
Spray records need to be created within 3 days of applications of these products and should be maintained for 2 years. (Note: In New York State all applications of restricted use pesticides must be maintained for at least three years)
An approved drift reduction agent (DRA) and volatility reduction agent (VRA) should be included.
Only approved nozzles and tank-mix partners should be used for these products.
Wind speed at boom height should range from 3 to 10 miles per hour at the time of application.
As per the labels, maximum ground speed of sprayer should not exceed 15 miles per hour and maximum boom height above target pest or crop canopy should not exceed 24 inches.
Survey surrounding fields ahead of dicamba applications for sensitive crops (e.g., grapes, fruit trees, snap beans, fruiting vegetables (e.g., tomatoes, peppers), soybeans without dicamba-tolerance trait technology, etc…).
DO NOT apply these products if sensitive crops are in a downwind field or a run-off producing rain event is in the forecast in the next 48 hours.
After determining no adjacent sensitive crops are downwind, maintain a 240-feet downwind buffer.
Stop spraying if winds change direction towards sensitive crops.
DO NOT apply dicamba products during temperature inversions. Only spray between one hour after sunrise and two hours before sunset.
Ensure the entire sprayer system is properly cleaned before and after dicamba applications are made.
Applicator should consult Bulletins Live Two website to make sure no endangered species will be affected by these dicamba applications.
Disclaimer: Brand names appearing in this publication are for product identification purposes only. Persons using such products assume responsibility for their use in accordance with current label directions of the manufacturer.
1Nutrient Management Spear Program, 2PRODAIRY, Cornell University, Ithaca, NY 14853, 3Cornell Cooperative Extension North Country Regional Ag Team, 4USDA-Natural Resources Conservation Service, NY
Introduction
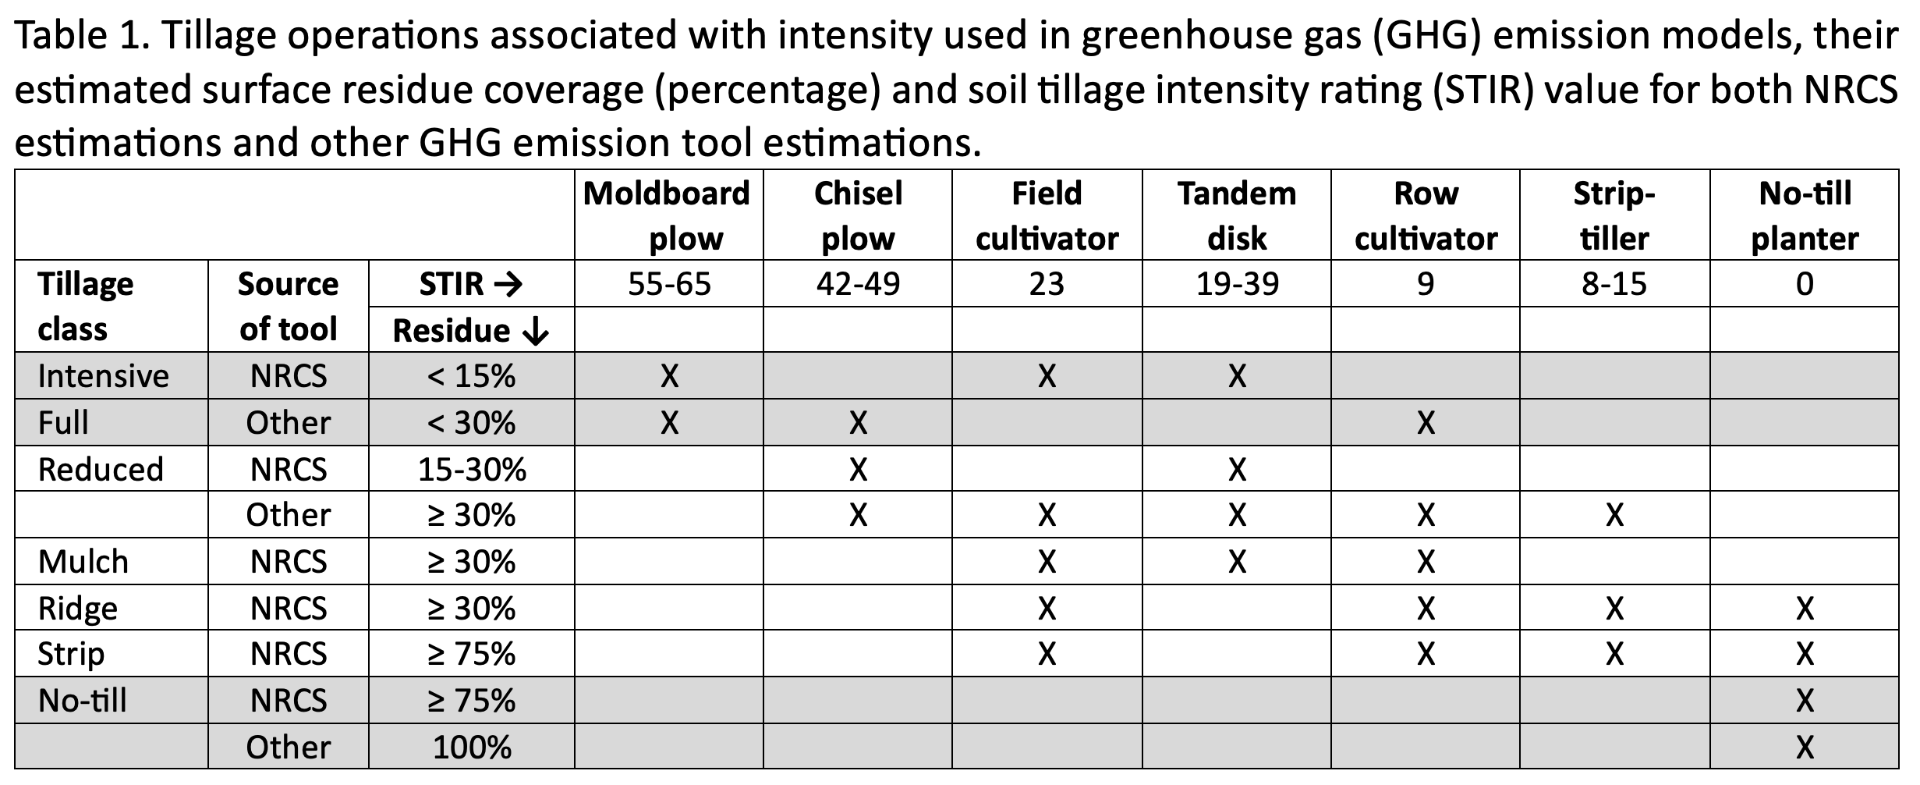
Tillage practices can impact soil greenhouse gas (GHG) emissions, soil carbon (C) sequestration and overall soil health. Tools are available to estimate whole farm GHG inventories (N2O, CO2, and CH4 emissions), field-based emissions, and C sequestration or loss. These tools often require a user to classify tillage intensity. The Natural Resources Conservation Service (NRCS) GHG accounting system uses the Revised Universal Soil Loss Equation (RUSLE2) to calculate a Soil Tillage Intensity Rating (STIR) that can be used to classify the intensity of various tillage practices. This tool also classifies tillage intensity based on percent residue surface cover and soil disturbed. This article explains what a STIR factor is, describes how to determine percent surface residue cover, and categorize different tillage practices into tillage intensity classifications.
Soil Tillage Intensity Rating (STIR)
The STIR value of a field can range from 0-200 with high values for intense tillage (Table 1). The STIR is based on four components: tillage type, depth of operation, operational speed, and percent of soil surface area disturbed.
Tillage type: This describes how a tillage pass mixes soil and crop residue. Tillage disturbance operations can include inversion and some mixing of soil, mixing and some (limited) inversion, lifting and fracturing, mixing only, and soil compression.
Depth of operation: The depth to which soil disturbance and residue incorporation occur.
Operational speed of tillage: This is the recommended operating speed of each tillage operation. The forward speed of a tillage implement impacts soil disturbance and mixing; faster speeds result in more significant forces and broader disturbance.
Percent of soil surface area disturbed: The percentage of surface soil disturbed by the tillage pass.
Estimating Percent Residue Cover
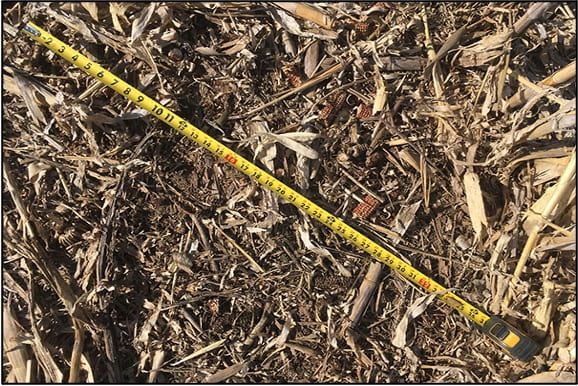
Percent residue cover remaining on the surface following a tillage operation can be determined using the RUSLE2 equation or measured in the field using the line transect method. The line transect uses a line measuring tool (a rope or tape measure) that has 100 equally distributed and easily viewed marks (Figure 1). Typically, the measuring tool is 100 feet long with markings at 1-foot intervals or 50 feet long with marking at 6-inch intervals. To determine the percent residue surface cover of a field, stretch the tool diagonally across crop rows in a direction that is at least 45 degrees off the row direction and count the number of markings that have crop residue directly present beneath. Residue smaller than 1/8 inch in diameter should not be counted. The total count (markings with residue beneath them) is the percent residue cover for the field. This process should be repeated at least three times in different areas of the field and percentages should be averaged.
Fig. 1: A simple measuring tape can be used to easily determine percent residue surface cover of a field (Picture credit: https://www.sdsoilhealthcoalition.org/ soil-health-assessment-card/).
NRCS Tillage Intensity Classes
The NRCS tool groups tillage practices into six categories; intensive, reduced, mulch, ridge, strip, and no-till:
Intensive tillage is full width tillage that inverts soil with high disturbance. Common equipment includes a moldboard plow.
Reduced tillage occurs at full width without soil inversion, using a point chisel plow, field cultivator and/or tandem disk.
Mulch tillage a single pass across the field using tools such as a tandem disk followed by field or row cultivator or similar implement.
Ridge tillage creates soil ridges in the field that are rebuilt during cultivation by disturbing up to 1/3 of the row width. The soil is then undisturbed from harvest to planting.
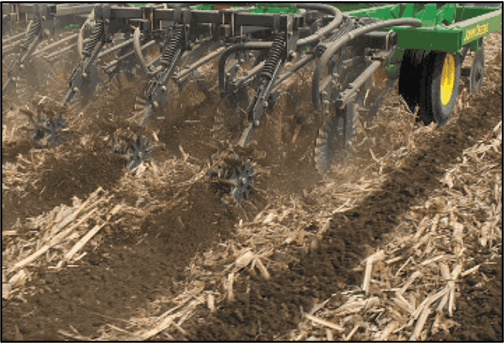
Strip tillage leaves the soil between crop rows undisturbed (Figure 2). To create a seedbed, up to 1/3 of the row width is disturbed.
No-till operations plant crop seeds directly through residue of the previous crop using a no-till planter or drill.
Figure 2: Strip tillage leaves the soil between crop rows undisturbed.
Full vs. Reduced vs. No-Till
Some GHG footprint assessment tools categorize tillage practices differently, using three main categories; full, reduced, and no-till:
Full tillage contributes to significant soil disturbance, fully inverting the soil (as is done with moldboard plowing) and/or performing tillage operations frequently in the same year using tools like chisel plows or row cultivators.
Reduced tillage also disturbs the soil but does not fully invert the soil. Examples include onetime use of chisel plows, field cultivators, tandem disks, row cultivators, or strip-tillers.
No-till practices directly drill crop seed through the residue layer with little to no disturbance to the soil. Minimal disturbance occurs in the area where seeds are planted. Common operations use a no-till planter.
In Summary
Tools available to assess whole-farm and field-based GHG inventories and C sequestration or loss require the user to classify tillage intensity. Choosing the tillage description that best fits the producers’ management practices is essential for accurately assessing GHG emissions.

 On February 06, 2024, the U.S. district court in Arizona vacated 2020 registrations of three dicamba containing products (XtendiMax, Engenia and Tavium) for over-the-top (OTT) applications in dicamba-tolerant (Xtend and XtendFlex) soybean. In response to the U.S. district court ruling, the EPA issued an Existing Stock Order on February 14, 2024, that allows limited sale, distribution, and use of these dicamba OTT products that were already in the possession of growers, distributors or in the channels of trade and outside the control of pesticide companies as of February 06, 2024.