Creating a New York Soybean Yield Database

Julianna Lee1, Manuel Marcaida III1, Jodi Letham2, and Quirine Ketterings1
1Cornell University Nutrient Management Spear Program and 2Cornell Cooperative Extension Northwest New York Dairy, Livestock and Field Crops

Soybeans acres and yield

Soybeans are an important crop for New York with a total land base of 325,000 acres harvested in 2022. Average yields are reported each year by the United States Department of Agriculture, National Agricultural Statistics Service (USDA-NASS) in New York’s Agricultural Overview. Their records these past 14 years show a range in yield from a low of 41 bu/acre in 2016 to a high of 53 bu/acre in 2021, averaging 46.5 bu/acres at 87% dry matter. While state averages are reported yearly, there is little documentation of yield per soil type. In the past three years, we have worked with soybean growers to collect soybean yield monitor data and determine the first soil type specific yield records. This project was started because knowing soil- and field-specific yield potentials for soybean can help farmers make better informed crop management and resource allocation decisions, including fertilizer and manure use decisions.

What’s Included in the Soybean Database so Far?

Whole-farm soybean yield monitor data, shared by farmers in central and western New York, were cleaned using Yield Editor prior to overlaying of soil types as classified by the Web Soil Survey. To generate soil type-specific yield distributions, analyses were limited to soil types with yield data for at least: (1) 3 acres of total area within an individual field; (2) 150 acres total across all fields and farms; and (3) in three different farms. These qualifiers resulted in a database (to date) of 9,653 acres of yield data collected across 13 farms in New York with information for 14 soil types. Of the total acres, about 90% was from 2017-2021 (with data going back to 2009). Density plots were generated to determine yield distributions per soil type. Varietal differences were not considered in the analysis.

What Did we Find?

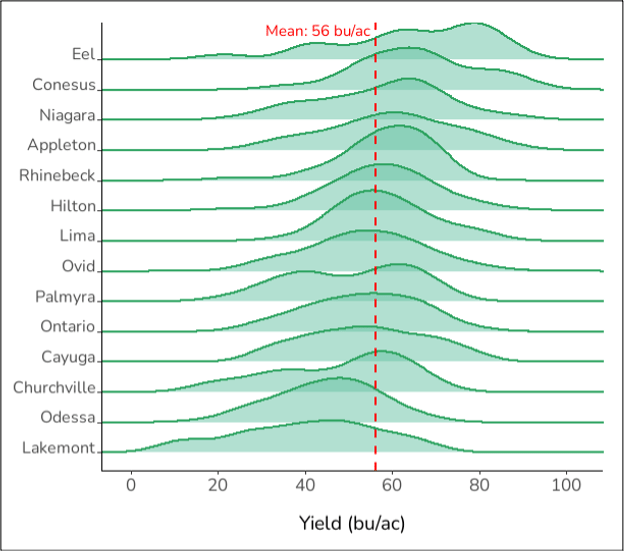
The calculated area weighted average yield for New York was 56 bu/acre with a standard deviation of 14 bu/acre. This average is considerably higher than the 46.5 bu/acre reported in New York’s Agricultural Overview for the same time period. Soil type specific means ranged from 40 bu/acre (Lakemont) to 66 bu/acre (Conesus) but yield distributions showed large ranges (from low to high) for all 14 soil types (Figure 1). For some soil types, the density plots showed multiple peaks which may reflect farm-to-farm, field-to-field, variety, management, as well as weather differences. Except for 2014, the mean yield based on farmer data exceeded state averages reported in New York’s Agricultural Overview.

What’s Next?

Knowing soil- and field-specific yield potentials for soybean can help a farmer make crop management and resource allocation decisions, including use and rate of fertilizer and manure. With more farmers sharing their soybean yield data, this summary will become more representative for the state and additional soil types for which too few acres of yield data are available currently, may be included in future years. We invite New York soybean growers to share they yield data with us to build on this data summary. Farmers who share data obtain their farm-specific yield report. This includes an annual update that summarized their cleaned yield data, a multiyear report once three years are collected, and yield stability-based zone maps for all fields with at least three years of soybean yield data.

Graph of soybean yield density plots by soil type.
Figure 1. Soybean yield density plots based on the different soil types from the cleaned soybean yield monitor database from 2009 to 2021.

Acknowledgments

We thank the farmers who shared their yield monitor data with us. This project is sponsored by the New York Corn and Soybean Association and USDA-NIFA Federal Formula Funds. We thank Abraham Hauser and Anika Kolanu for help with cleaning and processing yield monitor data. For questions about this project, contact Quirine M. Ketterings at 607-255-3061 or qmk2@cornell.edu, and/or visit the Cornell Nutrient Management Spear Program website at: http://nmsp.cals.cornell.edu/.

Print Friendly, PDF & Email

Manure Can Offset Nitrogen Fertilizer Needs and Increase Corn Silage Yield Value of Manure Project 2022 Update

Juan Carlos Ramos Tanchez1, Kirsten Workman1,2, Allen Wilder3, Janice Degni4, and Quirine Ketterings1
Cornell University Nutrient Management Spear Program1, PRO-DAIRY2, Miner Agricultural Research Institute3, and Cornell Cooperative Extension4

Introduction

Manure is a tremendously valuable nutrient source. When used appropriately (right rate, right timing, right placement method), it can help build soil organic matter, enhance nutrient cycling, and improve soil health and climate resilience. Sound use of manure nutrients can decrease the need for synthetic fertilizer, thus, lowering whole farm nutrient mass balances and contributing to reduced environmental footprints.

Current guidance for nitrogen (N) credits from manure recognize that N availability depends on the solids content of the manure (lower first year credits for manure with >18% solids than for liquid manure). It also recognizes that the amount of N in manure is affected by how it is collected, stored, treated (solid liquid separated, composted, digested, etc.), and land-applied (timing and method). Higher shares of manure N will be available to crops when manure is applied closer to when crops need it and if manure is injected or incorporated into the soil right after it is applied versus left on the surface.

In the past two decades since manure crediting systems were developed, many different manure treatments technologies have been implemented on farms and re-evaluation of the N crediting system for manure is needed. Furthermore, recent studies have shown that manure can increase yield beyond what could be obtained with N fertilizer only. Thanks to funding from New York Farm Viability Institute (NYFVI) and the Northern New York Agricultural Development Program (NNYADP), we initiated the “Value of Manure” statewide project to evaluate the N and yield benefits of various manure sources and application methods. Three trials were conducted in 2022. Here we summarize the initial findings.

What we did in 2022

Trials were implemented on three farms. Each trial had three strips that received manure and three that did not, for a total of six strips (Figure 1a). Strips were 1200-1800 ft long and 50-80 ft wide. When corn was at the V4-V6 stage, each strip was divided into six sub strips (Figure 1b) and sidedressed at a rate ranging from 0 to up to 192 pounds N/acre, depending on the farm. All three farms applied liquid untreated manure, ranging from 7,525 to 15,000 gallons/acre in the spring.

color coded images showing how plots were laid out in research trial
Figure 1. Layout of a Value of Manure study plot. Three strips received manure before planting (1a). At the V4-V6 corn stage each of the six strips received six different inorganic N sidedress rates (1b).

Soils on farm A were Lima and Honeoye (Soil Management Group [SMG] 2), farm B had a Hogansburg soil (SMG 4), and farm C had Valois and Howard soils (SMG 3). The farms implemented and harvested the trial. The Cornell team sampled for general soil fertility, Pre-Sidedress Nitrate Test (PSNT), Corn Stalk Nitrate Test (CSNT), and silage quality. Each trial was harvested with a yield monitor.

What we have found so far

Corn silage had a different response to manure and inorganic N sidedress in each of the study farms (Figure 2). Farm A responded to both the application of manure and inorganic N fertilizer. In that farm manure application was able to offset 58 lbs N/acre and presented a 0.6 ton/acre yield advantage at the Most Economic Rate of N (MERN), the rate of N that maximizes economic returns, compared to plots with inorganic N fertilizer application only (Figure 3). The application of inorganic N fertilizer and manure had no impact on the yield of farm B, showing that the field already had enough N and did not need any N addition (fertilizer or manure). At farm C, yield did not respond to the application of inorganic N sidedress (the field by itself provided enough N to the crop), but yield was higher when manure was applied: on average manured plots yielded 1.5 ton/acre higher than the no-manure plots. The MERN for farms B and C was 0 lbs N/acre both with manure and without it.

The PSNT and CSNT levels of the manured plots were higher than their no-manure counterparts for all three studies, showing that manure supplied N (Table 1). Both manure and no manure plots in farm A had optimum CSNT levels at the MERN, showing that manure was able to offset 58 lbs N/acre.

Figure 2. Effect of manure application and different nitrogen sidedress rates on corn silage yields in three New York farms. Error bars are standard deviations.
Figure 3. Most economic rate of N (MERN) in farm A. Without manure, the MERN was 114 lbs N/acre with a yield at the MERN of 28.5 tons/acre. With manure, the MERN was 56 lbs N/acre, with a yield at the MERN of 29.1 tons/acre.

Conclusions and Implications (and Invitation)

The trials of 2022 show the range of possible responses, with one trial not showing a yield or N benefit of the manure, one trial showing a yield increase when manure was applied that was not due to N addition, and one showing both a yield and N fertilizer benefit from manure. This shows the importance of targeting manure application to fields with low past N credits, where it will be most likely to cause a yield respond. Additional trials are needed with various manure sources (raw manure, separated liquids, solids, digestate, etc.) before we can draw conclusions about the N and yield benefits of manure. Join us for the 2023 Value of Manure project and obtain valuable insights about the use of manure in your farm! If you are interested in joining the project, contact Juan Carlos Ramos Tanchez at jr2343@cornell.edu.

Additional Resources

The NMSP Value of Manure Project website and on-farm field trial protocols are accessible at: http://nmsp.cals.cornell.edu/NYOnFarmResearchPartnership/Value_of_Manure.html  (website) and  http://nmsp.cals.cornell.edu/NYOnFarmResearchPartnership/Protocols/NMSP_Value_of_Manure_Protocol2023.pdf (protocol).

Acknowledgments

We thank the farms participating in the project for their help in establishing and maintaining each trial location, and for providing valuable feedback on the findings. For questions about this project, contact Quirine M. Ketterings at 607-255-3061 or qmk2@cornell.edu, and/or visit the Cornell Nutrient Management Spear Program website at: http://nmsp.cals.cornell.edu/.

Print Friendly, PDF & Email

Stalk Nitrate Test Results for New York Corn Fields from 2010 through 2022

Quirine Ketterings1, Sanjay Gami1, Juan Carlos Ramos Tanchez1, and Mike Reuter2
Cornell University Nutrient Management Spear Program1 and Dairy One2

Introduction

The corn stalk nitrate test (CSNT) is an end-of-season evaluation tool for N management for corn fields in the 2nd year or more that allows for identification of situations where more N was available during the growing season than the crop needed. Research shows that the crop had more N than needed when CSNT results exceed 2000 pm. Results can vary from year to year but where CSNT values exceed 3000 ppm for two or more years, it is highly likely that N management changes can be made without impacting yield.

Findings 2010-2022

In 2022, 43% of all tested fields had CSNT-N greater than 2000 ppm, while 35% were over 3000 ppm and 21% exceeded 5000 ppm (Table 1). In contrast, 29% of the 2022 samples were low in CSNT-N. The percentage of samples testing excessive in CSNT-N was most correlated with the precipitation in May-June with droughts in those months translating to a greater percentage of fields testing excessive. Because crop and manure management history, soil type and growing conditions all impact CSNT results, conclusions about future N management should take into account the events of the growing season. This includes weed and disease pressure, lack of moisture in the root zone in drought years, lack of oxygen in the root zone due to excessive rain in wet years, and any other stress factor that can impact crop growth and N status.

Note: Data prior to 2013 reflect corn stalk nitrate test submissions to NMSP only; 2013, 2014, and 2017-2022 data include results from NMSP and Dairy One; 2015-2016 includes samples from NMSP, Dairy One, and CNAL. Yield data are from the USDA – National Agricultural Statistics Service. Rainfall data obtained from CLIMOD 2 (Northeast Regional Climate Center).

Within-field spatial variability can be considerable in New York, requiring (1) high density sampling (equivalent of 1 stalk per acre at a minimum) for accurate assessment of whole fields, or (2) targeted sampling based on yield zones, elevations, or soil management units. The 2018 expansion of adaptive management options for nutrient management now includes targeted CSNT sampling because of findings that targeted sampling generates more meaningful information while reducing the time and labor investment into sampling. Two years of CSNT data are recommended before making any management changes unless CSNT’s exceed 5000 ppm, in which case one year of data is sufficient.

Figure 1: In drought years more samples test excessive in CSNT-N while fewer test low or marginal. The last 11 years include six drought years (2012, 2016, 2018, and 2020 through 2022), three wet years (2011, 2013, and 2017), and four years labelled normal (2010, 2014, 2015, 2019) determined by May-June rainfall (less than 7.5 inches in drought years, 10 or more inches in wet years).

Relevant References

Acknowledgments

We thank the many farmers and farm consultants that sampled their fields for CSNT. For questions about these results contact Quirine M. Ketterings at 607-255-3061 or qmk2@cornell.edu, and/or visit the Cornell Nutrient Management Spear Program website at: http://nmsp.cals.cornell.edu/.

Print Friendly, PDF & Email

Soybean cyst nematode in soybeans and dry beans: new research and renewed sampling efforts in 2022

E. Smith1, M. Zuefle2, X. Wang3, K. Wise2, J. Degni1, A. Gabriel1, M. Hunter1, J. Miller1, K. O’Neil1, M. Stanyard1, G. Bergstrom4

1Cornell Cooperative Extension, 2New York State Integrated Pest Management, 3United States Department of Agriculture – Agricultural Research Service, 4Cornell University

Soybean cyst nematode (SCN) is a plant parasitic roundworm and is the most damaging pest of soybean crops worldwide. Yield losses can reach 30% before above-ground symptoms manifest, leaving growers unaware that they have an infestation until it’s too late. With soybean prices the highest they’ve been in a decade, this translates to a loss of more than $13,000 per fifty acres in a field that would otherwise produce a yield of 55 bu/acre. We are only now beginning to understand the spread and damaging effect of SCN on dry bean crops, for which financial losses would almost certainly be greater due to their higher value.

In addition to legume crops, SCN can infest and reproduce on several weed species such as chickweed, purslane, clover, pokeweed, and common mullein. Overwintering SCN eggs hatch in spring when soil temperatures reach approximately 50°F (10°C). Females colonize roots to feed, eventually allowing the lower half of their bodies to protrude through the root wall and become visible as small white cysts (Figure 1). Eventually, the female dies and the cyst dries, hardens, and darkens in color, concealing up to 400 eggs. While we can expect at least three generations of SCN each growing season, these cysts can survive for years in the soil until the right conditions allow them to hatch. Because of their hardiness, longevity, and their relatively broad host range, once a field has been infested with SCN is it considered impossible to eradicate. SCN cysts can spread via wind, soil, water, tires and farm equipment, contaminated seeds or plants, and through birds or other animals.

soybean roots with nematode cysts
Figure 1. Soybean cyst nematode cysts on soybean roots. Photo: Craig Grau, University of Wisconsin

This is an extremely hardy and pernicious pest, but populations can be managed using an integrated approach including scouting, soil sampling, host resistance, and crop rotation. The first step is of course scouting and identification using soil sampling.

If SCN infestation is not known in a field, the roots of symptomatic plants (stunting or premature yellowing compared with the surrounding crop) may be inspected for cysts (Figure 1). Otherwise, soil samples should be collected near harvest or just after. Samples should be taken from the root zone in field entrances and sections of the field that showed stunting or premature yellowing/death compared with the surrounding crop (Figure 2). If a field is known to have an SCN infestation, soil samples should be taken across the field in a zig-zag or grid pattern because SCN infestations are unevenly distributed.

soybeans dried by SCN with healthy surrounding crop
Figure 2. Soybeans infested with SCN drying down prematurely compared with the surrounding crop. Photo: Erik Smith, Cornell Cooperative Extension

From 2017 to 2020, 134 soybean and dry bean fields in 42 counties were sampled for SCN, yielding positive samples in 30 counties (SCN+). In 2021, further testing revealed 6 more counties with infestations (Table 1, Figure 3).

Table 1. Soybean cyst nematode sampling results in 2021.

Fields tested Fields SCN+ Counties sampled Counties SCN+ New SCN+ counties
98 30a 37 15 6b

aMostly low populations (<500 eggs/cup of soil). Moderate egg counts (500-10,000 eggs/cup) were found in Western NY, the North Country, and the Southern Tier (no geographic trend).

bBroome, Genesee, Oneida, Schenectady (not previously sampled), Tioga, and Yates (not previously sampled).

NYS map
Figure 3. Counties with known infestations of soybean cyst nematode (red), counties that have been sampled but have not yielded positive samples (green), and counties that have not been sampled (gray).

To scout for damage and sample soil more efficiently, researchers from New York State IPM are investigating the effectiveness of using soil electrical conductivity (EC) mapping technology. Soil EC mapping can determine field distribution for many nematode species but has not been tested on SCN. Nematode population density, if present, has a strong positive correlation with the proportion of sand in the soil because of increased mobility in looser, sandier soils. EC measurements can be used to detect the variability in sand content in a field and thereby create a map of areas with higher likelihood of SCN. This map is then used to target soil sampling to those areas. Preliminary data collected in 2021 using an EC machine shows there is variation in SCN distribution within fields. Results from 2022 (funded by the NY Dry Bean Industry) will be used to seek additional funding to expand our mapping, and to utilize existing EC maps from growers of dry beans, soybeans, and snap beans to further validate this approach.

While we have many SCN-resistant soybean varieties, the majority (>95%) are derived from a single resistant cultivar, PI 88788. The extensive use of this cultivar in soybean breeding has led to the emergence of SCN populations that can overcome PI 88788-type resistance. For example, recent SCN surveys conducted in major soybean producing states including Missouri and Minnesota all reported an increased level of adaptation to PI 88788-type resistance. In contrast with our current soybean varieties, SCN field populations exhibit great genetic diversity. During the fall of 2022, researchers from the USDA-ARS will be collecting soil samples to conduct a comprehensive study on SCN distribution, density, and virulence phenotypes across New York state. Regular monitoring of SCN densities and virulence phenotypes is essential for developing effective management plans based on the use of resistant cultivars.

With the current infestation levels in NY, crop rotation is our most valuable management tool. Rotating out of soybeans for even one year can reduce SCN populations by 50% or more. Continuing to rotate crops allows us to keep populations low, reducing the likelihood that growers will have to resort to more costly management strategies.

Please contact your local Cornell Cooperative Extension agent if you would like your field(s) to be sampled for SCN. This year, the NY Corn and Soybean Growers Association (NYCSGA) is providing funding for up to 75 soybean fields to be tested, while the NY Dry Bean Industry is funding EC mapping of three dry bean fields and nine soil samples per field (27 total samples). With continued scouting, soil sampling, and race-typing by Cornell University, USDA-ARS, and NYSIPM, New York’s soybean and dry bean growers are in position to continue making the best management decisions for this pest.

Print Friendly, PDF & Email

Planning and Managing Permanent Vegetation Under Solar Arrays

By Joe Lawrence, PRO-DAIRY Forage Systems Specialist and the CCE Ag-Solar Program Work Team

Proper planning for the use of land within a solar array is critical to a successful project. Options exist from very low maintenance management of ground cover to more intensive agricultural production systems. Even with low maintenance systems, pre-planning has numerous benefits for the landowner, project operator and environment. Benefits can include protecting the soil, improved pollinator habitat and livestock (primarily sheep) grazing performance and reduced maintenance cost for the solar operator.

In observing recent installations of solar arrays, the pre-construction field conditions vary greatly. It is apparent that planning for desired vegetative cover post-construction needs to start when the site is selected and implemented in conjunction with the construction of the solar array.  This article will cover considerations for the successful establishment and maintenance of perennial ground cover options. The information is presented from the perspective of the Northeastern United States but may have applicability to other regions.

Existing Site Conditions

Managed Agricultural Land

Perennial Forage – When the proposed solar array location is in a perennial hay or pasture setting with good management, it is likely that less work will be needed but it still depends on desired outcomes after the project.

  • How will the site be managed post-construction?
    • Are the plant species present conducive to mowing?
      • Some forage species may become hard to manage if mowing frequency is low.
    • Are the species present desirable for sheep grazing?
      • Fields heavy in legumes may be too “rich” for some livestock.
    • Are the species present desirable for pollinators?
      • Several forage crops can serve as food for pollinators but may not provide the optimum selection.

Row Crops – a row crop field offers a clean slate for establishing perennial cover under the panels; however, can also create challenges with weeds. Row crop fields can contain significant weed seed banks which can present significant challenges when left unchecked as these weeds can take a foothold.

    • Annual weeds- allowing annual weeds to establish and produce seed during the planning and construction process can lead to significant increases in the weed seed bank and create weed management challenges for years to come.
    • Perennial weeds – perennial weeds tend to be very hardy, once established, and allowing them to establish during the planning and construction process will require a significant effort to permanently remove them.

Un-Managed or Idle Agricultural Land

Solar development is encouraged on marginal or idle agricultural land, in these scenarios significant encroachment of undesirable plants may have already occurred. Again, the post-construction management plan will impact how this is evaluated but the following should be considered.

    • Is existing vegetation considered invasive or pose other challenges to site management?
    • Invasive species or undesirable aggressive species should be managed prior to construction.
    • Will the existing vegetation cause challenges for mowing?
    • Will the growth habits of the existing vegetation interfere with solar infrastructure?
    • Is existing vegetation toxic or otherwise not palatable to livestock?
    • Are herbicide tolerant weeds present?
      • These should not be permitted to go to seed.
    • Resource: Restoring Perennial Hay Fields, Agronomy Factsheet #109

Pre-Construction Actions

In many cases management of undesirable plants will face less hurdles before the construction of the solar array.

Control Existing Vegetation

    • Mowing – if time permits prior to the start of construction, frequent mowing can reduce the presence of some weed species and encourage the growth of more desirable species.
    • Herbicides – Herbicides can be an effective control option for undesirable plant species. Care must be taken to assure that products are used in accordance with their label and steps are taken to avoid herbicide resistance development.
    • Tillage – tillage can effectively terminate numerous types of plants but may not be successful in controlling species with creeping root systems or the ability to regrow from existing plant parts.

*Note: Tillage may lead to additional germination from the soil seed bank so planning should include follow-up measures to control newly emerged weeds after initial tillage.

Establishment of New Vegetation

    • Standard practices of solar installation limit the impact on current ground cover, though conditions such as excessive rainfall during construction can increase soil disturbance. In cases where complete renovation of the vegetation is needed, it may be much more feasible to complete this prior to construction. Followed by necessary repairs after construction.
    • Prepare a proper seedbed / use appropriate equipment (seed to soil contact is critical for germination and establishment. Resource: Grass Seeding and Establishment
      • No-till – If the field conditions are smooth a properly set up no-till drill can provide a successful establishment without the need for tillage. Some control of existing vegetation may be necessary to allow newly seeded plants to establish.
      • Broadcast seeding
        • Existing Stand – success is marginal as proper seed to soil contact is variable.
          • Note: frost seeding is the practice of broadcasting seed onto the soil surface in the early spring and utilizing the natural freeze/thaw cycle of the soil to aid in improving seed to soil contact. This practice is known to improve success, though results are still variable.
          • Resource: March is Frost Seeding Time!
        • Prepared Seedbed
          • Broadcasting onto a prepared seedbed can improve the likelihood of success but is still risky compared to seeding with a grain drill.
          • Requires very well-prepared seedbed and packing following the seeding.

Fertility Management

    • Weeds are opportunistic and often thrive where soil fertility is poor. Regardless of intended management/use of the vegetation post-construction, addressing low fertility levels prior to construction will result in a much higher likelihood of successful establishment and long-term viability. The starting point for managing soil fertility is to measure the current status of the soil through a soil test.
    • The management of soil acidity (pH) is the backbone of a soil fertility program and should be addressed prior to other nutrient requirements. The native soil pH of a location is influenced the soil type and parent material (bedrock) at the location. The ideal pH range for most field crops is between 6.0 and 7.0.
    • While there are occurrences where the pH can be too high, in most scenarios if the pH is out of the desired range, it is low. Lime is used to raise pH levels.
    • Once adjustments to soil pH are made, attention should be given to other information provided on the soil test related to the status of macro-nutrients needs by field crops.

           Agronomy Fact Sheet # 17: Nutrient Management for Pastures

Plant Species Selection

To date, the most common plans for vegetation management under solar arrays are mechanical control (mowing), grazing sheep, and pollinator habitat, or a combination of these three. In almost every scenario a mixture of different plant species will provide more desirable outcomes than a monoculture. Mixtures provide diversity in growth habits with a number of benefits, including;

Growth throughout the season

    • Spring growth
    • Tolerance of Summer Heat
    • Fall growth

Success in micro-climates

    • Mixtures increase the chance that certain species will fill niches within a field
      • Wet or dry soil conditions
      • Shade
      • Variability in soil fertility

Pest Tolerance

    • Mixtures decrease the likelihood that a pest will overwhelm the field.

Diversity for pollinators and livestock

    • Offer pollinators different food sources at different points in season.
    • Improve source of nutrients for livestock and reduce risk of overconsumption.

Low Maintenance Ground Cover

Ground cover is important for environmental and solar productivity needs, and it is important to recognize that low maintenance does not equal no-maintenance. All solar arrays require vegetation management to prevent vegetation from affecting the solar system. The plant species present will impact the frequency, ease, and cost of managing this vegetation. Characteristics of common plant species for permanent ground cover in the northeast can be found in Appendix A.

Pollinator Habitat

Intentional use of targeted plant species will enhance the positive impacts of a solar array for pollinators. When pollinator habitat is a primary goal, planning for these goals in the pre-construction phase will improve success in meeting these goals.

Pasture Management

The performance of ruminant animals on pasture can be impacted by the plant species present and management of the pasture area. A mix of desirable plant species can improve animal growth and health as well as consistency of the feed source throughout different stages of the growing season.

Emerging Agrivoltaics

The prospects exist for hay harvest and cultivation of other crops within a solar array; however, these options will require additional planning and modifications to the installation that will necessitate further planning and negotiation with the developer.

Other Considerations

    • Pre-mixed seed – Certain pre-mixed seed options may contain undesirable species; it is important to check seed labels closely and consult with local advisors to assure there are no concerns regarding aggressiveness or suitability of species present in a seed pre-mix.
      • Be wary of inexpensive seed mixes.
      • Avoid plants considered non-native or known to be overly aggressive once established.
      • Fescue grasses containing Endophytes – Older varieties of Tall Fescue contain endophytes* and are still found in some low-quality seed mixtures. Improved Fescue varieties are novel endophyte or endophyte free which makes them safe for animal consumption. Selecting these modern varieties is strongly recommended in any scenario but especially if there is ever a possibility of grazing or hay harvest from the location.

* Endophyte fungus live within plant and can cause health and performance problems in livestock.

    • Reeds Canarygrass containing alkaloids – in many areas, historic stands of Reeds Canarygrass are likely to contain high alkaloid levels which can decrease palatability and cause health problems in livestock when consumed in high levels. Improved varieties of forage Reeds Canarygrass found on the market today are low alkaloid varieties.
      • Consideration: if historic stands of Reeds Canarygrass are present on the site, it is advised to terminate the vegetation and plant new improved varieties, particularly if grazing or hay production is a goal for the location.

Post-Construction Considerations

Repair following Construction Activities

    • Follow Plant Species Considerations presented above
      • Match new seeding to existing stand
      • Avoid Monocultures
    • Assure soil surface remediation and seedbed preparation is adequate
      • Removal of rocks or other debris
      • Smooth soil surface
        • Successful seeding establishment
        • Ease of future management

Stand Maintenance

    • Monitor for Weeds
      • Proper management through mowing and grazing will generally minimize the encroachment of weeds.
      • Mowing is a tool for controlling weeds as well as preventing these weeds from producing more seed. When pollinator or other wildlife habitat is a goal of the project, mowing frequency will need to be managed to balance these goals.
    • Monitor Soil Fertility
      • Soil Fertility issues should be corrected prior to establishment (see above)
      • Removal of plant material
        • When plant material is removed (grazed, hay harvest) nutrients are also removed. Overtime this can deplete soil fertility. Fields with low soil fertility will limit the productivity of desirable plant species and increase weed encroachment.
        • The depletion of nutrients will be slower under grazing management, as some nutrients are returned to the soil by the animals but will still occur over time.
        • When vegetation is removed, it will be necessary to monitor and potentially replace nutrients to maintain a healthy stand of desirable vegetation.
      • No removal of plant material
        • When vegetation is mowed and left on-site the nutrients are returned to the soil and little management should be needed (assuming adequate initial fertility).

Through considerations of the topics presented here a landowner should be well on their way to successful and proper planning for the management of land within a solar array.

Print Friendly, PDF & Email

Farmers Produce More Milk with Less Phosphorus and Nitrogen!

Olivia Godber1, Mart Ros1, Agustin Olivo1, Kristan Reed2, Mike van Amburgh2, Kirsten Workman1,3, and Quirine Ketterings1

1Nutrient Management Spear Program, 2Department of Animal Science, 3PRODAIRY, Cornell University, Ithaca, NY 14853

The Cornell whole farm nutrient mass balance (NMB) is an assessment tool that farms can use to calculate their nitrogen (N), phosphorus (P) and potassium (K) use efficiency at the farm level. By calculating the difference in the amount of nutrients imported into and exported out of the farm in a given calendar year, the amount of nutrients remaining on the farm or lost to the environment can be estimated (Figure 1).

Figure 1: A whole farm nutrient mass balance is derived by subtracting exports of nutrients in milk, animals leaving the farm, crops sold, and manure exported from nutrients imported with feed, fertilizer, animals, and bedding/manure/food waste, and dividing this difference by the total acreage of the farm (balance per acre) and by the total amount of milk produced (balance per cwt).

The balance per acre indicates how well the farm is putting nutrients to use on the farm, and the risk of losing nutrients to the environment. The balance per cwt milk indicates how efficiently the farm is using nutrients to produce milk. A positive P and K balance indicates soil buildup and potential losses for those nutrients over time. Nitrogen is more difficult to retain from one year to the next so a large portion of the N balance will be lost to the environment. Negative balances are undesirable as that can lead to yield losses and soil mining of P and K. Feasible balances were set for New York, Table 1: Feasible balances for New York dairy farms. Whole Farm Nutrient Mass Balances 	(lb/acre)	(lb/cwt) Nitrogen	0-105	0-0.88 Phosphorus	0-12	0-0.11 Potassium	0-37	0-0.30based on data from 102 dairy farms (Table 1). Feasible limits are positive (>0) to account for unavoidable losses, inevitable in all biological systems.

The ideal situation is for a farm to fall within the optimal operational zone (or “Green Box”; Figure 2). A farm falls within the Green Box when both the balance per acre, and the balance per cwt of milk are within the feasible limits. When this is the case, there is a lower risk of losing nutrients to the environment, greater nutrient use efficiency, and being within the Green Box can have both economic and environmental gains for the farm.

Key drivers of excessive balances include animal density, the proportion of feed produced on the farm, feed use efficiency, and fertilizer use. Fine-tuning fertilizer use and the amount of crude protein (CP) and P in animal feed, as well as increasing the production of homegrown feed, can help to improve balances. When animal density increases above one animal unit (AU) per acre (where 1 AU = 1000 lb; a cow and her replacement is roughly two animal units), manure exports become increasingly important to meet the feasible balances, especially for P.

scatter plot of results
Figure 2: The “Green Box” signals farms that meet the feasible balances per acre (blue zone) and per cwt (yellow zone). Grey dots represent farms across New York that participated in the whole farm nutrient mass balance (NMB) assessment (2003-2021).

The Good News!

There has been great progress in the reduction of P balances of New York dairy farms. Farmers who conducted the NMB assessment in 2017-2019 had balances of 0.07 lb P/cwt (Table 2). Farms in the assessment in 2005-2007, had balances of 0.11 lb P/cwt. This shows tremendous improvement in P use efficiency while the P balance per acre only slightly increased (0.1 lb P/acre) and still below the feasible balance of 12 lb P/acre established for New York.

Dairy farms participating in whole-farm nutrient mass balance assessments in recent years: •	Produced over 50% more milk per acre than farms participating in earlier years; •	Produced this milk with a 36% improvement in phosphorus use efficiency; •	Fed diets with a lower crude protein content, improving nitrogen efficiency; •	Are actively engaged in identifying more opportunities for improvement in nitrogen efficiency.Did farmers give up milk? No! The average milk production per acre was 9,500 lb/acre in 2005-2007 (0.81 AU/acre), compared to 14,900 lb/acre in 2017-2019 (1.10 AU/acre). Overall, farms participating in 2017-2019 produced more milk, on less land, with no major change in the environmental impact (in terms of P) compared to farms participating in 2005-2007.

For N, the balance per cwt decreased from 0.89 to 0.82 lb N/cwt (CP of the diet went from 16.1% to 15.5%). The footprint per acre increased by 26 lb N/acre, reflecting both the higher animal density, and increased N fertilizer use of the farms in the 2017-2019 dataset. However, if no progress had been made in N management, particularly the lower CP content of the diets and increased milk yields, the increase in animal density of the more recent summary would have placed the farms even further outside of the Green Box for lb N/acre (closer to 128 lb N/acre, based on the performance of the farms in 2005-2007). Thus, for N this is also a good news story, but continued effort in management of N imports, exports and efficiency of use is needed for the N balance to be within the Green Box.

Next Steps?

It is clear from the data collected by the farmers in these NMB assessments that there has been tremendous progress in lowering the amount of N and P used to produce milk by dairy farmers in New York. Future work should focus on further reducing the CP content of cow diets without compromising performance, and optimizing manure storage and land application systems (e.g. timing, injection or incorporation) to minimize N losses from manure and reduce the reliance on fertilizer imports. For higher density farms, exploring options for cost-effective manure export should also be a focus. Improving N management on the farm will not only have the potential to improve N balances and farm economics, but also reduce nitrous oxide (N­2O) emissions, a potent greenhouse gas.

Acknowledgements

We thank the farmers and farm advisors as well as many past and current NMSP team members who worked on the whole farm nutrient mass balance project with us over the past 15+ years. This research is funded primarily by a gift from Chobani, in addition to Federal Formula Funds, and grants from the Northern New York Agriculture Development Program (NNYADP), Northeast Region Sustainable Agriculture and Education (NESARE), New York State Department of Environmental Conservation (NYDEC). For questions about these results, contact Quirine M. Ketterings at qmk2@cornell.edu, and/or visit the Cornell Nutrient Management Spear Program website at: http://nmsp.cals.cornell.edu/.

Print Friendly, PDF & Email