Farmers Produce More Milk with Less Phosphorus and Nitrogen!

Olivia Godber1, Mart Ros1, Agustin Olivo1, Kristan Reed2, Mike van Amburgh2, Kirsten Workman1,3, and Quirine Ketterings1

1Nutrient Management Spear Program, 2Department of Animal Science, 3PRODAIRY, Cornell University, Ithaca, NY 14853

The Cornell whole farm nutrient mass balance (NMB) is an assessment tool that farms can use to calculate their nitrogen (N), phosphorus (P) and potassium (K) use efficiency at the farm level. By calculating the difference in the amount of nutrients imported into and exported out of the farm in a given calendar year, the amount of nutrients remaining on the farm or lost to the environment can be estimated (Figure 1).

Figure 1: A whole farm nutrient mass balance is derived by subtracting exports of nutrients in milk, animals leaving the farm, crops sold, and manure exported from nutrients imported with feed, fertilizer, animals, and bedding/manure/food waste, and dividing this difference by the total acreage of the farm (balance per acre) and by the total amount of milk produced (balance per cwt).

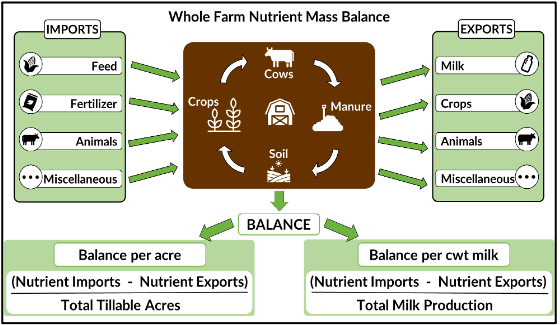
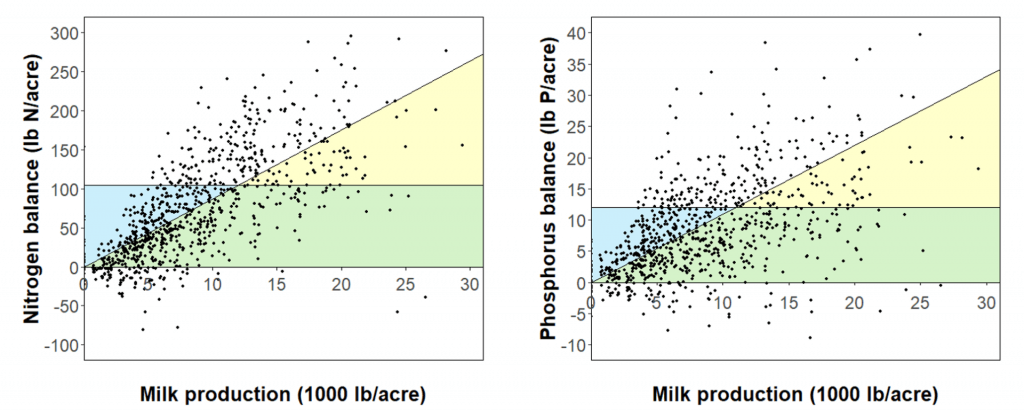
The balance per acre indicates how well the farm is putting nutrients to use on the farm, and the risk of losing nutrients to the environment. The balance per cwt milk indicates how efficiently the farm is using nutrients to produce milk. A positive P and K balance indicates soil buildup and potential losses for those nutrients over time. Nitrogen is more difficult to retain from one year to the next so a large portion of the N balance will be lost to the environment. Negative balances are undesirable as that can lead to yield losses and soil mining of P and K. Feasible balances were set for New York, Table 1: Feasible balances for New York dairy farms. Whole Farm Nutrient Mass Balances 	(lb/acre)	(lb/cwt) Nitrogen	0-105	0-0.88 Phosphorus	0-12	0-0.11 Potassium	0-37	0-0.30
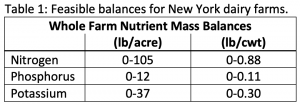
based on data from 102 dairy farms (Table 1). Feasible limits are positive (>0) to account for unavoidable losses, inevitable in all biological systems.

The ideal situation is for a farm to fall within the optimal operational zone (or “Green Box”; Figure 2). A farm falls within the Green Box when both the balance per acre, and the balance per cwt of milk are within the feasible limits. When this is the case, there is a lower risk of losing nutrients to the environment, greater nutrient use efficiency, and being within the Green Box can have both economic and environmental gains for the farm.

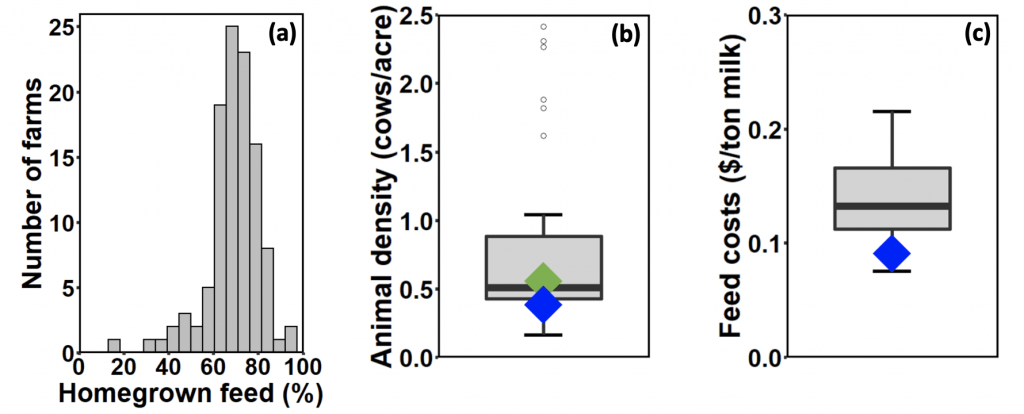
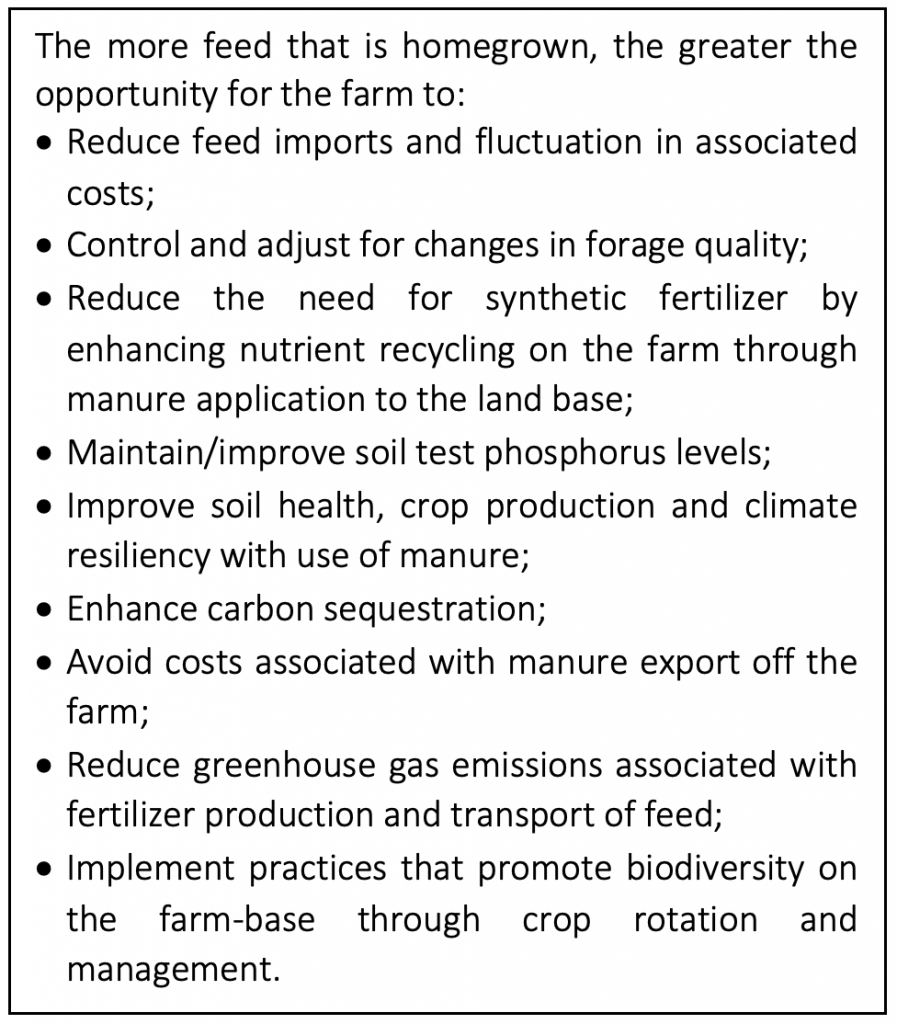
Key drivers of excessive balances include animal density, the proportion of feed produced on the farm, feed use efficiency, and fertilizer use. Fine-tuning fertilizer use and the amount of crude protein (CP) and P in animal feed, as well as increasing the production of homegrown feed, can help to improve balances. When animal density increases above one animal unit (AU) per acre (where 1 AU = 1000 lb; a cow and her replacement is roughly two animal units), manure exports become increasingly important to meet the feasible balances, especially for P.

scatter plot of results
Figure 2: The “Green Box” signals farms that meet the feasible balances per acre (blue zone) and per cwt (yellow zone). Grey dots represent farms across New York that participated in the whole farm nutrient mass balance (NMB) assessment (2003-2021).

The Good News!

There has been great progress in the reduction of P balances of New York dairy farms. Farmers who conducted the NMB assessment in 2017-2019 had balances of 0.07 lb P/cwt (Table 2). Farms in the assessment in 2005-2007, had balances of 0.11 lb P/cwt. This shows tremendous improvement in P use efficiency while the P balance per acre only slightly increased (0.1 lb P/acre) and still below the feasible balance of 12 lb P/acre established for New York.

Dairy farms participating in whole-farm nutrient mass balance assessments in recent years: •	Produced over 50% more milk per acre than farms participating in earlier years; •	Produced this milk with a 36% improvement in phosphorus use efficiency; •	Fed diets with a lower crude protein content, improving nitrogen efficiency; •	Are actively engaged in identifying more opportunities for improvement in nitrogen efficiency.
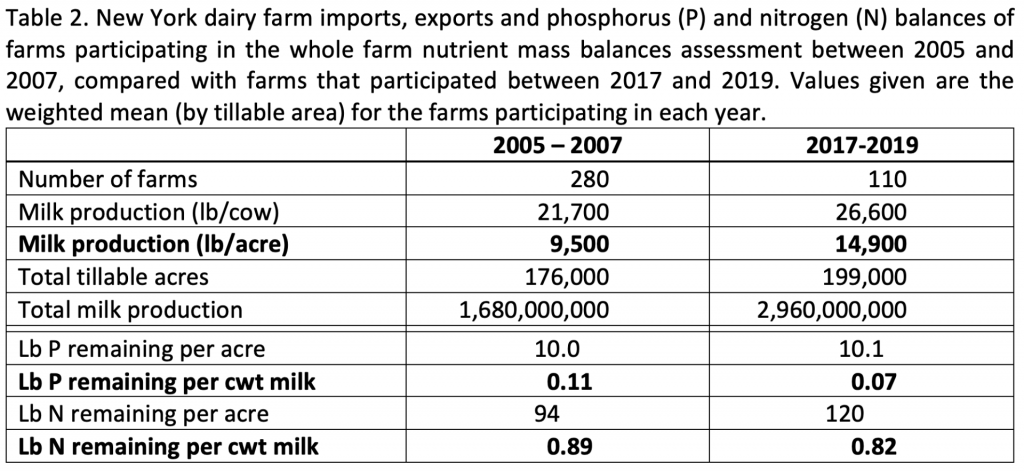
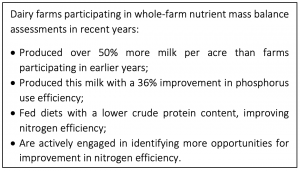
Did farmers give up milk? No! The average milk production per acre was 9,500 lb/acre in 2005-2007 (0.81 AU/acre), compared to 14,900 lb/acre in 2017-2019 (1.10 AU/acre). Overall, farms participating in 2017-2019 produced more milk, on less land, with no major change in the environmental impact (in terms of P) compared to farms participating in 2005-2007.

For N, the balance per cwt decreased from 0.89 to 0.82 lb N/cwt (CP of the diet went from 16.1% to 15.5%). The footprint per acre increased by 26 lb N/acre, reflecting both the higher animal density, and increased N fertilizer use of the farms in the 2017-2019 dataset. However, if no progress had been made in N management, particularly the lower CP content of the diets and increased milk yields, the increase in animal density of the more recent summary would have placed the farms even further outside of the Green Box for lb N/acre (closer to 128 lb N/acre, based on the performance of the farms in 2005-2007). Thus, for N this is also a good news story, but continued effort in management of N imports, exports and efficiency of use is needed for the N balance to be within the Green Box.

Next Steps?

It is clear from the data collected by the farmers in these NMB assessments that there has been tremendous progress in lowering the amount of N and P used to produce milk by dairy farmers in New York. Future work should focus on further reducing the CP content of cow diets without compromising performance, and optimizing manure storage and land application systems (e.g. timing, injection or incorporation) to minimize N losses from manure and reduce the reliance on fertilizer imports. For higher density farms, exploring options for cost-effective manure export should also be a focus. Improving N management on the farm will not only have the potential to improve N balances and farm economics, but also reduce nitrous oxide (N­2O) emissions, a potent greenhouse gas.

Acknowledgements

We thank the farmers and farm advisors as well as many past and current NMSP team members who worked on the whole farm nutrient mass balance project with us over the past 15+ years. This research is funded primarily by a gift from Chobani, in addition to Federal Formula Funds, and grants from the Northern New York Agriculture Development Program (NNYADP), Northeast Region Sustainable Agriculture and Education (NESARE), New York State Department of Environmental Conservation (NYDEC). For questions about these results, contact Quirine M. Ketterings at qmk2@cornell.edu, and/or visit the Cornell Nutrient Management Spear Program website at: http://nmsp.cals.cornell.edu/.

Print Friendly, PDF & Email

Homegrown Feed for Dairy Farms in New York

Olivia Godber1, Mart Ros1, Agustin Olivo1, Kristan Reed2, Mike van Amburgh2, Kirsten Workman1,3, and Quirine Ketterings1

1Nutrient Management Spear Program, 2Department of Animal Science, 3PRODAIRY, Cornell University, Ithaca, NY 14853

Introduction

Between 2017 and 2019, 110 New York dairy farms completed their whole farm nutrient mass balance assessment. Of the feed fed to the animals on the farms, almost 70% was homegrown, which means it was produced on the land-base operated by the farm itself (Figure 1a). Almost all this homegrown feed was forages such as corn silage, alfalfa, and grass. The farms averaged 0.56 mature cows per acre (weighted by tillable acres). How does this compare to average values in the United States and why is this important?

Comparison with Dairies in New York and Nationally

The share of homegrown feed for the New York farms was considerably high than typically reported across the US. The number of mature cows per acre was higher across the US (Figure 1b), while farmers in the assessment spent considerably less on feed costs per unit of milk produced than reported for the US (Figure 1c).

graphical representation of study results
Figure 1: (a) The share of homegrown feed on New York dairy farms participating in the 2017-2019 nutrient mass balance assessment (histogram); (b) the average number of mature cows per acre of cropland on dairy farms in the US (boxplot) and on New York dairy farms (blue diamond) according to the 2017 USDA Census of Agriculture, and the average number of mature cows per tillable acre for New York dairy farms participating in the 2017-2019 nutrient mass balances (green diamond); (c) the average amount spent on purchased feed per ton of milk sold for US dairy farms (boxplot) and New York dairy farms (blue diamond) according to the 2017 USDA Census of Agriculture.

Importance of Optimizing Homegrown Forage Production

The more feed that is homegrown, the greater the opportunity for the farm to: •	Reduce feed imports and fluctuation in associated costs; •	Control and adjust for changes in forage quality; •	Reduce the need for synthetic fertilizer by enhancing nutrient recycling on the farm through manure application to the land base; •	Maintain/improve soil test phosphorus levels; •	Improve soil health, crop production and climate resiliency with use of manure;  •	Enhance carbon sequestration; •	Avoid costs associated with manure export off the farm; •	Reduce greenhouse gas emissions associated with fertilizer production and transport of feed; •	Implement practices that promote biodiversity on the farm-base through crop rotation and management.For most dairy farms, feed purchases are the largest annual expense, so growing forages on the farm’s land base reduces the costs of feed. However, there are also other reasons why optimizing homegrown feed is key.

    • Reducing the amount of feed that needs to be imported helps to avoid the carbon and energy footprint that imported feeds have (production elsewhere plus transport to the farm).
    • By minimizing feed imports, farms are also minimizing the risk of feed price fluctuations and economic uncertainty.
    • Farmers that grow feed have greater control over the quality of that feed. They can select what crops are needed and in which quantities to meet the needs of their animals.
    • Farmers can, to a certain extent, alter crop management practices as needed, and optimize nutrient use, thereby reducing nutrient losses to the environment.
    • By increasing nutrient recycling with the use of manure on the farm itself, farms are reducing their reliance on fertilizer use. This results in a smaller environmental footprint for feed production. Optimizing the use of manure over synthetic fertilizer can also help with managing volatile fertilizer prices and with the farm’s overall economic sustainability.
    • Farms with insufficient land base will need to export manure. By optimizing feed production and animal density, a farm can reap the benefits of using manure, thereby avoiding extra expenses incurred with manure export (if feasible at all) and avoiding carbon emissions associated with the transport of manure beyond the farm boundaries.

Acknowledgements

We thank the farmers, farm advisors and past and current NMSP team members who worked on the whole farm NMB project with us over the past 15+ years. This research is funded primarily by a gift from Chobani, in addition to Federal Formula Funds, and grants from the Northern New York Agriculture Development Program (NNYADP), Northeast Region Sustainable Agriculture and Education (NESARE), New York State Department of Environmental Conservation (NYDEC). For questions, contact Quirine M. Ketterings (qmk2@cornell.edu) or visit the Cornell Nutrient Management Spear Program website at: http://nmsp.cals.cornell.edu/.

Print Friendly, PDF & Email

Corn Grain Yield Estimation with Drones – Timing is Key!

Sunoj, S.1, J. Cho1, J. Guinness2, J. van Aardt3, K.J. Czymmek1,4, and Q.M. Ketterings1 

1Nutrient Management Spear Program, Department of Animal Science, 2Department of Statistics and Data Science, and 4PRODAIRY, Department of Animal Science, Cornell University, Ithaca, NY 14853; 3Chester F. Carlson Center for Imaging Science, Rochester Institute of Technology

Introduction

Yield maps can help farmers identify high and low yielding areas in a field and customize management practices to maximize return on investment. Currently, most yield monitor systems on choppers and combines record yield and GPS location at 1-second intervals. With properly calibrated systems, and once data generated by these systems are cleaned of errors, accurate yield maps can be generated. However, calibration and data cleaning are required as extra steps prior to yield mapping, while sensors are expensive and can break during harvest, without the opportunity to redo the data collection. Approaches to estimate yield that reduce the risk of data loss, are less time consuming, and can be used by a larger number of farmers therefore could be beneficial. Here we report on a study using drones (commonly called “unmanned aerial systems” or UAS) to estimate yield at the subfield level.

Timing of N sidedress and UAS flights

Sidedress N treatments – The experiment was conducted at the Musgrave Research Farm in Aurora, NY in 2019. All N treatments received starter N (30 lbs N per acre). Six N treatments were implemented including zero N (NoN – only starter), N rich (NRich; 300 lbs N per acre at planting), and sidedress applications (180 lbs N per acre applied) at V4, V6, V8, or V10.

UAS flights – Weekly UAS flights (total of 12 flights) were done between VE and R5 using the QuantixTM mapper from AeroVironment Inc. The UAS payload consists of two cameras, one for color imagery (red, green, and blue bands) and one with a near-infrared (NIR) band. The reflectance values were used for calculating “vegetation indices”, which typically are used to highlight specific vegetation features or conditions. Although six different vegetation indices were tested, we only report here on models derived using the normalized difference vegetation index (NDVI), which was best-suited for yield estimation. NDVI is a combination of the red and near-infrared bands.

Results

Did a Delay in Sidedressing Impact Yield?

All N treatments that received more than just starter N produced higher yields (Figure 1A), with NRich and sidedressing at V4 and V6 producing the highest yields (~170 bushels per acre) and the NoN treatment producing the lowest yields (85 bushels per acre). Delay in sidedressing to V8 and V10 resulted in lower yields. These results were consistent with N sidedress experiments across four years at the same location (Link).

Did Timing of Sidedressing Impact Yield Model Accuracy?

The timing of N sidedress application had not just an effect on yield, but also on NDVI reflectance when sensed at the R4 growth stage (Figure 1A). Earlier sidedress N application (up to V6) produced a narrow range of NDVI values, while delaying the N sidedress application produced more variable NDVI signals (e.g., V8 and V10 in Figure 1A).

The performance of yield estimation models (Figure 1B) showed that models that used data from plots that were sidedressed at or before V6 did well (R2 > 0.90), whereas inclusion of data from plots that were sidedressed at V8 or V10 were much less reliable (R2 < 0.68). These findings suggest that estimation of yield for fields that were sidedressed later than V6 are much less reliable, even with inclusion of NoN and NRich NDVI data.

scatter plot and bar graph depicting data points
Figure 1. (A) Relationship between corn grain yield (from yield monitor system) and NDVI reflectance (from UAS) for different nitrogen (N) treatments; and (B) Yield model performance for different combinations of sidedress N application. Note: NoN = starter only; NRich = 300 lbs N per acre at planting; V4, V6, V8, and V10 = sidedressing of 180 lbs N per acre at the respective growth stages. The values above each bar indicate the coefficient of determination (R2) for models fitted with NDVI and corn grain yield. The R2 values range between 0 and 1, with 1 being the best model. Models were derived from flights at the R4 growth stage.

Does Timing of Flight in the Season (Growth Stage) Impact Yield Model Accuracy?

Flights at the R4 growth stage resulted in reliable models, as long as sidedressing took place at or before V6. But what about flying earlier in the season? Data shown in Figure 2 indicate a much lower estimation accuracy at all vegetative growth stages (up to VT) and after R4 (Figure 2). At R5 the canopy started to turn yellow and much of the reflectance signals were not reliable for yield estimation. The lower performance at R2 was attributed to cloudy conditions during the flight, highlighting one challenge with the use of passive sensors to capture NDVI. Our results suggest that flying on a sunny day, when corn is between R1 and R4, gives us the best yield estimation models.

bar chart of data points
Figure 2. Corn grain yield estimation performance of NDVI using the UAS images obtained throughout the growing season.
Conclusions and Implications

Yield estimation using drones is a promising approach provided we implement the following management strategies: (1) Avoid delay in sidedressing – Sidedressing after V6 not only reduced corn grain yield, but also produced variable NDVI values, resulting in poor estimations of corn grain yield; (2) Fly the drone between R1 and R4 – After R4, the canopy starts to turn yellow, which makes it unsuitable for yield estimation; and (3) Avoid cloudy days for flights – Flying on  cloudy days can impact the images collected and the accuracy of yield estimation models derived from the imagery. Ongoing research at the NMSP is exploring an approach of scaling this work to larger fields and developing yield estimation models that can be applied across farm fields and different farms.

Full Citation

This article is summarized from our peer-reviewed scientific publication: Sunoj, S., J. Cho, J. Guinness, J. van Aardt, K.J. Czymmek, and Q.M. Ketterings (2021). Corn Grain Yield Prediction and Mapping from Unmanned Aerial System (UAS) Multispectral Imagery. Remote Sensing, 13(19), 3948. https://doi.org/10.3390/rs13193948

Acknowledgements

This research was funded with federal formula funds. We thank Greg Godwin for flying the Quantix drone and Paul Stachowski, farm manager of the Musgrave Research Farm at Aurora, NY, for help with field management. We also thank the many NMSP team members for help with harvest and sample processing over the years. This research was funded in part with Federal Formula Funds and through grants from the New York Farm Viability Institute (NYFVI) and New York State Department of Environmental Conservation (NYDEC). J.G. received support from the National Science Foundation under grant No. 1916208. For questions about these results, contact Quirine M. Ketterings at 607-255-3061 or qmk2@cornell.edu, and/or visit the Cornell Nutrient Management Spear Program website at: http://nmsp.cals.cornell.edu/.

Print Friendly, PDF & Email

Are Persistent Biocontrol Nematodes (Entomopathogenic) for the control of Corn Rootworm an economic benefit for your NY farm?

Elson Shields and Tony Testa, Dept of Entomology, Cornell University, Ithaca, NY

Research in NY has shown that corn rootworm can be controlled for multiple growing seasons with a single application of native persistent biocontrol nematodes, known also as Entomopathogenic nematodes.  On NY farms with a good crop rotation between corn and other crops, research shows biocontrol nematodes can be used to replace the more costly GMO-rootworm traited corn.  On NY farms where GMO-rootworm traits are failing, the addition of biocontrol nematodes to the field as an additional management tool restores the yield to the pre-rootworm damage level and targets the resistant rootworm larvae who have survived the toxin in the plant but should not be used alone.  In fields which are long-term continuous corn, biocontrol nematodes should only be utilized with corn containing rootworm traits because these two different modes of mortality for rootworm reduces the long-term selection for resistance.

What are Biocontrol Nematodes?

Biocontrol nematodes are microscopic round worms in the soil which only attack insects in the soil or on the soil surface.  Biocontrol nematodes are different from the plant parasitic nematodes which attack crops.  The biocontrol nematodes discussed here are native to our Northern New York (NNY) soil where they were original collected.  The nematode insect infective stage (called the Infective Juvenile or IJ) moves about in the soil in search of insect hosts, finding the insect using CO2 gradients and other chemical attractants.  When an insect host is located, the IJ enters the insect through a breathing opening called a spiracle and enters the insect body cavity.  Once inside, the nematode releases a bacteria which kills the insect.  The nematodes then molt to adults and produce offspring on the nutrition provided by the dead insect.  When the insect resources are consumed, a new set of IJs are released into the soil to search for additional insect hosts.  An average sized insect larvae will produce between 100,000 and 200,000 new IJs.

What do these biocontrol nematodes attack?

This entire technology was developed to reduce snout beetle (ASB) populations to sub-economic levels in NNY.  ASB is costly to the dairy farmer, commonly killing alfalfa stands in a single year.  To date, more than 150 NNY farms have applied biocontrol nematodes to >25,000 acres to successfully reduce snout beetle to a sub-economic level and increase stand life back to 3-5 years.

Corn Rootworm:  During the research developing the use of native persistent biocontrol nematodes to reduce ASB populations in NNY to sub-economic levels, it was discovered that biocontrol nematodes applied in alfalfa for snout beetle control also carryover to attack corn rootworm when the field is rotated to corn.  Biocontrol nematodes completely compatible with all of the Bt-RW traits, killing the Bt toxin survivors,.  Research has shown that after 4 years of corn, the populations of biocontrol nematodes in the field are high enough to attack alfalfa soil insects when the field is rotated back to alfalfa.

Wireworm and White grubs:  Since NY alfalfa culture usually incorporates grass into the mix, NY fields usually have a population of wireworms and native white grubs in the field when the field is rotated to corn.  Often, these insects then cause stand problems in 1st year corn.  If the field has been inoculated with biocontrol nematodes for control of either snout beetle or rootworm, the biocontrol nematodes also attack these insects and reduce their impact on seedling corn when rotated to corn.

Does the soil type influence the species of biocontrol nematode applied?

NY research data indicates a mix of biocontrol nematode species gives better control of soil insects than a single species alone.  The reason for these results is each nematode species has a preferred section of the soil profile where it is most effective.  For example, Steinernema carpocapsae prefers the top 2-3” of the soil profile and dominates this region.  If S. carpocapsae is the only nematode used, insect larvae below the 2” level escape attack.  The addition of a second nematode species which prefers the low portions of the soil profile compliments the presence of S. carpocapsae and gives more complete control of soil insects throughout the plant root zone.  In sandier soils, the top 2” often become too dry for a biocontrol nematode to move and attack insect larvae.  In these soils, a nematode species mix which include S. carpocapsae would be ineffective and requires a different mix of nematode species.

Our recommendations for biocontrol nematode species mixes for soil types:

Clay loam – silt loam soils:  S. carpocapsae + S. feltiae

Sandy loams – sand soils:  S. feltiae + Heterorhabditis bacteriophora.

What are the differences between the entomopathogenic (biocontrol) nematodes purchased on the web from the Persistent NY strains mentioned here?

Biocontrol nematodes purchased from commercial sources have lost the ability to persist in the soil after application for a significant length of time.  Many commercial strains persist in the soil for only 7-30 days and require application timing to be closely match with the presence of their target host, requiring an annual reapplication.  In contrast, the NY persistent strains of Biocontrol Nematodes are carefully cultured to maintain their evolutionary ability to persist across hostile conditions such as the lack of available hosts and temperature extremes (dry soil conditions, winter).  Additionally, NY persistent strains are re-isolated from the field every two years so the nematode cultures do not become “Lab strains”, but remain adapted for NY agricultural soil conditions.  New York persistent strains are applied once and persist in the field for many years following application.  Not surprising because they were isolated from NY soils where they have evolved for a few million years.  If the NY persistent strains are cultured carelessly, they also quickly lose their ability to persist and are no better than the commercial strains purchased off the web.

How are biocontrol nematodes applied?

There are two major ways to apply biocontrol nematodes to NY fields.

Commercial Pesticide Sprayer:  Thousands of acres have been inoculated using slightly modified pesticide sprayers of all sizes from 30’ booms to 100+’ booms.  To use these sprayers, the following guidelines need to be followed.

    1.   A good washing of the sprayer (similar to changing pesticides)
    2.   All screens and filters removed (nematodes cannot pass through them)
    3.   Nozzle change to a stream type nozzle to shoot a concentrated stream of water to the soil surface through any vegetation.
    4.   50 gpa minimum
    5.   Application in the evening or under cloudy/rainy conditions (nematodes are sensitive to UV)

Liquid Dairy Manure:  This method was recently developed and offers some advantages over using a pesticide sprayer.  The biggest limitation is the time between adding the nematodes to the liquid manure and field application.  After adding the nematodes to the manure, the manure needs to be spread in the field within 20-30 minutes.  Longer intervals results in the nematodes dying from the lack of oxygen.

The advantages of using liquid dairy manure as the carrier are 1)  no extra trips over the field, 2)  can be applied any time of the day and 3)  no extra costs.

Application timing:

Biocontrol nematodes which are persistent, can be applied anytime during the growing season when soil temperatures are above 50 F.  Ideally, nematodes should be applied when there are host in the soil so they can immediately go to work and reproduce.  However, the NY persistent strains have the ability to sit and wait for months before needing to attack hosts and reproduce.  We request that no nematode applications be made after September 15th due to cooling soil temperatures and limited time to find hosts before winter.  Applications are made to the soil surface under conditions of low UV exposure (late in the day, rainy/overcast days, in cover crops where there is adequate ground shading).  Field tillage has no impact on biocontrol nematodes.  In addition, if nematodes are applied before field tillage, the movement of soil during tillage helps the nematodes redistribute throughout the field and help them fill in the gaps which may occur during application.

Where can I get Biocontrol Nematodes which are adapted to NY and will persist across growing seasons?

Currently, there are two sources to purchase biocontrol nematodes adapted to NY growing conditions with their persistent genes intact to persist across growing seasons (and winter) in NY.

    1.   Mary DeBeer, Moira, NY.  cell:  (518) 812-8565  email:  md12957@aol.com
    2.   Shields’ Lab, Cornell University:  Tony Testa  email:  at28@cornell.edu  cell: (607) 591-1493
Print Friendly, PDF & Email

Seed Corn Maggot, Stand Losses and the Need for Insecticide Seed Treatments

Elson J. Shields, Entomology, Cornell University, Ithaca, NY

Seed corn maggot, Delia platura, (SCM) is the primary NY pest attacking large-seeded crops during germination.  These crops include corn, soybean and edible beans.  One of the difficulties in managing this pest is the unpredictability of the infestations, the lack of an insecticide rescue option and the lack of flexibility to compensate for crop stand losses.

SCM adult flies, looking similar to small house flies, are attracted to fields with high organic matter within the plant zone, and lay their eggs close to germinating crop seeds.  The newly hatched larvae attack and feed on the germinating seeds and young emerging plants.  In NY, the frequent use of animal manures and cover crops known as green manure crops increases the attractiveness of the fields to SCM.  The short and cool NY growing season encourages growers to plant their crops as early as possible to be able to harvest profitable yields.  This early planting of seeds into cold soils results in slow and delayed emergence which increases the window of vulnerability to SCM damage.  In these situations, stand losses can exceed 50% due to the attractiveness of the organic matter, resulting in a high level of eggs being laid around the germinating seeds.

Under NY growing conditions, measurable yield losses in corn start to occur between 10-20% stand losses.  The magnitude of the yield loss is dependent on the corn variety, degree-day maturity requirements and the subsequent growing conditions which influence the ability of the undamaged plants to compensate for the damaged plants.  Due to the short growing season in NY, the decision to replant the field is seldom an option due to the additional expense of replanting (ca. $130/ac) and the yield reductions associated with shorter season corn variety required to be planted for maturity to be completed before killing temperatures in the fall. Typically, if the surviving corn stand has less than a 40% stand loss, the resulting yield loss is less costly than the combined cost of replanting and yield decline associated with late planting.

2021 Field Study in Aurora, NY

A study was initiated to examine the impact of SCM and the necessity of insecticide seed treatments on corn grown under continuous corn culture with minimal organic matter and corn following a green manure cover crop with high organic matter.

Experimental design:

The continuous corn site had been planted to corn for 7 years prior to the 2021 growing season.  Previous corn crops had been harvested as grain and soil tillage was restricted to spring chisel plowing.  Crop residue was minimal and planting in 2021 was achieved using a 4-row no-till planter.  The cover crop site was planted to red clover in 2020 and the clover crop was retained as a green manure crop.  Prior to planting the cover crop site to corn, the clover was mowed, liquid dairy manure was applied to the surface and the soil was chisel plowed to prepare the seed bed for planting.  Planting in 2021 utilized a 4-row no-till planter.  Each area was planted on a weekly basis yielding 6 different sequential planting dates.  Each row of the 4-row planter contained a different treatment and the plots for each planting date were comprised of a single planter pass in the continuous corn and two planter passes in the cover crop site.  The following treatments were planted as single rows within each planter pass.  1)  conventional corn (non-Bt-RW) with no seed applied insecticide, 2) conventional corn (non-Bt-RW) with seed applied insecticide, 3)  Bt-RW corn with no seed applied insecticide and 4)  Bt-RW corn with seed applied insecticide.  Each planting date was replicated four times at each location.  Data collected included stand counts after the plants were V3-4 growth stage and excavation of the missing plants to document the reason for the missing plant.

Results:

Continuous corn site:

At the continuous corn site, the experimental design allowed 24 planting pairs (corn type x presence/absence of seed applied insecticide) for comparison and analysis.  Fourteen of the 24 planting pairs (58%) suffered stand losses in the untreated seed row from seed corn maggot ranging from 2% to 66% stand loss.  If the 10% stand loss/yield loss threshold is used, then nine of the 24 planting pairs (38%) indicated economic yield losses in the non-seed applied insecticide treatments. If 14% stand loss/yield loss threshold is used, then eight of the 24 pairs (33%) indicated economic yield losses in the non-seed applied insecticide treatments.   If the 20% stand loss threshold is used, then six of 24 (25%) planting pairs indicate economic losses in the non-seed applied insecticide treatments.  Four of the planting pairs had greater than 40% stand losses in the non-seed applied insecticide treatments.

Corn following cover crop site:

In the corn following cover crop site, the experimental design allowed 24 planting pairs (corn type x presence/absence of seed applied insecticide) for comparison and analysis.  Sixteen of the 24 planting pairs (66%) suffered stand losses in the untreated seed row from seed corn maggot ranging from 2% to 62% stand loss.  If the 10% stand loss/yield loss threshold is used, then 13 of the 24 planting pairs (54%) indicated economic yield losses in the non-seed applied insecticide treatments.  If 14% stand loss/yield loss threshold is used, then nine of the 24 pairs (38%) indicated economic yield losses in the non-seed applied insecticide treatments.  If the 20% stand loss threshold is used, then seven of 24 (29%) planting pairs indicate economic losses in the non-seed applied insecticide treatments.  Five of the planting pairs had greater than 40% stand losses in the non-seed applied insecticide treatments.

Discussion:

The following values were estimated for 2021 from three different regions of NY.  These values were estimated by regional experts.

Region                          Silage value (in field)                 Representative Yield                 Value/ac

NNY:                                         $40/ton                                    17 tons/ac                            $680

CNY                                          $38/ton                                    20 tons/ac                            $760

WNY:                                        $47/ton                                      20 tons/ac                            $940

In all three regions, a one-ton silage loss per acre in yield equals eight-times the cost of the insecticide seed treatment.  A one-ton reduction in silage is approximately 5% loss in yield which equals a $40 loss per acre.  If we use the estimate that 1%-5% yield losses began at a 10% stand loss ($8-$40 in lost silage), then it is economically beneficial for the farmer to utilize an insecticide seed treatment costing $5 per acre to prevent the loss.

Continuous Corn:

Research data collected in controlled studies during 2021 at the Cornell Musgrave Farm located in Aurora, NY shows that in continuous corn production, seed corn maggot economically damaged 38% of the non-insecticide seed treated plots ranging from 10% to 66% stand losses.  If we estimate a 10% stand loss equals a 1-5% yield loss, then the value loss to the farmer is $8-$40/acre.

The cost to the farmer to protect his yield loss with insecticide seed treatment is $5/acre and therefore it is economically viable to spend $5 per acre to protect yield losses ranging from $8 to $400 per acre on 38% of a farm’s acreage.  If we estimate a 20% stand loss results in a greater than 5% yield loss, then 25% of the fields will suffer losses greater than $40 per acre.  These losses would be economically devastating to a farmer, where the farm loses yield on 38% of their acreage ranging from $40/ac to $400/ac.  Since predicting which fields will be attacked by seed corn maggot prior to planting is difficult and imprecise, the prevention of yield losses ranging from $40-$400/ac on 25% of the acreage easily compensates and is economically justified for the cost of the insecticide seed treatment for all acres.

Corn following a Cover Crop:

Research data collected in controlled studies during 2021 at the Cornell Musgrave Farm located in Aurora, NY shows that in corn production following a cover crop, seed corn maggot economically damaged 54% of the non-insecticide seed treated plots ranging from 11% to 62% stand losses.

If we estimate a 10% stand loss equals a 1-5% yield loss, then the value loss to the farmer is $8-$40/acre.  The cost to the farmer to protect his yield loss with insecticide seed treatment is $5/acre and therefore it is economically viable to spend $5 per acre to protect yield losses ranging from $8 to $400 per acre on 54% of a farm’s acreage.  If we estimate a 20% stand loss results in a greater than 5% yield loss, then 33% of the fields will suffer losses greater than $40 per acre.  These losses would be economically devastating to a farmer, where the farm loses yield on 54% of their acreage ranging from $40/ac to $400/ac.  Since predicting which fields will be attacked by seed corn maggot prior to planting is difficult and imprecise, the prevention of yield losses ranging from $40-$400/ac on 33% of the acreage easily compensates and is economically justified for the $5 per acre cost of the insecticide seed treatment for all acres.

Conclusions:

This 2021 research data indicates the level of potential economic losses by NY corn farmers if seed applied insecticide is not available for use.  In NY, replanting after stand losses from SCM is not a viable economic option in most situations due to the short NY growing season.  The farmer is required to suffer yield losses due to reduced stand because replanting is seldom a viable economic option.

These data documents the increased risk of economic stand losses from SCM when the farmer plants corn after a cover crop/green manure crop, which is utilized in soil building and nutrient retention over the winter months.  These data also indicate why the attempts to have farmers adopt cover crops in the 1990’s, were not successful due to SCM related stand losses in the corn crop planted following the cover crop.  Adoption of cover crops to build soil health and nutrient retention was not successful until corn seed was treated with a seed-applied insecticide to prevent stand losses in cropping situations where SCM pressure was increased.  Given that conservation practices such as reduced tillage and planting cover crops to reduce erosion and runoff are not only encouraged but also incentivized in NY State, it is important to understand that in the absence of these seed protectants, farmers may revert to planting fewer cover crops to avoid losses to SCM.

We thank NY Farm Viability Institute, Cornell CALS and Cornell Agricultural Experiment Station for their research support for this ongoing study focused on identifying alternative management strategies for SCM.

Print Friendly, PDF & Email

Too Late to Sidedress Nitrogen? − Summary of 4 years of data

S. Sunoja, Quirine M. Ketteringsa, Joe Lawrenceb, and Greg Godwina

a
Nutrient Management Spear Program, Department of Animal Science, Cornell University, Ithaca, NY 14853, b PRODAIRY, Department of Animal Science, Cornell University, Ithaca, NY 14853

Introduction

Most land-grant university corn nitrogen (N) guidelines recommend the use of a small quantity of starter at planting followed by sidedressing when corn is at V6, when N requirements exceed appropriate starter rates. This approach aims to supply a small amount of N for the first weeks of growth after emergence when the plants need only a small amount of N, followed by application of a larger amount of readily available N at V6, prior to the start of the rapid growth curve of a corn plant. However, sometimes getting into the field in time for sidedressing at V6 can be challenge. Farmers and crop advisors have asked what to expect when sidedressing is delayed beyond V6. If equipment is available to apply N to already tall corn plants, would it still benefit the crop? The past four years, we conducted trials to determine what happens with corn yield and N use efficiency when sidedressing is delayed beyond V6.

Timing of N sidedress application and yield data

A sidedress experiment was conducted at the Musgrave Research Farm in Aurora, NY from 2017 through 2020. The soil type is classified as Lima silt loam with a pH of 7.8. Corn was planted on May 20 (2017), May 14 (2018), May 27 (2019), and May 21 (2020) at a rate of 31,000 to 35,000 seeds per acre. The seed varieties were Pioneer P0157 in 2017 and 2018, P9188AMXT in 2019, and P8989AM in 2020. Each year, starter N was applied at a rate of 30 lbs N per acre. The six treatments included zero N (NoN), N rich (NRich; 300 lbs N/acre at planting), and sidedress applications (180 lbs N per acre applied) at V4, V6, V8, and V10. Corn was harvest for grain each year. 

Results

Effect of timing of N sidedress application on yield

The NRich treatments yielded 202, 136, 170 and 161 bu per acre in 2017, 2018, 2019, and 2020, respectively, averaging 168 bu per acre across the four years. The large year to year differences reflected, among others, weather patterns; 2017 and 2019 received 10.4 and 9.9 inches of rainfall in May-June, while in 2018 and 2020 rainfall amounted to 6.0 and 5.5 inches, respectively.

Independent of the year of the experiment, the NoN treatment consistently produced the lowest yield. On average, across years, the NoN treatment averaged 45% of the yield obtained in the NRich treatments (Fig. 1). Not sidedressing reduced yield by, on average, 90 bu per acre, clearly indicating the need for additional N for this location.

Sidedressing at 180 lbs of N per acre at V4 and V6 resulted in yields that averaged 97% of the yield of the NRich treatment (Fig 1). Delaying sidedressing to V8 and V10 significantly reduced the yield (Fig. 1) to 95% (V8) and 87% (V10) of the yield that was obtained with the Nrich treatment and 96% (V8) and 89% (V10) of what was obtained with N application at V6. In general, yield declined the longer sidedressing was delayed beyond V6.

bar graphs depicting corn grain yield by year over 4 years
Figure 1. Corn grain yield as impacted by timing of sidedressing (NoN = starter only; Nrich = 300 lbs N per acre at planting; V4, V6, V8, and V10 = sidedressing of 180 lbs N per acre at the designated growth stage). The trials were conducted on continuous corn fields without a recent manure history at the Musgrave Research Farm in Aurora, NY). The values above each bar indicate the mean yield. Yield are not statistically different if followed by the same letter (a, b, etc.).

Nitrogen Uptake Efficiency

Sidedressing at 60% of the NRich rate can lead to the question: “Could yields have been higher for the sidedress treatments if more N had been applied?” The lack of a yield hit with early sidedress application compared to the Nrich treatment suggests the answer is no but we can also look at N balances for each of the treatments to investigate this. The ratio of N uptake to N supply (fertilizer N and soil N) shows that the crop took up about 70% of N supply when no N was applied beyond the starter (NoN treatment) and 44, 44, 42, and 39% for sidedressing at V4, V6, V8, and V10, respectively. The lowest uptake efficiency was for the NRich treatment (only 31%), signaling that (1) there was a considerably over-application of N in the NRich treatments each year, and (2) it was very unlikely that N supply limited yield at the various sidedress rates.

Bar charts depicting nitrogen sidedress treatments over the 4 years of the study
Figure 2. Nitrogen supply and uptake as impacted by timing of sidedressing (NoN = starter only; Nrich = 300 lbs N per acre at planting; V4, V6, V8, and V10 = sidedressing of 180 lbs N per acre at the designated growth stage). The trials were conducted on continuous corn fields without a recent manure history at the Musgrave Research Farm in Aurora, NY).

Conclusions and Implications

Sidedressing at V4 and V6 growth stages produced the same yield as obtained in the NRich treatment. Delaying the sidedress application to V8 and V10 resulted in reduced yield compared to what was obtained with sidedressing the same amount of N at V4 and V6. However, yields with sidedressing at V8 and V10 still produced significantly higher yields than obtained in the NoN treatment. The N balance evaluations showed that N use efficiency declined with sidedressing beyond V6, primarily due to the yield hit taken when sidedressing was delayed (and sidedress N was needed in the first place). Based on these results, we conclude that if additional N beyond a small starter is needed for optimal yield, it is recommended to sidedress earlier rather than later in the season.

Acknowledgements

Cornell, NMSP, and Pro-Dairy logosThis research was funded with federal formula funds. We thank the Paul Stachowski, farm manager of the Musgrave Research Farm at Aurora, NY, for help with field management. We also thank the many NMSP team members for help with harvest and sample processing over the years. For questions about these results, contact Quirine M. Ketterings at 607-255-3061 or qmk2@cornell.edu, and/or visit the Cornell Nutrient Management Spear Program website at: http://nmsp.cals.cornell.edu/.

Print Friendly, PDF & Email