Manure injection for corn silage in conservation till, strip till and no-till conditions

Martin L. Battagliaa, Quirine M. Ketteringsa, G. Godwina, Karl J. Czymmeka,b
a Nutrient Management Spear Program, b PRODAIRY, Department of Animal Science, Cornell University

Introduction

Conservation tillage practices and incorporation and injection of manure have increased in New York State over the last 20 years. In the future, it is expected that dairy farmers will need to make significant further progress toward no-till practices to minimize soil erosion losses and maximize soil health and carbon sequestration. Compared to surface application of manure, incorporation and injection can reduce ammonia volatilization, odor emissions and nutrient losses, particularly phosphorus (P), in water runoff. However, shallow incorporation of manure with an aerator tool or similar full-width tillage implements, while effective at retaining nitrogen (N) and P (Place et al., 2010), does not meet no-till practice standards as defined by USDA-NRCS. Injection of manure is only compatible with no-till and reduced tillage if low disturbance equipment is used. One central question is: are conservation tillage practices, including no-till planting and zone building, compatible with systems where manure is spring-injected in New York.

Field studies

manure injection systemTwo types of studies were conducted on dairy farm fields in western New York. The first study (2012-2013) evaluated the impact of zone tillage depth (0, 7 and 14 inches). This study was completed on one field in 2012 and two fields in 2013. An aerator was used for seedbed preparation. The second study (2014-2016) evaluated three intensities of conservation tillage, including no-tillage, reduced tillage (aerator without zone tillage), and intensified reduced tillage (aerator plus zone tillage at 7 inches depth). This study was conducted on two fields each year.

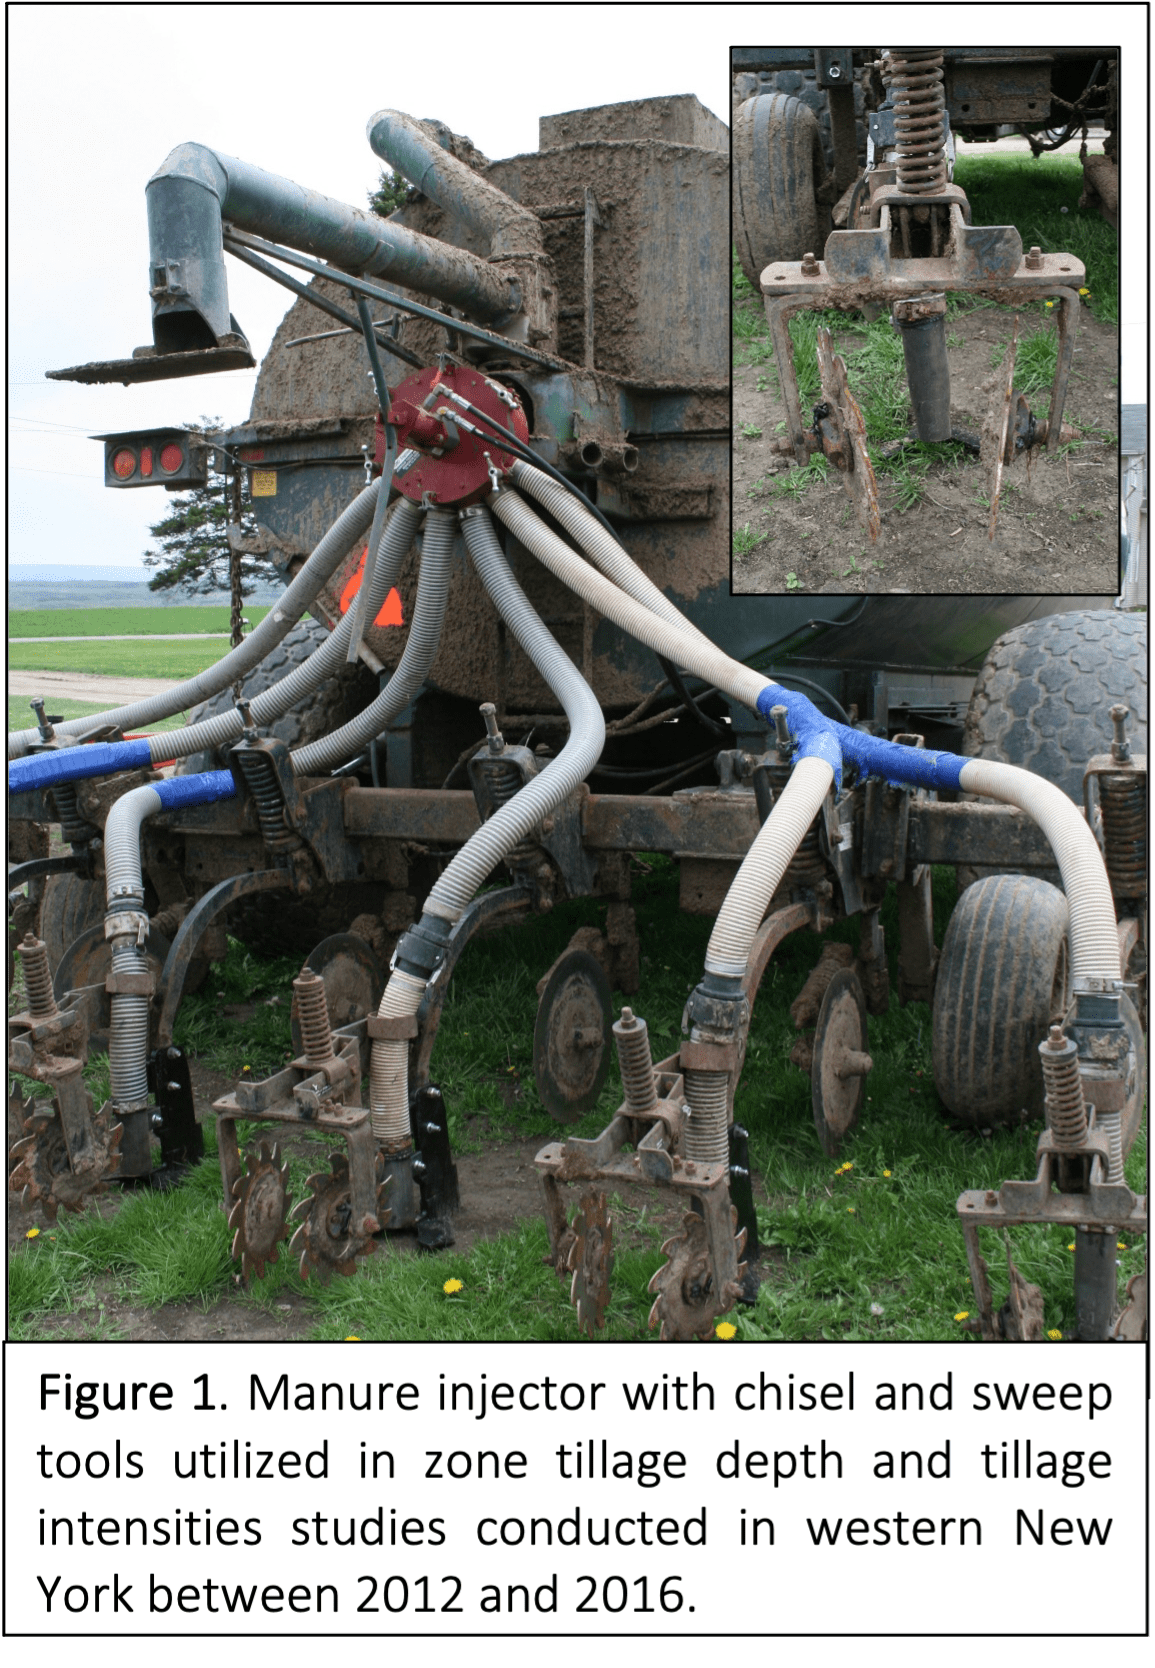
All fields had a zone tillage and a winter cereal cover cropping history of more than 10 years. Fields were in a dairy rotation of typically 3-4 yr corn alternated with 3-4 yr alfalfa/grass. Liquid manure was used as the primary source of soil fertility. It was injected (6-inch depth; 30 inches between injection bands) in March at a rate of about 13,000 gallons per acre (2012 through 2015) or 8,000 gallons per acre (2016) using a manure injector with chisel and sweep tools (Figure 1). Average total N content in manure ranged from 20 to 25 pounds of N per 1000 gallons. Manure P content ranged from 5 to 11 pounds of P2O5 per 1,000 gallons, while solids content varies from about 5 to 10%.

In both types of studies, zone tillage was performed in late April using an 8 row (30 inch) zone builder with subsoiler shanks and a 20-foot wide aeration tool set at a 15 degree angle pulled in tandem. Corn was planted at 15-inch corn row spacing at a rate between 34,000 and 35,000 seeds per acre between April 30 and May 13. No sidedressing of N was done given practical limitation of 15-inch corn row spacing. Each year, we measured early growth parameters (plant biomass, leaves per plant, stand density, and plant height at V5), and took soil samples at V5 that were analyzed for the pre-sidedress nitrate test (PSNT). At harvest we took corn stalks and analyzed them for the corn stalk nitrate test (CSNT), determined silage yield and dry matter content as well as forage quality parameters including crude protein (CP), acid detergent fiber (ADF), and neutral detergent fiber (NDF).

Results

Average plant density at V5 ranged between ~31,600 and 32,700 plants per acre (between 90 and 96% of the seeding rate). Reduced tillage and even omitting tillage altogether did not impact early corn silage stand density (Table 1).

In both types of studies, and for all fields, the PSNT-N exceeded 21 ppm NO3-N, indicating sufficient N from manure and soil organic matter mineralization. The PSNT results also indicate no impact of tillage practice or depth on mid-season N availability (Table 1).

Silage yield averaged about 25 tons per acre (at 35% dry matter) in the tillage depth study, with 7.8% CP. In the tillage intensity studies, yields averaged about 23 tons per acre with 7.3% CP. The results should not be compared between the two types of studies as trials were conducted on different fields and across different growing seasons. Tillage depth or intensity did not impact yield or CP content in either of the studies (Table 1).

The CSNT-N ranged between 3,235 and 3,589 ppm NO3-N in the zone tillage depth, and between 2,315 and 2,753 ppm NO3-N in the tillage intensity study, above the 2,000 ppm NO3-N optimum range. Zone tillage depth and different tillage intensities did not impact CSNT-N and both PSNT-N and CSNT-N show N was not limiting plant growth (Table 1).

Plant density and pre-sidedress nitrate test (PSNT) at V5, and corn stalk nitrate test (CSNT), silage yield [35% dry matter (DM)], crude protein (CP), and acid and neutral detergent fiber (ADF, NDF).

Conclusions and Implications

All types of tillage systems and depths performed equally well in terms of plant growth, N availability, corn silage yield and quality suggesting that reduced tillage and no-till can both be viable options to more intensive tillage for this farm. Results might be different for fields with limited history of zone building and other efforts to improve soil health. We conclude that at this farm that has made significant efforts to adopt soil health practices, manure injection followed by no-till planting or zone building can sustain yields and conserve N. No-till planting has the additional benefit that it reduces soil disturbance, risk of P runoff, as well as tillage-associated fuel, equipment, and labor costs.

Additional Resources

Full Citation

This article is summarized from our peer-reviewed publication: Battaglia, M.L., Ketterings, Q.M., Godwin, G., Czymmek, K.J. 2021. Conservation tillage is compatible with manure injection in corn silage system. Agronomy Journal. https://doi.org/10.1002/agj2.20604 (in press).

Acknowledgements

Cornell, NMSP, and Pro-Dairy logosIn memory of Willard DeGolyer, whose dedication to on-farm research inspired us all. This study was funded by the New York Farm Viability Institute (NYFVI), a USDA Conservation Innovation Grant (69-3A75-17-26), supplemented by federal formula funds. We thank the owners and the farm crew for their collaboratively work and dedication to the success of this research over the 5 years where the field studies were conducted. For questions about these results, contact Quirine M. Ketterings at 607-255-3061 or qmk2@cornell.edu, and/or visit the Cornell Nutrient Management Spear Program website at: http://nmsp.cals.cornell.edu/.

Print Friendly, PDF & Email

Interested in cover crop interseeding?

John Wallace, Weed Management Extension Specialist, Penn State University

In the coming year(s), Penn State will be leading a regional, SARE-funded project to better understand the agronomic, environmental, and economic challenges that prevent the adoption of cover crop interseeding in field corn. The team is comprised of Penn State and Cornell University researchers and extension educators, the New York State IPM program, and several cooperating Soil and Water Conservation Districts in PA and NY.

Interseeding cover crops early in the corn growing season (i.e., V4-V6) can potentially increase the benefits of cover cropping in growing regions that struggle to establish fall-sown cover crops. Previous studies and on-farm trials in our region have demonstrated the benefits of interseeding with specialized grain drills for improving establishment rates. Best management practices for early interseeding have also been developed for this region, including cover species selection and herbicide management.

cover crops between field cornHowever, there has been less documentation of conservation and soil health benefits associated with early interseeding compared to either winter fallow or post-harvest cover crop seeding. Understanding these benefits, and potential management tradeoffs, will help understand the return-on-investment of this practice. Finally, there is a general consensus that early cover crop interseeding works better in certain growing regions and production systems than others. Defining the geographic and agronomic fit for cover crop interseeding is one of our project objectives.

If you are interested in following the project, or participating in on-farm trials, please take a moment to complete this brief anonymous survey (link below). This information will help the project team prioritize on-farm trials and extension-outreach programming in the coming year(s).

PSU Cover Crop Interseeding Survey

Print Friendly, PDF & Email

Soybean Cyst Nematode: The Greatest Threat to NY Soybean Production is Here to Stay. Now What?

J. Cummings, K. Wise, and M. Zuefle, NYS Integrated Pest Management Program;
E. Smith, M. Hunter, M. Stanyard, A. Gabriel, K. Ganoe, J. Degni, J.L. Putman, K. O’Neil, J.A. Putman, J. Miller, and M. Lund; Cornell Cooperative Extension
M. Dorgan, NYS Department of Agriculture and Markets

The soybean cyst nematode (SCN) is the number one pest of concern in U.S. soybean crops, causing an estimated $1.5 billion in annual losses.  Considered a ‘silent’ yield-robber, SCN can cause 10-30% yield loss without any obvious, above-ground symptoms.  SCN hadn’t been considered a pest of concern for NY soybean growers before it was first confirmed in Cayuga County in 2016.  Even then, it wasn’t a priority consideration.  However, based on recent findings, NY soybean (and dry bean) growers can no longer afford to ignore this threat.

The NY State Integrated Pest Management Program, in collaboration with Cornell Cooperative Extension field crops specialists, and funded under a grant from USDA-APHIS Plant Protection Act section 7721 administered by NY State Department of Agriculture and Markets, coordinated a statewide SCN survey in 2019 as part of a soybean commodity survey to test 25 fields.  This testing revealed an additional six counties with fields positive for SCN.  Those results prompted a continuation and expansion of a SCN survey in 2020 with additional funding from the NY Soybean Checkoff dollars to provide testing for 100 fields statewide.  The 2020 survey identified an additional 22 counties with fields positive for SCN.  These surveys, along with shared observations from individual testing efforts have now confirmed SCN in a total of 30 counties across NYS, and it is safe to assume that SCN will likely be identified in all soybean producing counties in NYS with continued testing in future years.

NYS maps
Figure 1. The progression of confirmation of the soybean cyst nematode throughout NY State. Counties shaded in green had fields tested with negative results, and counties shaded in red have at least one field confirmed positive for soybean cyst nematode. (All testing was conducted by the SCN Diagnostics Laboratory at the University of Missouri in 2019 and 2020)

Now that we know that SCN is here, and is widespread across NYS, what’s next?  Unfortunately, eradication is not an option, but reduction and maintenance of low populations is.  Management strategies depend on SCN population levels, which can vary significantly from field to field.  Regular testing for this nematode will help you determine your best plan of action for management.  Fortunately, most of our positive SCN detections have been in the “low” category, but we found four fields with “moderate” levels and one field with “high” levels of SCN.  For reference, based on test results (according to University of Missouri SCN Diagnostics Laboratory), “An egg count of <500 eggs is considered low.  An egg count of 500-10,000 is considered moderate.  An egg count >10,000 is considered high”.  Those egg counts are based on what they find in one cup of soil.  Finding a field in NYS with an egg count of 20,000 was quite surprising this year, and it translated to measurable yield loss for the grower.  This means we can’t afford to ignore this pest, and we need to start actively managing SCN before our “low” results all become “high” results.

photos of soybesn cysts
Figure 2. Female SCN nematodes produce ‘cysts’ on soybean roots, which contain the eggs (a). These cysts, when dislodged from the roots, are distributed within the soil (b). The cysts contain approximately 200 eggs each (c). (Images courtesy of G. Yan, S. Markel and E. McGawley, via the SCN Coalition)

It’s much easier to stay ahead of this pest than to try to manage high numbers.  Fortunately, our number one management strategy is crop rotation. Once you know you have SCN in a field, the worst thing you can do is grow soybeans continuously. We are lucky to have a number of non-host crops available for rotation, including corn, small grains, clover, alfalfa, and forage grasses.  Studies have shown that a one-year rotation to corn may result in up to a 50% reduction in SCN populations the following year.  The next best option for managing SCN is by selecting and planting SCN-resistant soybean varieties, and rotating those varieties that you plant.  More on that later.  For dry beans, however, resistance is not an option, and rotation is even more critical.  The third management option is the use of nematode-protectant seed treatments.  There are a number of these products available, and most have shown promising results.  However, those seed treatments will be most cost-effective in situations where there is high SCN pressure.  So, for the vast majority of acreage in NY, based on our current survey results, the seed treatments can be an expensive option with limited benefits for many of our growers.  But, that may change as SCN testing expands and we find more moderately to highly infested fields.  Of course, an integrated pest management (IPM) approach will provide the best management results, by combining all available management tools.

It’s impossible to talk about SCN management without mentioning resistance.  I said previously that you should consider selecting and planting SCN-resistant varieties, and that you should rotate those varieties.  Unfortunately, SCN has been evolving and developing resistance to the traits most commonly available in commercial soybean varieties for decades.  Slowly, SCN has developed different races that can overcome the resistant soybean varieties.  This pest is highly adaptable.  That’s why it’s important not to plant the same soybean variety, even if it’s labeled as ‘resistant’, in the same field repeatedly.  Similar to chemical modes of action (like herbicides), it’s critical to rotate your tools to avoid, or minimize, resistance development.  For more information on this topic, please visit the SCN Coalition website, where they have an abundance of resources available on this topic.  Luckily, a number of major seed companies have soybean varieties in the pipeline with novel sources of SCN resistance, and we look forward to the new options.

soybean roots with cysts
Figure 3. SCN cysts are tiny, but can be seen on soybean roots with or without magnification. Much smaller than nodules, the cysts appear as whitish-yellow specks along the roots. (Images courtesy of G. Tylka via the SCN Coalition)

Moving forward, we hope to continue providing statewide SCN-testing services to growers through funded surveys.  Please contact your local Cornell Cooperative Extension specialist if you suspect you might have SCN on your farm.  Continued monitoring through testing will help us understand our populations of SCN, to help make the best management decisions.  Let’s work together to maintain mostly low to moderate populations of this potentially devastating pest.

Additional Resources and Related Articles:

Print Friendly, PDF & Email

2020 Corn Silage Overview

Joe Lawrence, Allison Kerwin – Cornell PRO-DAIRY

The growing season across much of the Northeast started out with below average temperatures. Despite the cool start, relatively dry conditions coupled with warmer temperatures as the month of May progressed provided generally good conditions for corn planting with all trial locations planted between May 5th and May 21st (Table 1). As the season progressed, all locations experienced below average precipitation and above average heat accumulation. Several locations were designated as abnormally dry to moderate drought throughout June and July; however, in most cases, the crop proved quite resilient and rainfall in mid-July was critical to generally successful pollination. It is worth noting that at several locations, seasonal rainfall totals were inflated by extreme rain events that generally pose greater risk (in terms of the potential for strong winds, runoff and other potential crop damage) than benefit to the crop.

It should also be recognized that some areas of the state experienced more severe drought conditions than these locations leading to more significant negative impacts on yield and forage quality. In these areas greater shifts in management strategies will be needed to make adjustments in feeding programs.

Table 1
Maturity Group Location Planting Date Harvest Date Seasonal GDD (86/50) Seasonal Rainfall (inches)
 

80 – 95 day RM

38 entries

Willsboro, NY

Albion, NY

Alburgh, VT

May 21

May 20

May 13

September 1

September 4

September 9

2073

2163

2099

10.54

12.63

15.47


96 – 110 day RM

52 entries

Madrid, NY

Aurora, NY

Alburgh, VT

May 5

May 13

May 14

September 15

August 31

September 21

2231

2144

2198

10.44

11.43

15.68

As 2020 corn silage sits in storage, hopefully fermenting for the next few months before being fed out, it is helpful to understand how this crop might feed compared to previous years. Using the trial results as an indicator of corn silage performance gives us an idea of average performance. Data for the detailed hybrid specific report of the trials is still being processed, but we do have enough information to look at overall performance trends.

Keep in mind this is an average of certain locations and your conditions may vary. On your own farm, it is helpful to take samples of your forage at harvest and again prior to feed out to understand the opportunities and challenges as you begin to feed this year’s crop. We also need to remember that while fresh samples can be a helpful indicator, some characteristics of the forage will change during fermentation, particularly starch digestibility.

As additional years of data are collected, patterns begin to form. As the 2020 season progressed, there were many similarities to the 2018 growing season (Figure 1a &1b). While total rainfall varied from 2018 at several locations, the rainfall totals are a bit misleading as the pattern and timing of this rainfall led to abnormally dry to drought conditions at all locations at different points in the season.

Fig. 1a
Fig. 1b

The influence of weather on key forage quality parameters, such as fiber digestibility, has been an area of focus in this work. As the season progressed, the similarities to 2018 suggested the potential for a highly digestible crop.  This projection was validated as the 2020 trial data shows a crop with high fiber digestibility as well as high starch levels (Figure 2a & Figure 2b).

Another way to look at these key parameters and to compare with previous years is to look at the sample spread across a range of values for these parameters. Table 2 and Figures 2a and 2b show the differences in undigested neutral detergent fiber after 240 hours of digestion (uNDF240) and starch content, respectively. The data in Figure 2 represents the last four growing seasons (2017 – 2020) with results combined from all locations (Albion, Willsboro, Aurora, Madrid and Alburgh) by year.

Fig. 2a
Fig. 2b

Each year brings its own challenges and opportunities. Given the variation in growing conditions across the region, it is critical to test your own forages to understand the site-specific impacts of the growing season.

It is important to evaluate this data in the context of your farm when selecting hybrids. The top performing hybrid at any one location or in any one category may not be a good fit for your feeding program. Factors that influence this vary by farm but include land base, soil resources, forage inventory, quality of available hay crops, access and cost of supplemental ingredients, and expectations of cow performance.

The trial results and location averages serve as a means to calibrate hybrid performance to a particular growing season. These averages can be used in conjunction with a company’s data on hybrids in their lineup, including hybrids not entered into these trials, to understand how a hybrid performed relative to what is realistic for a given growing season. For example, in Figure 2, we see that the highest percentage of samples have an uNDF240, %DM value in the 9-10% category and over 50% of samples having a starch content of 50% or greater. This can be used to evaluate how close or far away from these values other hybrids performed in 2020.

It is important to recognize the companies that make these trials possible through their entry of hybrids.  The following companies participated in the 2020 trials.

Albert Lea – Viking, Blue River Organic, Brevant, Channel, Dekalb, Growmark FS, Hubner, King Fisher (King’s Agri-seed), Local Seed Company, Masters Choice, Nutrien Ag Solutions – Dyna-Gro, Pioneer, Redtail (King’s Agri-seed), Schlessman (Gold Star Feed & Grain), Seed Consultants, Seedway, Syngenta – NK


Print Friendly, PDF & Email

Headlands often reduce overall field yield. Are they worth fixing?

S. Sunoja, Dilip Kharela, Tulsi Kharela, Jason Choa, Karl J. Czymmeka,b, Quirine M. Ketteringsa
aNutrient Management Spear Program, bPRODAIRY, Department of Animal Science, Cornell University

Introduction

Headland areas are defined as the outer edges of the field where farm equipment turns during field operations such as planting, sidedressing and harvest and where hedgerows or other physical features separate a field from adjacent fields or other land uses. The equipment traffic areas can be compacted which can cause considerable yield loss. Beyond compaction, yield loss in headland areas may also reflect edge-feeding of pests such as birds, rodents and deer, and competition for light, water, and nutrient resources with adjacent tree lines. Better decisions about headland management including investments to improve production potential, planting of other crops, or reductions in fertility or other crop inputs can be made when we know how much yield is given up on headlands. In the past several years, we have provided farm specific yield reports to farmers who have shared their corn silage and grain yield data with us.  The reports included yield by field with and without headland areas included.  Here we put all that information together, across farms, to evaluate how much corn grain and silage yield may be lost on headland areas across fields.

Corn Grain and Silage Yield Data

Corn yield data from 2648 fields representing ~49000 acres across 63 farms in New York were analyzed. This included 1281 corn grain fields and 1367 corn silage fields across two years (2017 & 2018). The yield data from each field were processed and cleaned using Yield Editor (free software from USDA-ARS) following the cleaning protocol developed by the Nutrient Management Spear Program at Cornell University (Kharel et al., 2020). Headland removal was performed in Yield Editor by manually selecting the outer edge passes and deleting the data points (Figure 1).

maps of headlands
Figure 1. Headland areas were removed using Yield Editor. Shown are (a) cleaned yield data including headland areas, (b) selected headland areas represented in black, and (c) yield in non-headland areas (i.e. after removal of headlands). Adapted from Sunoj et al. (2020).

Average field size ranged from 18.5 acres per field for grain and 19.3 acres per field for silage. Corn grain yields averaged 181 ± 33 bu/acre versus 22 ± 5 tons/acre for corn silage. We calculated optimal production, defined as production that could be obtained if the headland portion had yielded the same as the non-headland portion. We calculated production gain as the percentage increase between the actual and optimal production.

Results

Across all fields, the yield in the headland area was lower than the yield of the non-headland area (Figure 2A) for 94% of the grain fields and 91% of the silage fields. For some fields, the headland area yielded more than the non-headland area, possibly due to: (1) within-field features (e.g., trees, wet spots, alley ways), (2) irregular shapes of fields with short passes (as typically seen in New York agriculture), and (3) multiple directions of harvest within a field. The average yields were 188 bu/acre (non-headland area) and 161 bu/acre (headland areas) for corn grain. For silage, the average yields were 22.6 tons/acre (non-headland area) and 18.9 tons/acre (headland areas). Thus, headland yields were 14% (grain) and 16% (silage) lower than yields in the non-headland areas.

yield in scatter plot and bar graph
Figure 2. (A) Field scale yield in headland versus non-headland for corn grain and silage; and (B) distribution of production gain across all fields. Each circular marker in (A) represents a field. Adapted from Sunoj et al. (2020).

If the headlands yielded as much as the non-headland area, the production gain ranged from -8 to 32% for corn grain, and from -17 to 42% for corn silage (Figure 2B). The negative production gains reflected field that yielded more on the headland areas than the non-headland areas (points below the 1:1 line in Figure 2A). Averaging across all fields, the production gain amounted to about 4% for both corn grain and silage fields. However, 1% of the grain and silage fields had a potential production gain that exceeded 20%; 25% of the grain fields and 28% of the silage fields had gains between 5 and 20%, while for the rest of the fields (74% and 71%) potential yield gains were less than 5%. Production gains exceeding 20% were obtained on fields with the total field area was less than 25 acres, and with corn grain yields less than 143 bu/acre and silage yield less than 24 tons/acre. Such yield differences can, depending on the farm, reflect a considerable loss of yield and opportunity to improve total returns per cropland area.

Conclusions and Implications

Yield in headland areas was, on average, 14% (grain) and 16% (silage) lower than in the non-headland areas of the field. Taking into account the total percentage of a field in headland, at the field and farm levels, the potential yield gain amounted to 4%. The overall averages conceal the wide range of production gain values obtained in New York fields, from negative up to 32% for corn grain and up to 42% for some corn silage fields. Based on production gain for specific fields, farmers can either choose to ‘repair’ the headland with management (e.g., vertical tillage or subsoiling) to increase overall productivity and return on investment in seed and crop inputs, reduce crop inputs without further loss of yield in headlands, or ‘retire’ the headland from main crop farming and opt for perennial hay crop and conservation uses.

Additional Resources

Full Citation

This article is summarized from our peer-reviewed publication: Sunoj, S., D. Kharel, T.P. Kharel, J. Cho, K.J. Czymmek, and Q.M. Ketterings (2020). Impact of headland area on whole field and farm corn silage and grain yield. Agronomy Journal (in press). https://doi.org/10.1002/agj2.20489.

Acknowledgements

This research was funded with grants from the Northern New York Agricultural Development Program (NNYADP), New York State Corn Growers Association (NYSCGA), and federal formula funds. We thank the farmers and crop consultants for sharing whole-farm corn silage and grain yield data. For questions about these results, contact Quirine M. Ketterings at 607-255-3061 or qmk2@cornell.edu, and/or visit the Cornell Nutrient Management Spear Program website at: http://nmsp.cals.cornell.edu/.

Print Friendly, PDF & Email

Double-Cropping with Forage Sorghum and Forage Triticale in New York: Best Timing for Sorghum Harvest and Triticale Planting

Sarah E. Lyonsa*, Quirine M. Ketteringsa, Greg Godwina, Jerome H. Cherneyb, Debbie J. Cherneyc, John J. Meisingerd and Thomas F. Kilcere

aNutrient Management Spear Program, Department of Animal Science, Cornell University, Ithaca, NY, bSoil and Crop Sciences Section of the School of Integrative Plant Science, Cornell University, Ithaca, NY, cDepartment of Animal Science, Cornell University, Ithaca, NY, dUSDA-ARS Beltsville Agricultural Research Center, Beltsville, MD (retired), eAdvanced Agricultural Systems, LLC, Kinderhook, NY. *Current affiliation: Department of Crop and Soil Sciences, North Carolina State University, Raleigh, NC

Introduction

Double cropping with both warm- and cool-season forages in New York can have many benefits, including providing a source of forage yield in the spring potentially leading to greater total season yields than a monocrop system, increasing rotation diversity, and providing year-round soil cover. Winter cereals such as triticale are great options for double cropping in the northeast, as they overwinter and can produce high forage yields in the spring. Yet, depending on weather and growing season condition, a winter cereal crop harvested for forage can delay corn silage planting to mid-May or later. Sorghum is a potentially useful alternative to corn silage for double cropping rotations as sorghum can be planted later than corn. While it is possible to harvest forage sorghum earlier than the recommended soft dough growth stage without compromising yield (Lyons et al., 2019a), it was not known how sorghum harvest timing would impact total season yield of both forage crops in the rotation. Here we present the findings of a field trial to evaluate the impact of sorghum harvest timing on the combined yield of forage triticale and forage sorghum in a double cropping rotation.

Field Research

This double cropping study with forage sorghum (brachytic dwarf brown midrib variety ‘AF7102’) and forage triticale (‘Trical 815’) was conducted at the Musgrave Research Farm in Aurora, NY from October 2015 to June 2018. The study was initiated with triticale planting in mid-October, 2015. Each spring, the triticale received multiple rates of nitrogen (N) at dormancy break in mid- to late-April and was harvested in mid- to late-May at flag-leaf stage. Sorghum was planted between early and mid-June once the soil temperature stayed consistently above 60°F. Sorghum received either no N or 200 lbs N/acre at planting, and was harvested four times in the fall between early September and mid-October, approximately 2 weeks apart. Triticale was planted a day after sorghum harvest. Here we present the data from the plots that received 120 lbs N/acre for triticale and 200 lbs N/acre for sorghum, where N supply was not expected to limit yield of either crop.

Results

In 2016, sorghum yield was highest when harvested after mid-September (late-flower to early-milk growth stage or later), and the following triticale yield was highest when planted in mid-September (Figure 1). Because of the larger contribution that sorghum had, overall total season yield did not increase after the mid-September sorghum harvest and triticale planting date that year. In the second year of the study (fall 2017-spring 2018), sorghum yield was maximized at the last harvest date, and, as with the year before, triticale yielded highest when planted in mid-September. Total season yields were lower in the second year compared to the first year, most likely reflecting weather; fall 2016 was warmer and drier, while fall 2017 was cooler with higher rainfall. There were more growing degree days (GDDs) by mid-September 2016 than by the last harvest in mid-October 2017 (Figure 2).

yield bar chart
Figure 1. Total season yield for a double-crop rotation study with forage sorghum and triticale in central New York from 2016 to 2018. Triticale was planted the day after sorghum harvests in the fall. Triticale was harvested at the flag-leaf stage in May. Sorghum was fertilized with N at planting (200 lbs N/ac) and triticale was fertilized with N at dormancy break in the spring (120 lbs N/ac).
yield graph
Figure 2. Forage sorghum yield as related to growing degree days (GDDs) from 2016 to 2017. The GDDs were calculated by subtracting the lower threshold growing temperature for sorghum (10°C) from the average daily temperature (in °C). The average daily temperature was calculated by subtracting the minimum temperature from the maximum temperature and dividing by two: (Temperaturemax – Temperaturemin)/2. To convert from GDD in °C used here to GDD in °F, multiply by GDDs in °C by 1.8.

Conclusions and Implications

Forage double cropping can be both economically and environmentally beneficial in upstate New York. Sorghum, a crop well-adapted to warm and dry climates, planted in early or mid-June will likely reach maximum yields earlier in years with more GDD (by 1151 GDD in oC or 2072 GDD in oF in mid-September 2016 in this study) compared to years with fewer GDD (such as 2017 in this study). We recommend that sorghum grown in New York during warm, dry years can be harvested once ~1150 GDD (°C scale; 2070 GDD in oF scale) have accumulated. This can support both sorghum and triticale yields. If 1150 GDD have not accumulated by the soft-dough growth stage (cool, wet years), harvesting sorghum at soft dough is recommended to maximize total season yield.

Additional Resources

Full Citation

The information summarized here comes from a 2019 publication in the Agronomy Journal: Lyons, S.E., Q.M. Ketterings, G.S. Godwin, J.H. Cherney, D.J. Cherney, J.J. Meisinger, and T.F. Kilcer (2019). Double-cropping with forage sorghum and forage triticale in New York. Agronomy Journal 111:3374-3382. doi:10.2134/agronj2019.05.0386.

Acknowledgements

Cornell logo, NMSP logo, pro-dairy logoThis work was supported by Federal Formula Funds, and grants from the New York Farm Viability Institute (NYFVI) and Northeast Sustainable Agriculture Research and Education (NESARE). For questions about these results, contact Quirine M. Ketterings at 607-255-3061 or qmk2@cornell.edu, and/or visit the Cornell Nutrient Management Spear Program website at: http://nmsp.cals.cornell.edu/

Print Friendly, PDF & Email