Corn Grain Yield Estimation with Drones – Timing is Key!

Sunoj, S.1, J. Cho1, J. Guinness2, J. van Aardt3, K.J. Czymmek1,4, and Q.M. Ketterings1 

1Nutrient Management Spear Program, Department of Animal Science, 2Department of Statistics and Data Science, and 4PRODAIRY, Department of Animal Science, Cornell University, Ithaca, NY 14853; 3Chester F. Carlson Center for Imaging Science, Rochester Institute of Technology

Introduction

Yield maps can help farmers identify high and low yielding areas in a field and customize management practices to maximize return on investment. Currently, most yield monitor systems on choppers and combines record yield and GPS location at 1-second intervals. With properly calibrated systems, and once data generated by these systems are cleaned of errors, accurate yield maps can be generated. However, calibration and data cleaning are required as extra steps prior to yield mapping, while sensors are expensive and can break during harvest, without the opportunity to redo the data collection. Approaches to estimate yield that reduce the risk of data loss, are less time consuming, and can be used by a larger number of farmers therefore could be beneficial. Here we report on a study using drones (commonly called “unmanned aerial systems” or UAS) to estimate yield at the subfield level.

Timing of N sidedress and UAS flights

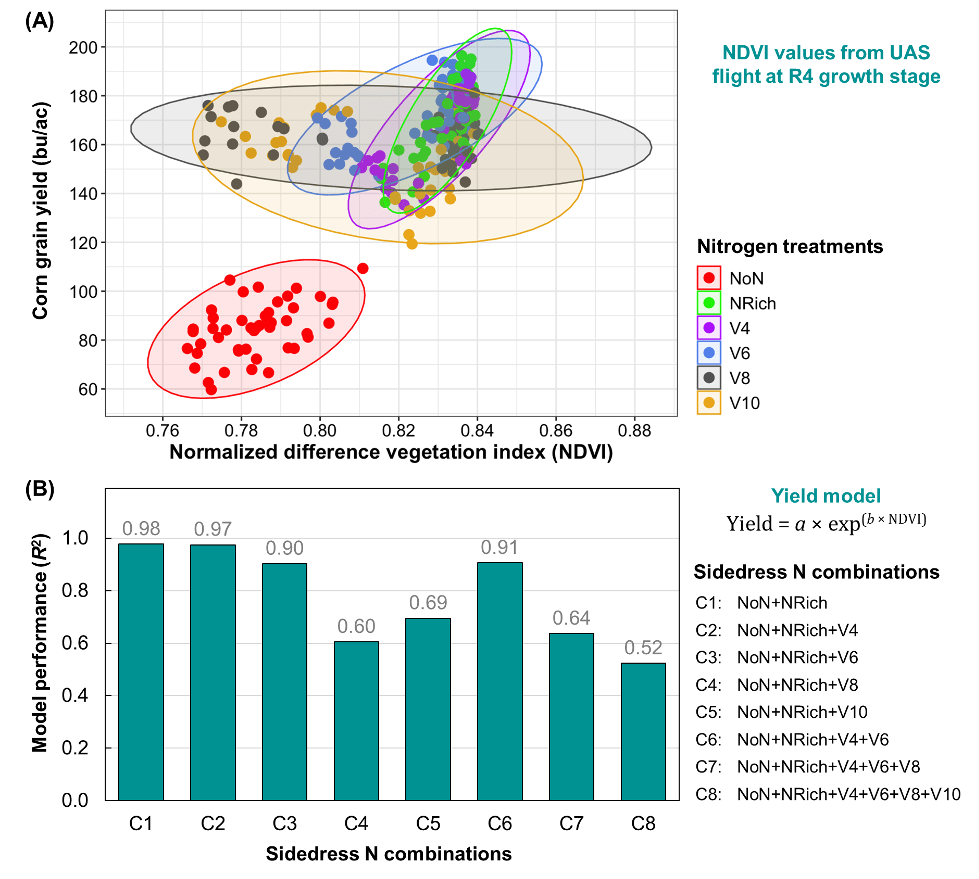
Sidedress N treatments – The experiment was conducted at the Musgrave Research Farm in Aurora, NY in 2019. All N treatments received starter N (30 lbs N per acre). Six N treatments were implemented including zero N (NoN – only starter), N rich (NRich; 300 lbs N per acre at planting), and sidedress applications (180 lbs N per acre applied) at V4, V6, V8, or V10.

UAS flights – Weekly UAS flights (total of 12 flights) were done between VE and R5 using the QuantixTM mapper from AeroVironment Inc. The UAS payload consists of two cameras, one for color imagery (red, green, and blue bands) and one with a near-infrared (NIR) band. The reflectance values were used for calculating “vegetation indices”, which typically are used to highlight specific vegetation features or conditions. Although six different vegetation indices were tested, we only report here on models derived using the normalized difference vegetation index (NDVI), which was best-suited for yield estimation. NDVI is a combination of the red and near-infrared bands.

Results

Did a Delay in Sidedressing Impact Yield?

All N treatments that received more than just starter N produced higher yields (Figure 1A), with NRich and sidedressing at V4 and V6 producing the highest yields (~170 bushels per acre) and the NoN treatment producing the lowest yields (85 bushels per acre). Delay in sidedressing to V8 and V10 resulted in lower yields. These results were consistent with N sidedress experiments across four years at the same location (Link).

Did Timing of Sidedressing Impact Yield Model Accuracy?

The timing of N sidedress application had not just an effect on yield, but also on NDVI reflectance when sensed at the R4 growth stage (Figure 1A). Earlier sidedress N application (up to V6) produced a narrow range of NDVI values, while delaying the N sidedress application produced more variable NDVI signals (e.g., V8 and V10 in Figure 1A).

The performance of yield estimation models (Figure 1B) showed that models that used data from plots that were sidedressed at or before V6 did well (R2 > 0.90), whereas inclusion of data from plots that were sidedressed at V8 or V10 were much less reliable (R2 < 0.68). These findings suggest that estimation of yield for fields that were sidedressed later than V6 are much less reliable, even with inclusion of NoN and NRich NDVI data.

scatter plot and bar graph depicting data points
Figure 1. (A) Relationship between corn grain yield (from yield monitor system) and NDVI reflectance (from UAS) for different nitrogen (N) treatments; and (B) Yield model performance for different combinations of sidedress N application. Note: NoN = starter only; NRich = 300 lbs N per acre at planting; V4, V6, V8, and V10 = sidedressing of 180 lbs N per acre at the respective growth stages. The values above each bar indicate the coefficient of determination (R2) for models fitted with NDVI and corn grain yield. The R2 values range between 0 and 1, with 1 being the best model. Models were derived from flights at the R4 growth stage.

Does Timing of Flight in the Season (Growth Stage) Impact Yield Model Accuracy?

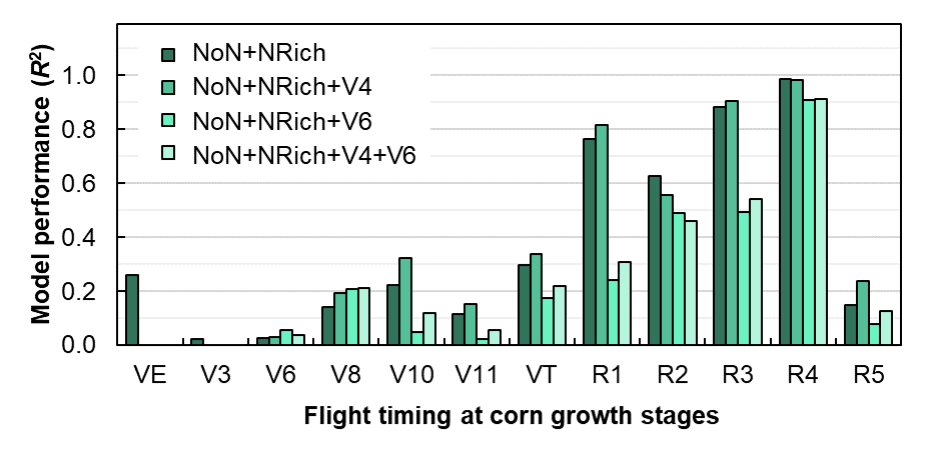
Flights at the R4 growth stage resulted in reliable models, as long as sidedressing took place at or before V6. But what about flying earlier in the season? Data shown in Figure 2 indicate a much lower estimation accuracy at all vegetative growth stages (up to VT) and after R4 (Figure 2). At R5 the canopy started to turn yellow and much of the reflectance signals were not reliable for yield estimation. The lower performance at R2 was attributed to cloudy conditions during the flight, highlighting one challenge with the use of passive sensors to capture NDVI. Our results suggest that flying on a sunny day, when corn is between R1 and R4, gives us the best yield estimation models.

bar chart of data points
Figure 2. Corn grain yield estimation performance of NDVI using the UAS images obtained throughout the growing season.
Conclusions and Implications

Yield estimation using drones is a promising approach provided we implement the following management strategies: (1) Avoid delay in sidedressing – Sidedressing after V6 not only reduced corn grain yield, but also produced variable NDVI values, resulting in poor estimations of corn grain yield; (2) Fly the drone between R1 and R4 – After R4, the canopy starts to turn yellow, which makes it unsuitable for yield estimation; and (3) Avoid cloudy days for flights – Flying on  cloudy days can impact the images collected and the accuracy of yield estimation models derived from the imagery. Ongoing research at the NMSP is exploring an approach of scaling this work to larger fields and developing yield estimation models that can be applied across farm fields and different farms.

Full Citation

This article is summarized from our peer-reviewed scientific publication: Sunoj, S., J. Cho, J. Guinness, J. van Aardt, K.J. Czymmek, and Q.M. Ketterings (2021). Corn Grain Yield Prediction and Mapping from Unmanned Aerial System (UAS) Multispectral Imagery. Remote Sensing, 13(19), 3948. https://doi.org/10.3390/rs13193948

Acknowledgements

This research was funded with federal formula funds. We thank Greg Godwin for flying the Quantix drone and Paul Stachowski, farm manager of the Musgrave Research Farm at Aurora, NY, for help with field management. We also thank the many NMSP team members for help with harvest and sample processing over the years. This research was funded in part with Federal Formula Funds and through grants from the New York Farm Viability Institute (NYFVI) and New York State Department of Environmental Conservation (NYDEC). J.G. received support from the National Science Foundation under grant No. 1916208. For questions about these results, contact Quirine M. Ketterings at 607-255-3061 or qmk2@cornell.edu, and/or visit the Cornell Nutrient Management Spear Program website at: http://nmsp.cals.cornell.edu/.

Print Friendly, PDF & Email

Are Persistent Biocontrol Nematodes (Entomopathogenic) for the control of Corn Rootworm an economic benefit for your NY farm?

Elson Shields and Tony Testa, Dept of Entomology, Cornell University, Ithaca, NY

Research in NY has shown that corn rootworm can be controlled for multiple growing seasons with a single application of native persistent biocontrol nematodes, known also as Entomopathogenic nematodes.  On NY farms with a good crop rotation between corn and other crops, research shows biocontrol nematodes can be used to replace the more costly GMO-rootworm traited corn.  On NY farms where GMO-rootworm traits are failing, the addition of biocontrol nematodes to the field as an additional management tool restores the yield to the pre-rootworm damage level and targets the resistant rootworm larvae who have survived the toxin in the plant but should not be used alone.  In fields which are long-term continuous corn, biocontrol nematodes should only be utilized with corn containing rootworm traits because these two different modes of mortality for rootworm reduces the long-term selection for resistance.

What are Biocontrol Nematodes?

Biocontrol nematodes are microscopic round worms in the soil which only attack insects in the soil or on the soil surface.  Biocontrol nematodes are different from the plant parasitic nematodes which attack crops.  The biocontrol nematodes discussed here are native to our Northern New York (NNY) soil where they were original collected.  The nematode insect infective stage (called the Infective Juvenile or IJ) moves about in the soil in search of insect hosts, finding the insect using CO2 gradients and other chemical attractants.  When an insect host is located, the IJ enters the insect through a breathing opening called a spiracle and enters the insect body cavity.  Once inside, the nematode releases a bacteria which kills the insect.  The nematodes then molt to adults and produce offspring on the nutrition provided by the dead insect.  When the insect resources are consumed, a new set of IJs are released into the soil to search for additional insect hosts.  An average sized insect larvae will produce between 100,000 and 200,000 new IJs.

What do these biocontrol nematodes attack?

This entire technology was developed to reduce snout beetle (ASB) populations to sub-economic levels in NNY.  ASB is costly to the dairy farmer, commonly killing alfalfa stands in a single year.  To date, more than 150 NNY farms have applied biocontrol nematodes to >25,000 acres to successfully reduce snout beetle to a sub-economic level and increase stand life back to 3-5 years.

Corn Rootworm:  During the research developing the use of native persistent biocontrol nematodes to reduce ASB populations in NNY to sub-economic levels, it was discovered that biocontrol nematodes applied in alfalfa for snout beetle control also carryover to attack corn rootworm when the field is rotated to corn.  Biocontrol nematodes completely compatible with all of the Bt-RW traits, killing the Bt toxin survivors,.  Research has shown that after 4 years of corn, the populations of biocontrol nematodes in the field are high enough to attack alfalfa soil insects when the field is rotated back to alfalfa.

Wireworm and White grubs:  Since NY alfalfa culture usually incorporates grass into the mix, NY fields usually have a population of wireworms and native white grubs in the field when the field is rotated to corn.  Often, these insects then cause stand problems in 1st year corn.  If the field has been inoculated with biocontrol nematodes for control of either snout beetle or rootworm, the biocontrol nematodes also attack these insects and reduce their impact on seedling corn when rotated to corn.

Does the soil type influence the species of biocontrol nematode applied?

NY research data indicates a mix of biocontrol nematode species gives better control of soil insects than a single species alone.  The reason for these results is each nematode species has a preferred section of the soil profile where it is most effective.  For example, Steinernema carpocapsae prefers the top 2-3” of the soil profile and dominates this region.  If S. carpocapsae is the only nematode used, insect larvae below the 2” level escape attack.  The addition of a second nematode species which prefers the low portions of the soil profile compliments the presence of S. carpocapsae and gives more complete control of soil insects throughout the plant root zone.  In sandier soils, the top 2” often become too dry for a biocontrol nematode to move and attack insect larvae.  In these soils, a nematode species mix which include S. carpocapsae would be ineffective and requires a different mix of nematode species.

Our recommendations for biocontrol nematode species mixes for soil types:

Clay loam – silt loam soils:  S. carpocapsae + S. feltiae

Sandy loams – sand soils:  S. feltiae + Heterorhabditis bacteriophora.

What are the differences between the entomopathogenic (biocontrol) nematodes purchased on the web from the Persistent NY strains mentioned here?

Biocontrol nematodes purchased from commercial sources have lost the ability to persist in the soil after application for a significant length of time.  Many commercial strains persist in the soil for only 7-30 days and require application timing to be closely match with the presence of their target host, requiring an annual reapplication.  In contrast, the NY persistent strains of Biocontrol Nematodes are carefully cultured to maintain their evolutionary ability to persist across hostile conditions such as the lack of available hosts and temperature extremes (dry soil conditions, winter).  Additionally, NY persistent strains are re-isolated from the field every two years so the nematode cultures do not become “Lab strains”, but remain adapted for NY agricultural soil conditions.  New York persistent strains are applied once and persist in the field for many years following application.  Not surprising because they were isolated from NY soils where they have evolved for a few million years.  If the NY persistent strains are cultured carelessly, they also quickly lose their ability to persist and are no better than the commercial strains purchased off the web.

How are biocontrol nematodes applied?

There are two major ways to apply biocontrol nematodes to NY fields.

Commercial Pesticide Sprayer:  Thousands of acres have been inoculated using slightly modified pesticide sprayers of all sizes from 30’ booms to 100+’ booms.  To use these sprayers, the following guidelines need to be followed.

    1.   A good washing of the sprayer (similar to changing pesticides)
    2.   All screens and filters removed (nematodes cannot pass through them)
    3.   Nozzle change to a stream type nozzle to shoot a concentrated stream of water to the soil surface through any vegetation.
    4.   50 gpa minimum
    5.   Application in the evening or under cloudy/rainy conditions (nematodes are sensitive to UV)

Liquid Dairy Manure:  This method was recently developed and offers some advantages over using a pesticide sprayer.  The biggest limitation is the time between adding the nematodes to the liquid manure and field application.  After adding the nematodes to the manure, the manure needs to be spread in the field within 20-30 minutes.  Longer intervals results in the nematodes dying from the lack of oxygen.

The advantages of using liquid dairy manure as the carrier are 1)  no extra trips over the field, 2)  can be applied any time of the day and 3)  no extra costs.

Application timing:

Biocontrol nematodes which are persistent, can be applied anytime during the growing season when soil temperatures are above 50 F.  Ideally, nematodes should be applied when there are host in the soil so they can immediately go to work and reproduce.  However, the NY persistent strains have the ability to sit and wait for months before needing to attack hosts and reproduce.  We request that no nematode applications be made after September 15th due to cooling soil temperatures and limited time to find hosts before winter.  Applications are made to the soil surface under conditions of low UV exposure (late in the day, rainy/overcast days, in cover crops where there is adequate ground shading).  Field tillage has no impact on biocontrol nematodes.  In addition, if nematodes are applied before field tillage, the movement of soil during tillage helps the nematodes redistribute throughout the field and help them fill in the gaps which may occur during application.

Where can I get Biocontrol Nematodes which are adapted to NY and will persist across growing seasons?

Currently, there are two sources to purchase biocontrol nematodes adapted to NY growing conditions with their persistent genes intact to persist across growing seasons (and winter) in NY.

    1.   Mary DeBeer, Moira, NY.  cell:  (518) 812-8565  email:  md12957@aol.com
    2.   Shields’ Lab, Cornell University:  Tony Testa  email:  at28@cornell.edu  cell: (607) 591-1493
Print Friendly, PDF & Email

Seed Corn Maggot, Stand Losses and the Need for Insecticide Seed Treatments

Elson J. Shields, Entomology, Cornell University, Ithaca, NY

Seed corn maggot, Delia platura, (SCM) is the primary NY pest attacking large-seeded crops during germination.  These crops include corn, soybean and edible beans.  One of the difficulties in managing this pest is the unpredictability of the infestations, the lack of an insecticide rescue option and the lack of flexibility to compensate for crop stand losses.

SCM adult flies, looking similar to small house flies, are attracted to fields with high organic matter within the plant zone, and lay their eggs close to germinating crop seeds.  The newly hatched larvae attack and feed on the germinating seeds and young emerging plants.  In NY, the frequent use of animal manures and cover crops known as green manure crops increases the attractiveness of the fields to SCM.  The short and cool NY growing season encourages growers to plant their crops as early as possible to be able to harvest profitable yields.  This early planting of seeds into cold soils results in slow and delayed emergence which increases the window of vulnerability to SCM damage.  In these situations, stand losses can exceed 50% due to the attractiveness of the organic matter, resulting in a high level of eggs being laid around the germinating seeds.

Under NY growing conditions, measurable yield losses in corn start to occur between 10-20% stand losses.  The magnitude of the yield loss is dependent on the corn variety, degree-day maturity requirements and the subsequent growing conditions which influence the ability of the undamaged plants to compensate for the damaged plants.  Due to the short growing season in NY, the decision to replant the field is seldom an option due to the additional expense of replanting (ca. $130/ac) and the yield reductions associated with shorter season corn variety required to be planted for maturity to be completed before killing temperatures in the fall. Typically, if the surviving corn stand has less than a 40% stand loss, the resulting yield loss is less costly than the combined cost of replanting and yield decline associated with late planting.

2021 Field Study in Aurora, NY

A study was initiated to examine the impact of SCM and the necessity of insecticide seed treatments on corn grown under continuous corn culture with minimal organic matter and corn following a green manure cover crop with high organic matter.

Experimental design:

The continuous corn site had been planted to corn for 7 years prior to the 2021 growing season.  Previous corn crops had been harvested as grain and soil tillage was restricted to spring chisel plowing.  Crop residue was minimal and planting in 2021 was achieved using a 4-row no-till planter.  The cover crop site was planted to red clover in 2020 and the clover crop was retained as a green manure crop.  Prior to planting the cover crop site to corn, the clover was mowed, liquid dairy manure was applied to the surface and the soil was chisel plowed to prepare the seed bed for planting.  Planting in 2021 utilized a 4-row no-till planter.  Each area was planted on a weekly basis yielding 6 different sequential planting dates.  Each row of the 4-row planter contained a different treatment and the plots for each planting date were comprised of a single planter pass in the continuous corn and two planter passes in the cover crop site.  The following treatments were planted as single rows within each planter pass.  1)  conventional corn (non-Bt-RW) with no seed applied insecticide, 2) conventional corn (non-Bt-RW) with seed applied insecticide, 3)  Bt-RW corn with no seed applied insecticide and 4)  Bt-RW corn with seed applied insecticide.  Each planting date was replicated four times at each location.  Data collected included stand counts after the plants were V3-4 growth stage and excavation of the missing plants to document the reason for the missing plant.

Results:

Continuous corn site:

At the continuous corn site, the experimental design allowed 24 planting pairs (corn type x presence/absence of seed applied insecticide) for comparison and analysis.  Fourteen of the 24 planting pairs (58%) suffered stand losses in the untreated seed row from seed corn maggot ranging from 2% to 66% stand loss.  If the 10% stand loss/yield loss threshold is used, then nine of the 24 planting pairs (38%) indicated economic yield losses in the non-seed applied insecticide treatments. If 14% stand loss/yield loss threshold is used, then eight of the 24 pairs (33%) indicated economic yield losses in the non-seed applied insecticide treatments.   If the 20% stand loss threshold is used, then six of 24 (25%) planting pairs indicate economic losses in the non-seed applied insecticide treatments.  Four of the planting pairs had greater than 40% stand losses in the non-seed applied insecticide treatments.

Corn following cover crop site:

In the corn following cover crop site, the experimental design allowed 24 planting pairs (corn type x presence/absence of seed applied insecticide) for comparison and analysis.  Sixteen of the 24 planting pairs (66%) suffered stand losses in the untreated seed row from seed corn maggot ranging from 2% to 62% stand loss.  If the 10% stand loss/yield loss threshold is used, then 13 of the 24 planting pairs (54%) indicated economic yield losses in the non-seed applied insecticide treatments.  If 14% stand loss/yield loss threshold is used, then nine of the 24 pairs (38%) indicated economic yield losses in the non-seed applied insecticide treatments.  If the 20% stand loss threshold is used, then seven of 24 (29%) planting pairs indicate economic losses in the non-seed applied insecticide treatments.  Five of the planting pairs had greater than 40% stand losses in the non-seed applied insecticide treatments.

Discussion:

The following values were estimated for 2021 from three different regions of NY.  These values were estimated by regional experts.

Region                          Silage value (in field)                 Representative Yield                 Value/ac

NNY:                                         $40/ton                                    17 tons/ac                            $680

CNY                                          $38/ton                                    20 tons/ac                            $760

WNY:                                        $47/ton                                      20 tons/ac                            $940

In all three regions, a one-ton silage loss per acre in yield equals eight-times the cost of the insecticide seed treatment.  A one-ton reduction in silage is approximately 5% loss in yield which equals a $40 loss per acre.  If we use the estimate that 1%-5% yield losses began at a 10% stand loss ($8-$40 in lost silage), then it is economically beneficial for the farmer to utilize an insecticide seed treatment costing $5 per acre to prevent the loss.

Continuous Corn:

Research data collected in controlled studies during 2021 at the Cornell Musgrave Farm located in Aurora, NY shows that in continuous corn production, seed corn maggot economically damaged 38% of the non-insecticide seed treated plots ranging from 10% to 66% stand losses.  If we estimate a 10% stand loss equals a 1-5% yield loss, then the value loss to the farmer is $8-$40/acre.

The cost to the farmer to protect his yield loss with insecticide seed treatment is $5/acre and therefore it is economically viable to spend $5 per acre to protect yield losses ranging from $8 to $400 per acre on 38% of a farm’s acreage.  If we estimate a 20% stand loss results in a greater than 5% yield loss, then 25% of the fields will suffer losses greater than $40 per acre.  These losses would be economically devastating to a farmer, where the farm loses yield on 38% of their acreage ranging from $40/ac to $400/ac.  Since predicting which fields will be attacked by seed corn maggot prior to planting is difficult and imprecise, the prevention of yield losses ranging from $40-$400/ac on 25% of the acreage easily compensates and is economically justified for the cost of the insecticide seed treatment for all acres.

Corn following a Cover Crop:

Research data collected in controlled studies during 2021 at the Cornell Musgrave Farm located in Aurora, NY shows that in corn production following a cover crop, seed corn maggot economically damaged 54% of the non-insecticide seed treated plots ranging from 11% to 62% stand losses.

If we estimate a 10% stand loss equals a 1-5% yield loss, then the value loss to the farmer is $8-$40/acre.  The cost to the farmer to protect his yield loss with insecticide seed treatment is $5/acre and therefore it is economically viable to spend $5 per acre to protect yield losses ranging from $8 to $400 per acre on 54% of a farm’s acreage.  If we estimate a 20% stand loss results in a greater than 5% yield loss, then 33% of the fields will suffer losses greater than $40 per acre.  These losses would be economically devastating to a farmer, where the farm loses yield on 54% of their acreage ranging from $40/ac to $400/ac.  Since predicting which fields will be attacked by seed corn maggot prior to planting is difficult and imprecise, the prevention of yield losses ranging from $40-$400/ac on 33% of the acreage easily compensates and is economically justified for the $5 per acre cost of the insecticide seed treatment for all acres.

Conclusions:

This 2021 research data indicates the level of potential economic losses by NY corn farmers if seed applied insecticide is not available for use.  In NY, replanting after stand losses from SCM is not a viable economic option in most situations due to the short NY growing season.  The farmer is required to suffer yield losses due to reduced stand because replanting is seldom a viable economic option.

These data documents the increased risk of economic stand losses from SCM when the farmer plants corn after a cover crop/green manure crop, which is utilized in soil building and nutrient retention over the winter months.  These data also indicate why the attempts to have farmers adopt cover crops in the 1990’s, were not successful due to SCM related stand losses in the corn crop planted following the cover crop.  Adoption of cover crops to build soil health and nutrient retention was not successful until corn seed was treated with a seed-applied insecticide to prevent stand losses in cropping situations where SCM pressure was increased.  Given that conservation practices such as reduced tillage and planting cover crops to reduce erosion and runoff are not only encouraged but also incentivized in NY State, it is important to understand that in the absence of these seed protectants, farmers may revert to planting fewer cover crops to avoid losses to SCM.

We thank NY Farm Viability Institute, Cornell CALS and Cornell Agricultural Experiment Station for their research support for this ongoing study focused on identifying alternative management strategies for SCM.

Print Friendly, PDF & Email

Managing Forage Digestibility to Combat High Commodity Prices

Joe Lawrence
Cornell PRO-DAIRY

Forage quality is important, it is hard to attend a meeting or read an agricultural publication without hearing this point and while there is a risk of becoming numb to the message, this spring presents yet another reminder of how critical this can be to controlling production cost on a dairy.

In a recent article (Higher Grain Prices and Lower Starch Diets) Rick Grant revisited the results of a past study at Miner Institute comparing diets with varying forage and fiber byproduct levels, the article can be found in the March 2021 Farm Report. Dr. Grant concluded the article by stating “This study showed us that we can feed higher forage diets when the forage contains highly digestible NDF. As we enter a period of higher grain and feed prices, we need to re-focus on the fact that cows can do very well on higher forage diets if the forage quality is high. And if fibrous byproducts happen to be priced competitively, we should be prepared to take advantage of their high fiber degradability.”

While striving for forage quality should always be the goal, the current price dynamics do offer an added incentive to optimize forage quality and specifically fiber digestibility entering 2021.

Hay Crops

Key factors in hay field management remain constant. As always it really boils down to optimizing yield and quality while securing the needed quantity of forage for different groups of animals on the farm. As each season presents ample chances to make low quality hay, the emphasis should be put on securing needed inventories of lactating quality feed before shifting the focus to obtaining lower quality inventory. Dynamic Harvest Schedules discusses ways to adjust management to achieve these goals.

The next step to assuring access to the right quality forage, at the right time, for the right group of animals is planning out forage storage as discussed in Strategic Forage Storage Planning.

Alfalfa and grass, or a mixture, are still the most common sources of hay crop on dairy farms and both have the potential to offer a very highly digestible feed source but understanding their differences is important to successful management.

There remains a tendency to focus in on Crude Protein (CP) when evaluating hay quality and while CP should not be completely ignored, there are better metrics for analysis. Fiber digestibility is a key area of focus and is certainly relevant in the context of higher commodity prices.

In a recent Hoards Dairyman article Dr. Dave Combs wrote, “Good forage is the combination of the right amount of fiber at the right amount of digestibility.” This is relevant to the grass and alfalfa discussion and research from Dr. Jerry Cherney at Cornell helps explain this.

In a study comparing the first cutting growth of grass and alfalfa in New York (NY), the Neutral Detergent Fiber (NDF) level of grass was found to be approximately 20 percent higher than alfalfa. However, when the NDF digestibility (NDFd) (on a percent of NDF basis) was measured, the grass NDFd levels averaged approximately 20 percent higher than alfalfa. In other words, grass has more total NDF but it is also more digestible. If this is understood it can be accounted for in proper ration development.

What the two crops did have in common was the rate of increase in NDF and corresponding rate of decline in NDFd as the crop matured.  The levels of both were relatively constant until around May 10th (Ithaca, NY) at which time NDF levels began a linear increase while NDFd began a linear decrease. Between May 10th and May 30th NDF increased by 20 to 25 percent while NDFd declined by 15 to 20 percent for both crops.

An article from the University of Wisconsin, Understanding NDF Digestibility of Forages, provides a good comparison of the NDFd potential of Alfalfa, Grass and Corn Silage. Relative to the other two, grass has the highest potential, however, it can also measure the lowest levels if mis-managed, a higher risk, higher potential reward scenario. In contrast, alfalfa has the lowest potential of the three at the high-end but does not drop as low as grass on the low-end.  Carrying this idea into mixed stands, Dr. Cherney has found that as little as 5% grass in a mixture can result in increases in NDFd that are meaningful to the cow and stands with approximately 30% grass optimize yield and quality.

The Cornell study exploring the springtime changes in fiber referenced above also helps shed light on why using CP as a quality indicator can be misleading with these crops. Crude Protein was tracked in the alfalfa and grass throughout the month and CP in both crops declined at a similar rate from May 10th to May 18th, from a starting point of 23 percent CP down to approximately 18 percent. At this point the lines diverged with the alfalfa CP value flattening out at approximately 18 percent and staying at this level through the end of May.  In contrast, the CP content of grass continued a linear decline at a rate of 0.45 percent per day which resulted in a final measurement of approximately 14 percent at the end of May.

If comparing CP alone, the late cut alfalfa (at 18 percent CP) would be considered superior to the late cut grass (at 14 percent CP); however, from a fiber standpoint they would both be problematic by this time. Understanding this relationship and adjusting harvest decisions accordingly can be especially impactful when trying to maximize forage utilization in the diet during times of high commodity prices.

Optimizing the harvest timing of first cutting can be managed by understand the stand composition (alfalfa vs. grass) and progress of the crop. This differs by year as spring conditions can vary significantly. More information can be found in the following article, Time To Check The Progress Of Your First Cutting. Several CCE Ag Teams around NY offer first cutting monitoring programs and send out weekly updates during the month of May, contact your local CCE Ag Team for more information.

Corn Silage

The 2020 growing season can be generalized by below average rainfall which challenged the corn crop in many areas; however, one benefit realized was the positive impact the drier weather had of corn silage fiber digestibility. When considering a number of potential influences on corn silage fiber, aside from unique traits like BMR, we know that rainfall tend to have one of the most significant impacts on digestibility. More information can be found in Corn silage forage quality: Hybrid genetics versus growing conditions.

With 2021 growing conditions still an unknown, it is difficult to know what the 2021 crop has in store for fiber digestibility or overall yield and quality performance. Although it is difficult to predict the growing season, our understanding of fiber digestibility can help us plan ahead and manage for the best outcomes when feeding the 2021 crop.

As discussed, in general higher levels of rainfall leads to lower levels of digestible fiber with perhaps the largest impact related to rainfall just before corn tasseling. With this information, by August we should have a relatively good idea as to whether fiber digestibility is going to trend higher (like 2020) or lower (like 2017) as demonstrated in the data from the NY VT Corn Silage Hybrid Evaluation Program annual overview.

This could help planning in two ways. First, it may influence harvest decisions, specifically chop height. Penn State summarized a number of chopping height studies and found that on-average NDFd increases by 2.5 percent for each six inches the cutting height is increased. In a situation where the 2021 growing season results in a high yielding crop but there are concerns of below average fiber digestibility, increasing corn silage cutting height may be a worthwhile consideration. Conversely, if 2021 is similar to 2020, with limited rainfall, securing adequate forage inventory may be of more concern. Understanding that this will likely be offset by higher overall digestibility in the crop suggest a lower harvest height could be worth considering.

Second, having some level of confidence in whether fiber digestibility will be above or below average prior to harvest will provide a glimpse into what diet adjustments may be needed when switching to the new corn silage crop.

An inherent challenge of a dry year is that while digestibility is often higher, overall yield is often lower. This creates a scenario where cows are likely to consume more of the forage, particularly if striving for a high forage diet to combat high commodity prices, while inventories may be stressed.  Planning ahead and using this information may aid in decision making regarding how many acres on the farm are harvested for silage versus grain or if purchasing additional corn silage (standing in the field or post-harvest) is warranted.

Although this article has focused on high forage diets to combat higher commodity cost, this information can also help in planning for what commodities may be needed in the new diet. Regardless of price trends this opens the door to watch markets for relative deals on these inputs throughout the late summer and early fall to lock in favorable prices for the period this silage will need to be fed.

References

    • Considerations in Managing Cutting Height of Corn Silage, Penn State
    • Corn silage forage quality: Hybrid genetics versus growing conditions, Cornell University
    • Dynamic Harvest Schedules, Cornell PRO-DAIRY
    • Higher Grain Prices and Lower Starch Diets, Miner Institute Farm Report, March 2021
    • NY VT Corn Silage Hybrid Evaluation Program annual overview, Cornell University
    • Strategic Forage Storage Planning, Cornell PRO-DAIRY
    • Time To Check The Progress Of Your First Cutting, Cornell PRO-DAIRY
    • Understanding NDF Digestibility of Forages, University of Wisconsin


Print Friendly, PDF & Email

Stalk Nitrate Test Results for New York Corn Fields from 2010 through 2020

Quirine Ketterings1, Sanjay Gami1, Greg Godwin1, Karl Czymmek1,2, and Mike Reuter3
Cornell University Nutrient Management Spear Program1, PRO-DAIRY2, and Dairy One3

Introduction

The corn stalk nitrate test (CSNT) is an end-of-season evaluation tool for N management for corn fields in the 2nd year or more that allows for identification of situations where more N was available during the growing season than the crop needed. Research shows that the crop had more N than needed when CSNT results exceed 2000 pm. Results can vary from year to year but where CSNT values exceed 3000 ppm for two or more years, it is highly likely that N management changes can be made without impacting yield.

Findings 2010-2020

In 2020, 48% of all tested fields had CSNT-N greater than 2000 ppm, while 34% were over 3000 ppm and 19% exceeded 5000 ppm (Table 1). In contrast, 17% of the 2020 samples were low in CSNT-N. The percentage of samples testing excessive in CSNT-N was most correlated with the precipitation in May-June with droughts in those months translating to a greater percentage of fields testing excessive. Because crop and manure management history, soil type and growing conditions all impact CSNT results, conclusions about future N management should take into account the events of the growing season. This includes weed and disease pressure, lack of moisture in the root zone in drought years, lack of oxygen in the root zone due to excessive rain in wet years, and any other stress factor that can impact crop growth and N status.

Distribution of corn stalk nitrate test results (low, marginal, excess) for New York (NY) corn fields sampled in 2010-2020Note: Data prior to 2013 reflect corn stalk nitrate test submissions to NMSP only; 2013, 2014, and 2017-2020 data include results from NMSP and Dairy One; 2015-2016 includes samples from NMSP, Dairy One, and CNAL. Yield data are from the USDA – National Agricultural Statistics Service. Rainfall data were from CLIMOD 2 obtained from the Northeast Regional Climate Center.

Within-field spatial variability can be considerable in New York, requiring (1) high density sampling (equivalent of 1 stalk per acre at a minimum) for accurate assessment of whole fields, or (2) targeted sampling based on yield zones, elevations, or soil management units. The 2018 expansion of adaptive management options for nutrient management now includes targeted CSNT sampling as a result of findings that targeted sampling generates more meaningful information while reducing the time and labor investment into sampling. Two years of CSNT data are recommended before making any management changes unless CSNT’s exceed 5000 ppm, in which case one year of data is sufficient.

Graphs of CNST values over the study years
Figure 1: In drought years more samples test excessive in CSNT-N while fewer test low or marginal. The last 11 years include four drought years (2012, 2016, 2018, and 2020), three wet years (2011, 2013, and 2017), and four years labelled normal (2010, 2014, 2015, 2019) determined by May-June rainfall (less than 7.5 inches in drought years, 10 or more inches in wet years).

Relevant References

Acknowledgments

Cornell, NMSP, Pro-Dairy logosWe thank the many farmers and farm consultants that sampled their fields for CSNT. For questions about these results contact Quirine M. Ketterings at 607-255-3061 or qmk2@cornell.edu, and/or visit the Cornell Nutrient Management Spear Program website at: http://nmsp.cals.cornell.edu/.

Print Friendly, PDF & Email

Manure injection for corn silage in conservation till, strip till and no-till conditions

Martin L. Battagliaa, Quirine M. Ketteringsa, G. Godwina, Karl J. Czymmeka,b
a Nutrient Management Spear Program, b PRODAIRY, Department of Animal Science, Cornell University

Introduction

Conservation tillage practices and incorporation and injection of manure have increased in New York State over the last 20 years. In the future, it is expected that dairy farmers will need to make significant further progress toward no-till practices to minimize soil erosion losses and maximize soil health and carbon sequestration. Compared to surface application of manure, incorporation and injection can reduce ammonia volatilization, odor emissions and nutrient losses, particularly phosphorus (P), in water runoff. However, shallow incorporation of manure with an aerator tool or similar full-width tillage implements, while effective at retaining nitrogen (N) and P (Place et al., 2010), does not meet no-till practice standards as defined by USDA-NRCS. Injection of manure is only compatible with no-till and reduced tillage if low disturbance equipment is used. One central question is: are conservation tillage practices, including no-till planting and zone building, compatible with systems where manure is spring-injected in New York.

Field studies

manure injection systemTwo types of studies were conducted on dairy farm fields in western New York. The first study (2012-2013) evaluated the impact of zone tillage depth (0, 7 and 14 inches). This study was completed on one field in 2012 and two fields in 2013. An aerator was used for seedbed preparation. The second study (2014-2016) evaluated three intensities of conservation tillage, including no-tillage, reduced tillage (aerator without zone tillage), and intensified reduced tillage (aerator plus zone tillage at 7 inches depth). This study was conducted on two fields each year.

All fields had a zone tillage and a winter cereal cover cropping history of more than 10 years. Fields were in a dairy rotation of typically 3-4 yr corn alternated with 3-4 yr alfalfa/grass. Liquid manure was used as the primary source of soil fertility. It was injected (6-inch depth; 30 inches between injection bands) in March at a rate of about 13,000 gallons per acre (2012 through 2015) or 8,000 gallons per acre (2016) using a manure injector with chisel and sweep tools (Figure 1). Average total N content in manure ranged from 20 to 25 pounds of N per 1000 gallons. Manure P content ranged from 5 to 11 pounds of P2O5 per 1,000 gallons, while solids content varies from about 5 to 10%.

In both types of studies, zone tillage was performed in late April using an 8 row (30 inch) zone builder with subsoiler shanks and a 20-foot wide aeration tool set at a 15 degree angle pulled in tandem. Corn was planted at 15-inch corn row spacing at a rate between 34,000 and 35,000 seeds per acre between April 30 and May 13. No sidedressing of N was done given practical limitation of 15-inch corn row spacing. Each year, we measured early growth parameters (plant biomass, leaves per plant, stand density, and plant height at V5), and took soil samples at V5 that were analyzed for the pre-sidedress nitrate test (PSNT). At harvest we took corn stalks and analyzed them for the corn stalk nitrate test (CSNT), determined silage yield and dry matter content as well as forage quality parameters including crude protein (CP), acid detergent fiber (ADF), and neutral detergent fiber (NDF).

Results

Average plant density at V5 ranged between ~31,600 and 32,700 plants per acre (between 90 and 96% of the seeding rate). Reduced tillage and even omitting tillage altogether did not impact early corn silage stand density (Table 1).

In both types of studies, and for all fields, the PSNT-N exceeded 21 ppm NO3-N, indicating sufficient N from manure and soil organic matter mineralization. The PSNT results also indicate no impact of tillage practice or depth on mid-season N availability (Table 1).

Silage yield averaged about 25 tons per acre (at 35% dry matter) in the tillage depth study, with 7.8% CP. In the tillage intensity studies, yields averaged about 23 tons per acre with 7.3% CP. The results should not be compared between the two types of studies as trials were conducted on different fields and across different growing seasons. Tillage depth or intensity did not impact yield or CP content in either of the studies (Table 1).

The CSNT-N ranged between 3,235 and 3,589 ppm NO3-N in the zone tillage depth, and between 2,315 and 2,753 ppm NO3-N in the tillage intensity study, above the 2,000 ppm NO3-N optimum range. Zone tillage depth and different tillage intensities did not impact CSNT-N and both PSNT-N and CSNT-N show N was not limiting plant growth (Table 1).

Plant density and pre-sidedress nitrate test (PSNT) at V5, and corn stalk nitrate test (CSNT), silage yield [35% dry matter (DM)], crude protein (CP), and acid and neutral detergent fiber (ADF, NDF).

Conclusions and Implications

All types of tillage systems and depths performed equally well in terms of plant growth, N availability, corn silage yield and quality suggesting that reduced tillage and no-till can both be viable options to more intensive tillage for this farm. Results might be different for fields with limited history of zone building and other efforts to improve soil health. We conclude that at this farm that has made significant efforts to adopt soil health practices, manure injection followed by no-till planting or zone building can sustain yields and conserve N. No-till planting has the additional benefit that it reduces soil disturbance, risk of P runoff, as well as tillage-associated fuel, equipment, and labor costs.

Additional Resources

Full Citation

This article is summarized from our peer-reviewed publication: Battaglia, M.L., Ketterings, Q.M., Godwin, G., Czymmek, K.J. 2021. Conservation tillage is compatible with manure injection in corn silage system. Agronomy Journal. https://doi.org/10.1002/agj2.20604 (in press).

Acknowledgements

Cornell, NMSP, and Pro-Dairy logosIn memory of Willard DeGolyer, whose dedication to on-farm research inspired us all. This study was funded by the New York Farm Viability Institute (NYFVI), a USDA Conservation Innovation Grant (69-3A75-17-26), supplemented by federal formula funds. We thank the owners and the farm crew for their collaboratively work and dedication to the success of this research over the 5 years where the field studies were conducted. For questions about these results, contact Quirine M. Ketterings at 607-255-3061 or qmk2@cornell.edu, and/or visit the Cornell Nutrient Management Spear Program website at: http://nmsp.cals.cornell.edu/.

Print Friendly, PDF & Email