Homegrown Feed for Dairy Farms in New York

Olivia Godber1, Mart Ros1, Agustin Olivo1, Kristan Reed2, Mike van Amburgh2, Kirsten Workman1,3, and Quirine Ketterings1

1Nutrient Management Spear Program, 2Department of Animal Science, 3PRODAIRY, Cornell University, Ithaca, NY 14853

Introduction

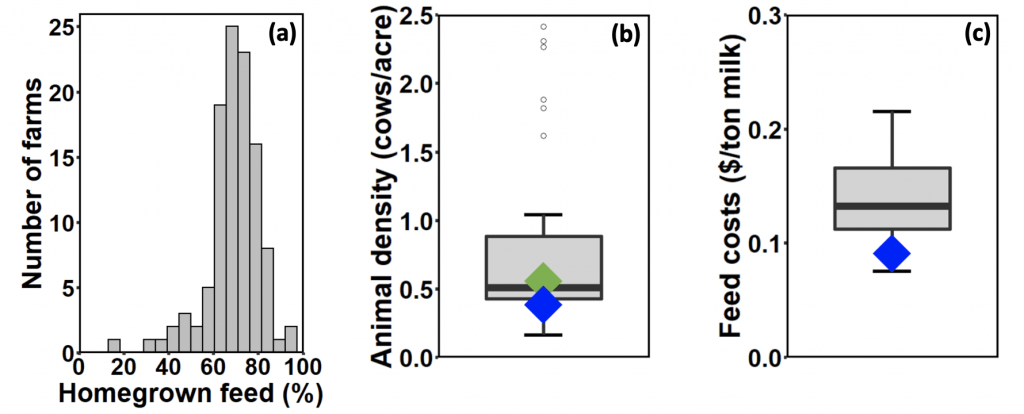
Between 2017 and 2019, 110 New York dairy farms completed their whole farm nutrient mass balance assessment. Of the feed fed to the animals on the farms, almost 70% was homegrown, which means it was produced on the land-base operated by the farm itself (Figure 1a). Almost all this homegrown feed was forages such as corn silage, alfalfa, and grass. The farms averaged 0.56 mature cows per acre (weighted by tillable acres). How does this compare to average values in the United States and why is this important?

Comparison with Dairies in New York and Nationally

The share of homegrown feed for the New York farms was considerably high than typically reported across the US. The number of mature cows per acre was higher across the US (Figure 1b), while farmers in the assessment spent considerably less on feed costs per unit of milk produced than reported for the US (Figure 1c).

graphical representation of study results
Figure 1: (a) The share of homegrown feed on New York dairy farms participating in the 2017-2019 nutrient mass balance assessment (histogram); (b) the average number of mature cows per acre of cropland on dairy farms in the US (boxplot) and on New York dairy farms (blue diamond) according to the 2017 USDA Census of Agriculture, and the average number of mature cows per tillable acre for New York dairy farms participating in the 2017-2019 nutrient mass balances (green diamond); (c) the average amount spent on purchased feed per ton of milk sold for US dairy farms (boxplot) and New York dairy farms (blue diamond) according to the 2017 USDA Census of Agriculture.

Importance of Optimizing Homegrown Forage Production

The more feed that is homegrown, the greater the opportunity for the farm to: •	Reduce feed imports and fluctuation in associated costs; •	Control and adjust for changes in forage quality; •	Reduce the need for synthetic fertilizer by enhancing nutrient recycling on the farm through manure application to the land base; •	Maintain/improve soil test phosphorus levels; •	Improve soil health, crop production and climate resiliency with use of manure;  •	Enhance carbon sequestration; •	Avoid costs associated with manure export off the farm; •	Reduce greenhouse gas emissions associated with fertilizer production and transport of feed; •	Implement practices that promote biodiversity on the farm-base through crop rotation and management.
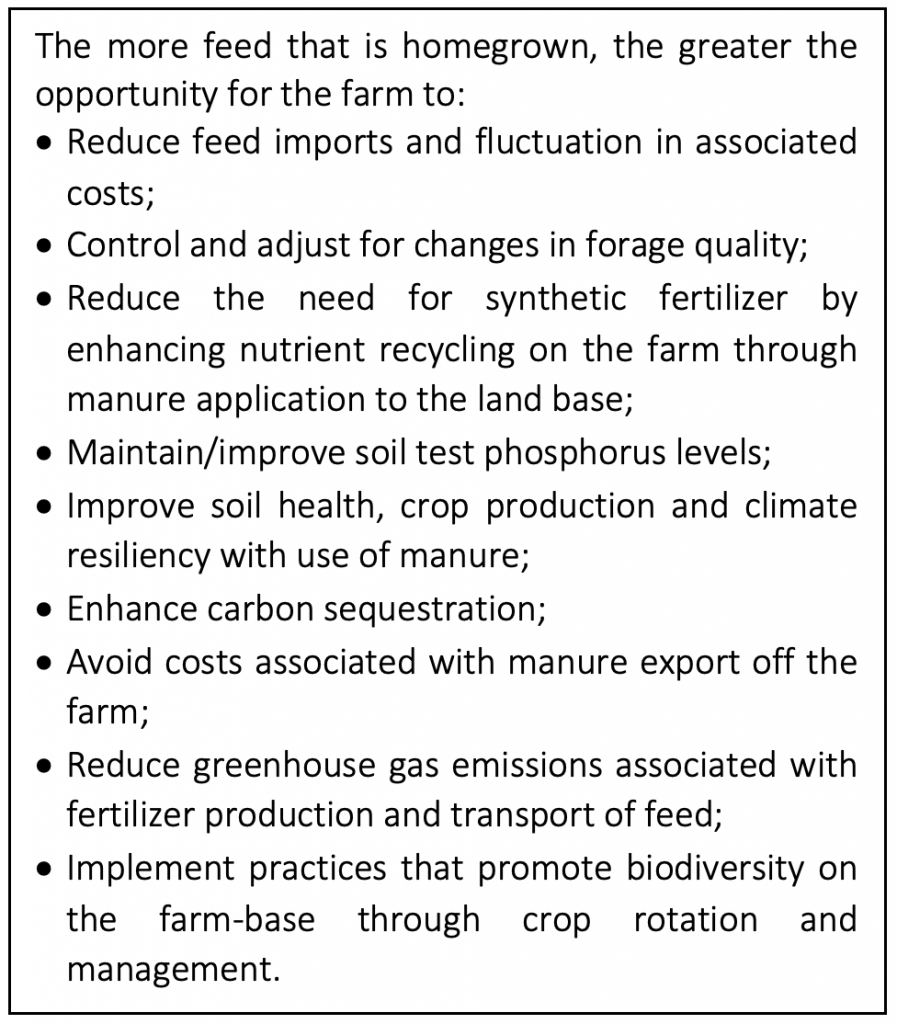
For most dairy farms, feed purchases are the largest annual expense, so growing forages on the farm’s land base reduces the costs of feed. However, there are also other reasons why optimizing homegrown feed is key.

    • Reducing the amount of feed that needs to be imported helps to avoid the carbon and energy footprint that imported feeds have (production elsewhere plus transport to the farm).
    • By minimizing feed imports, farms are also minimizing the risk of feed price fluctuations and economic uncertainty.
    • Farmers that grow feed have greater control over the quality of that feed. They can select what crops are needed and in which quantities to meet the needs of their animals.
    • Farmers can, to a certain extent, alter crop management practices as needed, and optimize nutrient use, thereby reducing nutrient losses to the environment.
    • By increasing nutrient recycling with the use of manure on the farm itself, farms are reducing their reliance on fertilizer use. This results in a smaller environmental footprint for feed production. Optimizing the use of manure over synthetic fertilizer can also help with managing volatile fertilizer prices and with the farm’s overall economic sustainability.
    • Farms with insufficient land base will need to export manure. By optimizing feed production and animal density, a farm can reap the benefits of using manure, thereby avoiding extra expenses incurred with manure export (if feasible at all) and avoiding carbon emissions associated with the transport of manure beyond the farm boundaries.

Acknowledgements

We thank the farmers, farm advisors and past and current NMSP team members who worked on the whole farm NMB project with us over the past 15+ years. This research is funded primarily by a gift from Chobani, in addition to Federal Formula Funds, and grants from the Northern New York Agriculture Development Program (NNYADP), Northeast Region Sustainable Agriculture and Education (NESARE), New York State Department of Environmental Conservation (NYDEC). For questions, contact Quirine M. Ketterings (qmk2@cornell.edu) or visit the Cornell Nutrient Management Spear Program website at: http://nmsp.cals.cornell.edu/.

Print Friendly, PDF & Email

Too Late to Sidedress Nitrogen? − Summary of 4 years of data

S. Sunoja, Quirine M. Ketteringsa, Joe Lawrenceb, and Greg Godwina

a
Nutrient Management Spear Program, Department of Animal Science, Cornell University, Ithaca, NY 14853, b PRODAIRY, Department of Animal Science, Cornell University, Ithaca, NY 14853

Introduction

Most land-grant university corn nitrogen (N) guidelines recommend the use of a small quantity of starter at planting followed by sidedressing when corn is at V6, when N requirements exceed appropriate starter rates. This approach aims to supply a small amount of N for the first weeks of growth after emergence when the plants need only a small amount of N, followed by application of a larger amount of readily available N at V6, prior to the start of the rapid growth curve of a corn plant. However, sometimes getting into the field in time for sidedressing at V6 can be challenge. Farmers and crop advisors have asked what to expect when sidedressing is delayed beyond V6. If equipment is available to apply N to already tall corn plants, would it still benefit the crop? The past four years, we conducted trials to determine what happens with corn yield and N use efficiency when sidedressing is delayed beyond V6.

Timing of N sidedress application and yield data

A sidedress experiment was conducted at the Musgrave Research Farm in Aurora, NY from 2017 through 2020. The soil type is classified as Lima silt loam with a pH of 7.8. Corn was planted on May 20 (2017), May 14 (2018), May 27 (2019), and May 21 (2020) at a rate of 31,000 to 35,000 seeds per acre. The seed varieties were Pioneer P0157 in 2017 and 2018, P9188AMXT in 2019, and P8989AM in 2020. Each year, starter N was applied at a rate of 30 lbs N per acre. The six treatments included zero N (NoN), N rich (NRich; 300 lbs N/acre at planting), and sidedress applications (180 lbs N per acre applied) at V4, V6, V8, and V10. Corn was harvest for grain each year. 

Results

Effect of timing of N sidedress application on yield

The NRich treatments yielded 202, 136, 170 and 161 bu per acre in 2017, 2018, 2019, and 2020, respectively, averaging 168 bu per acre across the four years. The large year to year differences reflected, among others, weather patterns; 2017 and 2019 received 10.4 and 9.9 inches of rainfall in May-June, while in 2018 and 2020 rainfall amounted to 6.0 and 5.5 inches, respectively.

Independent of the year of the experiment, the NoN treatment consistently produced the lowest yield. On average, across years, the NoN treatment averaged 45% of the yield obtained in the NRich treatments (Fig. 1). Not sidedressing reduced yield by, on average, 90 bu per acre, clearly indicating the need for additional N for this location.

Sidedressing at 180 lbs of N per acre at V4 and V6 resulted in yields that averaged 97% of the yield of the NRich treatment (Fig 1). Delaying sidedressing to V8 and V10 significantly reduced the yield (Fig. 1) to 95% (V8) and 87% (V10) of the yield that was obtained with the Nrich treatment and 96% (V8) and 89% (V10) of what was obtained with N application at V6. In general, yield declined the longer sidedressing was delayed beyond V6.

bar graphs depicting corn grain yield by year over 4 years
Figure 1. Corn grain yield as impacted by timing of sidedressing (NoN = starter only; Nrich = 300 lbs N per acre at planting; V4, V6, V8, and V10 = sidedressing of 180 lbs N per acre at the designated growth stage). The trials were conducted on continuous corn fields without a recent manure history at the Musgrave Research Farm in Aurora, NY). The values above each bar indicate the mean yield. Yield are not statistically different if followed by the same letter (a, b, etc.).

Nitrogen Uptake Efficiency

Sidedressing at 60% of the NRich rate can lead to the question: “Could yields have been higher for the sidedress treatments if more N had been applied?” The lack of a yield hit with early sidedress application compared to the Nrich treatment suggests the answer is no but we can also look at N balances for each of the treatments to investigate this. The ratio of N uptake to N supply (fertilizer N and soil N) shows that the crop took up about 70% of N supply when no N was applied beyond the starter (NoN treatment) and 44, 44, 42, and 39% for sidedressing at V4, V6, V8, and V10, respectively. The lowest uptake efficiency was for the NRich treatment (only 31%), signaling that (1) there was a considerably over-application of N in the NRich treatments each year, and (2) it was very unlikely that N supply limited yield at the various sidedress rates.

Bar charts depicting nitrogen sidedress treatments over the 4 years of the study
Figure 2. Nitrogen supply and uptake as impacted by timing of sidedressing (NoN = starter only; Nrich = 300 lbs N per acre at planting; V4, V6, V8, and V10 = sidedressing of 180 lbs N per acre at the designated growth stage). The trials were conducted on continuous corn fields without a recent manure history at the Musgrave Research Farm in Aurora, NY).

Conclusions and Implications

Sidedressing at V4 and V6 growth stages produced the same yield as obtained in the NRich treatment. Delaying the sidedress application to V8 and V10 resulted in reduced yield compared to what was obtained with sidedressing the same amount of N at V4 and V6. However, yields with sidedressing at V8 and V10 still produced significantly higher yields than obtained in the NoN treatment. The N balance evaluations showed that N use efficiency declined with sidedressing beyond V6, primarily due to the yield hit taken when sidedressing was delayed (and sidedress N was needed in the first place). Based on these results, we conclude that if additional N beyond a small starter is needed for optimal yield, it is recommended to sidedress earlier rather than later in the season.

Acknowledgements

Cornell, NMSP, and Pro-Dairy logosThis research was funded with federal formula funds. We thank the Paul Stachowski, farm manager of the Musgrave Research Farm at Aurora, NY, for help with field management. We also thank the many NMSP team members for help with harvest and sample processing over the years. For questions about these results, contact Quirine M. Ketterings at 607-255-3061 or qmk2@cornell.edu, and/or visit the Cornell Nutrient Management Spear Program website at: http://nmsp.cals.cornell.edu/.

Print Friendly, PDF & Email

Stalk Nitrate Test Results for New York Corn Fields from 2010 through 2020

Quirine Ketterings1, Sanjay Gami1, Greg Godwin1, Karl Czymmek1,2, and Mike Reuter3
Cornell University Nutrient Management Spear Program1, PRO-DAIRY2, and Dairy One3

Introduction

The corn stalk nitrate test (CSNT) is an end-of-season evaluation tool for N management for corn fields in the 2nd year or more that allows for identification of situations where more N was available during the growing season than the crop needed. Research shows that the crop had more N than needed when CSNT results exceed 2000 pm. Results can vary from year to year but where CSNT values exceed 3000 ppm for two or more years, it is highly likely that N management changes can be made without impacting yield.

Findings 2010-2020

In 2020, 48% of all tested fields had CSNT-N greater than 2000 ppm, while 34% were over 3000 ppm and 19% exceeded 5000 ppm (Table 1). In contrast, 17% of the 2020 samples were low in CSNT-N. The percentage of samples testing excessive in CSNT-N was most correlated with the precipitation in May-June with droughts in those months translating to a greater percentage of fields testing excessive. Because crop and manure management history, soil type and growing conditions all impact CSNT results, conclusions about future N management should take into account the events of the growing season. This includes weed and disease pressure, lack of moisture in the root zone in drought years, lack of oxygen in the root zone due to excessive rain in wet years, and any other stress factor that can impact crop growth and N status.

Distribution of corn stalk nitrate test results (low, marginal, excess) for New York (NY) corn fields sampled in 2010-2020Note: Data prior to 2013 reflect corn stalk nitrate test submissions to NMSP only; 2013, 2014, and 2017-2020 data include results from NMSP and Dairy One; 2015-2016 includes samples from NMSP, Dairy One, and CNAL. Yield data are from the USDA – National Agricultural Statistics Service. Rainfall data were from CLIMOD 2 obtained from the Northeast Regional Climate Center.

Within-field spatial variability can be considerable in New York, requiring (1) high density sampling (equivalent of 1 stalk per acre at a minimum) for accurate assessment of whole fields, or (2) targeted sampling based on yield zones, elevations, or soil management units. The 2018 expansion of adaptive management options for nutrient management now includes targeted CSNT sampling as a result of findings that targeted sampling generates more meaningful information while reducing the time and labor investment into sampling. Two years of CSNT data are recommended before making any management changes unless CSNT’s exceed 5000 ppm, in which case one year of data is sufficient.

Graphs of CNST values over the study years
Figure 1: In drought years more samples test excessive in CSNT-N while fewer test low or marginal. The last 11 years include four drought years (2012, 2016, 2018, and 2020), three wet years (2011, 2013, and 2017), and four years labelled normal (2010, 2014, 2015, 2019) determined by May-June rainfall (less than 7.5 inches in drought years, 10 or more inches in wet years).

Relevant References

Acknowledgments

Cornell, NMSP, Pro-Dairy logosWe thank the many farmers and farm consultants that sampled their fields for CSNT. For questions about these results contact Quirine M. Ketterings at 607-255-3061 or qmk2@cornell.edu, and/or visit the Cornell Nutrient Management Spear Program website at: http://nmsp.cals.cornell.edu/.

Print Friendly, PDF & Email

Manure injection for corn silage in conservation till, strip till and no-till conditions

Martin L. Battagliaa, Quirine M. Ketteringsa, G. Godwina, Karl J. Czymmeka,b
a Nutrient Management Spear Program, b PRODAIRY, Department of Animal Science, Cornell University

Introduction

Conservation tillage practices and incorporation and injection of manure have increased in New York State over the last 20 years. In the future, it is expected that dairy farmers will need to make significant further progress toward no-till practices to minimize soil erosion losses and maximize soil health and carbon sequestration. Compared to surface application of manure, incorporation and injection can reduce ammonia volatilization, odor emissions and nutrient losses, particularly phosphorus (P), in water runoff. However, shallow incorporation of manure with an aerator tool or similar full-width tillage implements, while effective at retaining nitrogen (N) and P (Place et al., 2010), does not meet no-till practice standards as defined by USDA-NRCS. Injection of manure is only compatible with no-till and reduced tillage if low disturbance equipment is used. One central question is: are conservation tillage practices, including no-till planting and zone building, compatible with systems where manure is spring-injected in New York.

Field studies

manure injection systemTwo types of studies were conducted on dairy farm fields in western New York. The first study (2012-2013) evaluated the impact of zone tillage depth (0, 7 and 14 inches). This study was completed on one field in 2012 and two fields in 2013. An aerator was used for seedbed preparation. The second study (2014-2016) evaluated three intensities of conservation tillage, including no-tillage, reduced tillage (aerator without zone tillage), and intensified reduced tillage (aerator plus zone tillage at 7 inches depth). This study was conducted on two fields each year.

All fields had a zone tillage and a winter cereal cover cropping history of more than 10 years. Fields were in a dairy rotation of typically 3-4 yr corn alternated with 3-4 yr alfalfa/grass. Liquid manure was used as the primary source of soil fertility. It was injected (6-inch depth; 30 inches between injection bands) in March at a rate of about 13,000 gallons per acre (2012 through 2015) or 8,000 gallons per acre (2016) using a manure injector with chisel and sweep tools (Figure 1). Average total N content in manure ranged from 20 to 25 pounds of N per 1000 gallons. Manure P content ranged from 5 to 11 pounds of P2O5 per 1,000 gallons, while solids content varies from about 5 to 10%.

In both types of studies, zone tillage was performed in late April using an 8 row (30 inch) zone builder with subsoiler shanks and a 20-foot wide aeration tool set at a 15 degree angle pulled in tandem. Corn was planted at 15-inch corn row spacing at a rate between 34,000 and 35,000 seeds per acre between April 30 and May 13. No sidedressing of N was done given practical limitation of 15-inch corn row spacing. Each year, we measured early growth parameters (plant biomass, leaves per plant, stand density, and plant height at V5), and took soil samples at V5 that were analyzed for the pre-sidedress nitrate test (PSNT). At harvest we took corn stalks and analyzed them for the corn stalk nitrate test (CSNT), determined silage yield and dry matter content as well as forage quality parameters including crude protein (CP), acid detergent fiber (ADF), and neutral detergent fiber (NDF).

Results

Average plant density at V5 ranged between ~31,600 and 32,700 plants per acre (between 90 and 96% of the seeding rate). Reduced tillage and even omitting tillage altogether did not impact early corn silage stand density (Table 1).

In both types of studies, and for all fields, the PSNT-N exceeded 21 ppm NO3-N, indicating sufficient N from manure and soil organic matter mineralization. The PSNT results also indicate no impact of tillage practice or depth on mid-season N availability (Table 1).

Silage yield averaged about 25 tons per acre (at 35% dry matter) in the tillage depth study, with 7.8% CP. In the tillage intensity studies, yields averaged about 23 tons per acre with 7.3% CP. The results should not be compared between the two types of studies as trials were conducted on different fields and across different growing seasons. Tillage depth or intensity did not impact yield or CP content in either of the studies (Table 1).

The CSNT-N ranged between 3,235 and 3,589 ppm NO3-N in the zone tillage depth, and between 2,315 and 2,753 ppm NO3-N in the tillage intensity study, above the 2,000 ppm NO3-N optimum range. Zone tillage depth and different tillage intensities did not impact CSNT-N and both PSNT-N and CSNT-N show N was not limiting plant growth (Table 1).

Plant density and pre-sidedress nitrate test (PSNT) at V5, and corn stalk nitrate test (CSNT), silage yield [35% dry matter (DM)], crude protein (CP), and acid and neutral detergent fiber (ADF, NDF).

Conclusions and Implications

All types of tillage systems and depths performed equally well in terms of plant growth, N availability, corn silage yield and quality suggesting that reduced tillage and no-till can both be viable options to more intensive tillage for this farm. Results might be different for fields with limited history of zone building and other efforts to improve soil health. We conclude that at this farm that has made significant efforts to adopt soil health practices, manure injection followed by no-till planting or zone building can sustain yields and conserve N. No-till planting has the additional benefit that it reduces soil disturbance, risk of P runoff, as well as tillage-associated fuel, equipment, and labor costs.

Additional Resources

Full Citation

This article is summarized from our peer-reviewed publication: Battaglia, M.L., Ketterings, Q.M., Godwin, G., Czymmek, K.J. 2021. Conservation tillage is compatible with manure injection in corn silage system. Agronomy Journal. https://doi.org/10.1002/agj2.20604 (in press).

Acknowledgements

Cornell, NMSP, and Pro-Dairy logosIn memory of Willard DeGolyer, whose dedication to on-farm research inspired us all. This study was funded by the New York Farm Viability Institute (NYFVI), a USDA Conservation Innovation Grant (69-3A75-17-26), supplemented by federal formula funds. We thank the owners and the farm crew for their collaboratively work and dedication to the success of this research over the 5 years where the field studies were conducted. For questions about these results, contact Quirine M. Ketterings at 607-255-3061 or qmk2@cornell.edu, and/or visit the Cornell Nutrient Management Spear Program website at: http://nmsp.cals.cornell.edu/.

Print Friendly, PDF & Email

What’s Cropping Up? Volume 30 No. 1 – January/February 2020 Now Available!

Stalk Nitrate Test Results for New York Corn Fields from 2010 through 2019

Quirine Ketterings1, Karl Czymmek1,2, Sanjay Gami1, Mike Reuter3
Cornell University Nutrient Management Spear Program1, PRO-DAIRY2, and Dairy One3

Introduction
The corn stalk nitrate test (CSNT) is an end-of-season evaluation tool for N management for 2nd or higher year corn fields that allows for identification of situations where more N was available during the growing season than the crop needed. Research shows that the crop had more N than needed when CSNT results exceed 2000 pm. Results can vary from year to year but where CSNT results exceed 3000 ppm for two or more years, it is highly likely that N management changes can be made without impacting yield.

Findings 2010-2018
The summary of CSNT results for the past ten years is shown in Table 1. For 2019, 33% of all tested fields had CSNT-N greater than 2000 ppm, while 24% were over 3000 ppm and 11% exceeded 5000 ppm. In contrast, 31% of the 2019 samples were low in CSNT-N. The percentage of samples testing excessive in CSNT-N was most correlated with the precipitation in May-June with droughts in those months translating to a greater percentage of fields testing excessive. As crop history, manure history, other N inputs, soil type, and growing conditions all impact CSNT results, conclusions about future N management should take into account the events of the growing season. This includes weed pressure, disease pressure, lack of moisture in the root zone in drought years, lack of oxygen in the root zone due to excessive rain, and other stress factors that can impact the N status of the crop.

CSNT-N tableWithin-field spatial variability can be considerable in New York, requiring (1) high density sampling (equivalent of 1 stalk per acre at a minimum) for accurate assessment of whole fields, or (2) targeted sampling based on yield zones, elevations, or soil management units. The 2018 expansion of adaptive management options for nutrient management now includes targeted CSNT sampling as a result of findings that targeted sampling generates more meaningful information while reducing the time and labor investment into sampling. Two years of CSNT data are recommended before making any management changes unless CSNT’s exceed 5000 ppm (in which case one year of data is sufficient).

CSNT-N comparison by year graphs
Figure 1: In drought years (determined in this analysis by May-June rainfall below 7.5 inches; which occurred in 2012, 2016, and 2018), more samples test excessive in CSNT-N while fewer test low or marginal.

Relevant References

Acknowledgments
logosWe thank the many farmers and farm consultants that sampled their fields for CSNT. For questions about these results contact Quirine M. Ketterings at 607-255-3061 or qmk2@cornell.edu, and/or visit the Cornell Nutrient Management Spear Program website at: http://nmsp.cals.cornell.edu/.

Print Friendly, PDF & Email