Karl J. Czymmek1,2, Quirine M. Ketterings2, Mart Ros2, Sebastian Cela2, Steve Crittenden2, Dale Gates3, Todd Walter4, Sara Latessa5, and Greg Albrecht6
1PRODAIRY, 2Nutrient Management Spear Program (NMSP), Department of Animal Science, Cornell University, 3United States Department of Agriculture Natural Resources Conservation Service (USDA-NRCS), 4Department of Biological and Environmental Engineering, Cornell University, 5New York State Department of Environmental Conservation (NYSDEC), 6New York State Department of Agriculture and Markets (NYSDAM)
After more than 15 years of field use, version 1 of the New York Phosphorus Index (NY-PI) has been updated. The new version (NY-PI 2.0) incorporates new science and does a better job of addressing P loss risk while still giving farm managers options for recycling manure nutrients. The process of updating the NY-PI was led by the NMSP at Cornell in partnership with NYSDAM, NYSDEC, and NRCS and in consultation with certified planners and farmers. Farms that are regulated as concentrated animal feeding operations (CAFOs) will need to start using the new NY-PI when the CAFO Permit is updated (current permits are due to be renewed in 2022). Farms that are in state or federal cost share programs will need to use the tool based on NRCS determination. Agency discussions are in progress to make sure the roll-out is as smooth as possible.

Here is how it works: a farm field is rated based on an assessment of its runoff risk-related transport features, including those observed directly during a field visit and others from normal soil survey information (most of these factors are the same as those used in the old NY-PI). For example, being close to a stream or watercourse, poorly drained soil, or higher levels of soil erosion are some of the risk factors that can lead to a high transport score. For fields with a high transport score, manure and P fertilizer application practices can be selected to reduce the transport risk. These best/beneficial management practices (BMPs) cover a combination of changes in application timing (close to planting) and method (placing P below the soil surface), and more vegetation on the soil surface when P is applied. Thus, implementation of BMPs will reduce the final PI score. Field practices include setbacks, ground cover (sod or cover crops) or placing manure below the soil surface (injection or incorporation). Combined with information about soil test P levels, the final NY-PI score results in a management implication: if risk is classified as low or medium, manure may be used at N-based rates; if classified as high, manure rate is limited to expected P uptake by the crop, and if very high, no P from manure or fertilizer may be applied. This transport × BMP approach is shown in Figure 1.
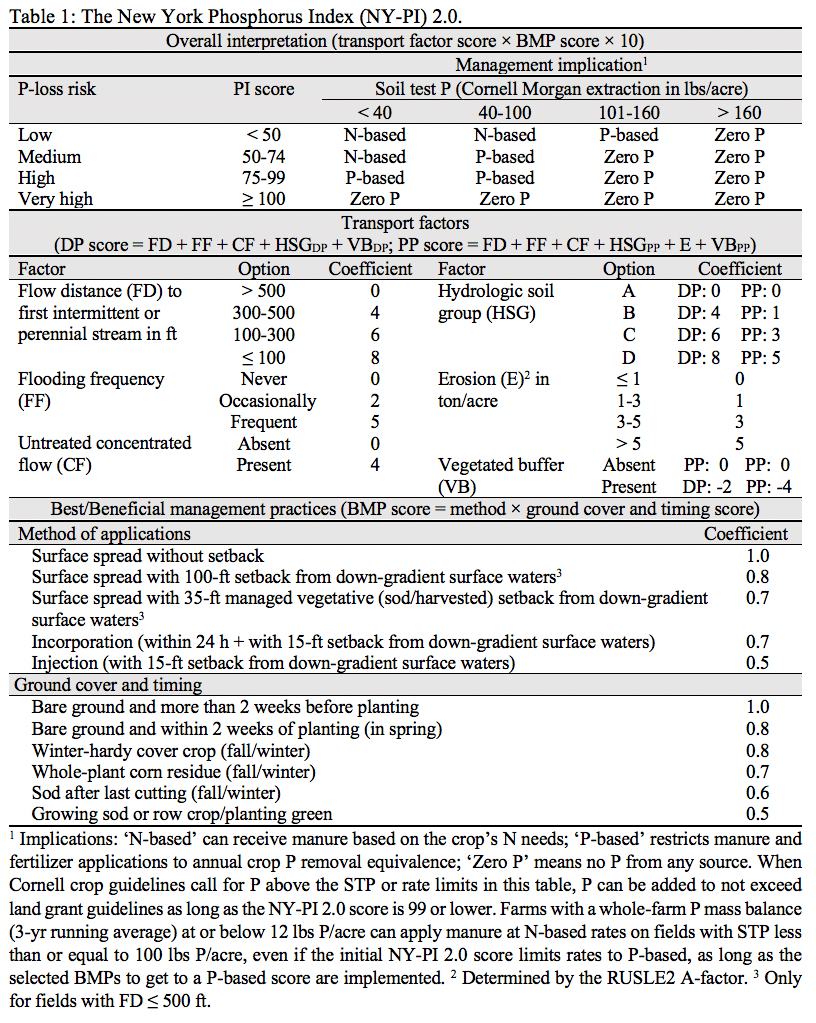
Coefficients were set for the new NY-PI using a database of more than 33,000 New York farm fields supplied by certified nutrient management planners and a second dataset that included data for PI assessment and whole-farm nutrient P balance assessments for 18 New York AFO and CAFO farms. While some farm fields had to have manure diverted, in almost all situations, the NY-PI 2.0 provided a pathway for farms with an adequate land base to both reduce risk and apply the manure generated from their herd. The full NY-PI 2.0 can be seen in Table 1.