By: Savanna Crossman, Research Coordinator, CCA
Multiple years of data collection and research have led to the creation and testing of a variable rate seeding model customized to the conditions of New York State. Thanks to the statistical analysis by Cornell Professor, Dr. Michael Gore, and PhD student, Margaret Krause, the Precision Ag Project is gearing up to test this model on select fields in 2016.
The Cornell research team has spent the summer analyzing the 2014 project data. The team has been examining the data using different statistical techniques to create a model that will select hybrids and population rates given certain soil properties and characteristics.
The Data Types
For the first round of preliminary analysis, the team has focused in on six major data types; seeding rate, hybrid, topographical information, NRCS soil survey maps, Veris soil sampling data, and grid soil sampling data.
It is important to note that four of the above data types are accessible to growers who are involved in precision farming at almost any level. The variables of seeding rate, hybrid, and topographical information can all be taken from the display monitor in the form of as-applied data. Though the accuracy of NRCS Soil Survey maps can be highly varied across the State, they were included in the analysis as they are publically available and easily accessed online.

The two types of precision soil sampling data used in the analysis are services that growers can purchase from several companies. Of the two methods, the Veris soil sampler provides the highest resolution of soils data for pH, electrical conductivity, and organic matter. The Veris takes these measurements every few seconds as it is pulled across a field (Figure 1). It is a very slow process, however, and requires near perfect field conditions and a highly skilled operator to obtain accurate data. For these reasons, the project only has Veris data on approximately 600 acres.
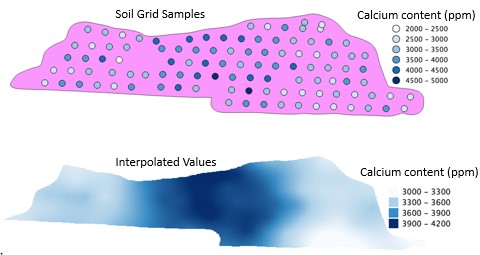
By contrast, grid soil sampling is significantly more time efficient and forgiving of field conditions. The grid sampler collects and geo-locates soil samples in ½ acre grids. Each sample then receives a standard fertility test which yields approximately twenty soil characteristics. As the samples are done in grids and not continuously like the Veris, the values must be interpolated to assign each point in the field a value (Figure 2).
Analysis Process
The project is in its third year of data collection with 2700 acres and ten growers involved over that time. This article will only discuss the preliminary analysis of one field in 2014 for demonstrative purposes. The project will release more thorough results and analysis as it is completed.
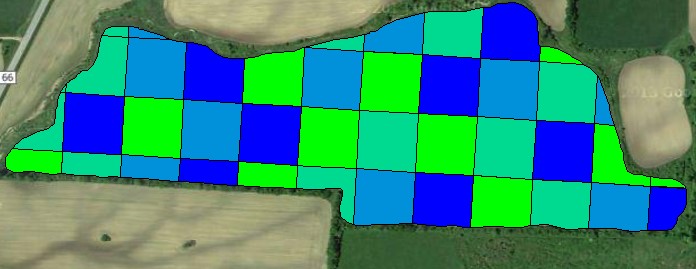

This section will walk through the model analysis of the field and demonstrate how the model generates a variable rate seeding prescription. The analysis presented is focused on a 2014 grain corn field located in Sackets Harbor, NY. The field is in a corn-soybean rotation with conventional tillage and 30” rows. It was planted with a split planter using the hybrids P9675AMXT and P9690AM and the project’s randomized design prescription (Figure 3).
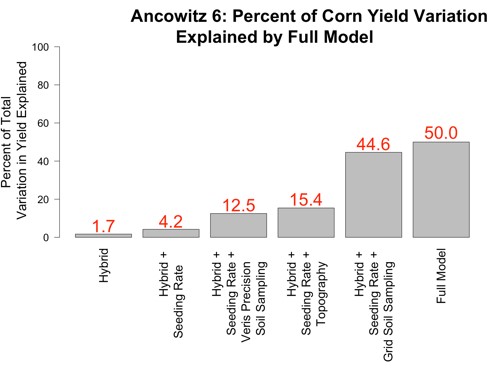
When the model was run, it was determined that hybrid and seeding rate together only accounted for 4.2% of the variation in yield (Figure 4). Some growers would have expected to see these two factors contributing more to the yield picture, however, this simply tells us that there are several other important variables that need to be included in the model for this field.

Topography is one such variable. Due to the glaciation of the soils across New York State, topography can be highly varied in a single field. As this field is located in Sackets Harbor, the topography happens to be fairly uniform. There are some low spots, but the field is largely flat with some downward sloping around the edges (Figure 5). As a result of its uniformity, the topography data of elevation, slope, aspect, and curvature only account for 11.2% of the yield variation (Figure 4).
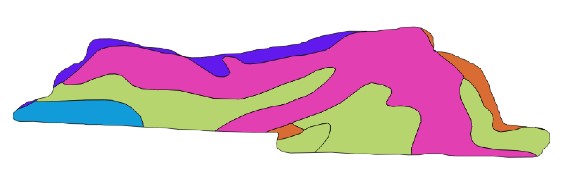
 Figure 6. The NRCS soil survey map shows six soil types in this field.
The NRCS soil survey maps also represented this field as fairly uniform. Though the map shows five different soil types in this sixty acre field, the soil types are fairly similar in terms of their sand, silt, and clay content (Figure 6). The model determined that in this case, the NRCS soil survey map explained less than 1% of the yield variation and was therefore dropped from the model.
In the next phase of analysis, the model has added in the precision soil sampling results. As expected, these data help to explain more of the yield picture. The Veris samples captured organic matter and cation exchange capacity at this location. While only capturing two soil properties, the Veris data was able to explain 8.3% of the yield variation (Figure 4).
When the grid soil sample results were run in the model, it was determined that they accounted for 40.4% of the yield variation (Figure 4). As this method of sampling captures over twenty soil parameters, this result is not unexpected. It does, however, emphasize the huge potential that grid sampling holds in the development of variable rate seeding prescriptions.
The full model combines all of the above variables and determines how much they collectively contribute to yield. In this field, 50% of the yield variation was explained using just these four data types (Figure 4). As the model combined the data types, it was able to progressively explain more yield. This suggests that these data, the grid sampling in particular, are capturing a large amount of the variation in the field. As the analysis continues, more data types such as precision weather and crop health will be included in the model to explain more yield.
Generating a Variable Rate Seeding Prescription
The end goal of this model is to use it to make predictive variable rate seeding prescriptions for growers. This is done by breaking the field into small grids and running the model in reverse. Now, the model is given all the soil and topographical characteristics and asked which seeding rate will optimize yield, or profit, for that grid and hybrid (Figure 7).
It is important to recognize that a prescription written for maximum yield can look quite different from one written for maximum profit. These prescriptions can shift dramatically as the commodity prices change which emphasizes the importance of watching the markets and input costs to make the best management decisions.

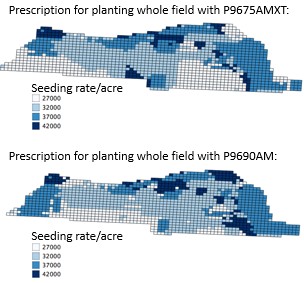
As a result of multi-hybrid planters coming onto the market, the model was also run to determine the optimal seeding rate and hybrid choice for each grid (Figure 8). In this scenario, a visible planting rate-hybrid interaction can be seen between the two maps as each hybrid has optimal seeding rates given certain field and soil conditions. These example prescriptions showcase the potential that the project has to evolve and meet grower needs as agricultural technology continues to rapidly advance. To demonstrate the cost benefit of utilizing these technologies, a brief economic analysis was done comparing the model to grower practice.
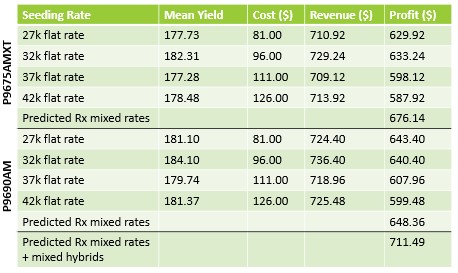
The economic analysis of the variable seeding rate prescriptions is promising for this field. The grower typically plants a flat rate of 35,000 seeds/ac at this location but the model predicts that it can dramatically increase that with the variable seeding rate prescriptions it has generated. For P9690AM the model predicts an increase of $24.18/ac and $60.46/ac for P9675AMXT (Table 1). For hypothetical purposes, if the grower was to use a multi-hybrid planter with these two hybrids, the model predicts a profit increase of $91.56/ac.
Looking Forward
These results show a huge potential for the success of variable seeding rate technology as well as precision soil sampling in New York State. As it is still in its pilot state, the model generated variable rate seeding prescriptions will begin testing on select fields in 2016. As the analysis continues, additional statistical techniques will be used and additional years of data will be incorporated to make the model more robust. It can be expected that in 2017 the model will be released on a larger scale.
This first pass of the data has demonstrated that as more data types are added, more of the yield is explained. As a result, the project would like to expand the breadth and resolution of the collected data types through precision weather data, precision UAV data, and expanded precision soil sampling.
Looking to the 2016 season, the project is aiming to expand grower involvement to help further the development of the model. Increasing total acreage across the State will help to capture more climatic and topographical variation. This is critical in creating a model that can be used accurately by growers in all regions of the State.
A key to this expansion will be increasing the acreage with precision soil sampling data. In order to facilitate this, the project offers the grid soil sampling at 50% cost-share on all acres that are committed to participate in 2016. This Fall, there will be a round of post-harvest grid soil sampling, and those interested in sampling at that time are encouraged to contact the project as soon as possible.
Anyone interested in participating in the research project or the precision soil sampling is encouraged to contact Savanna Crossman at savanna@nycornsoy.com or (802) 393-0709.