
Lindsay Fennell, Bianca Moebius-Clune, Aaron Ristow, and Harold van Es
Soil and Crop Sciences Section – School of Integrative Plant Science, Cornell University
A high percentage of corn fields may receive substantially more N fertilizer than is economically optimum, for which there are no obvious visual signs. Conversely, fields deficient in N have obvious visual cues, such as stunted growth and yellowing leaves. The Corn Stalk Nitrate Test (CSNT) has been used for two decades by farmers and consultants as an end-of-season tool for evaluating field-specific corn N management practices. More recently, it has been strongly promoted as a tool for producers to aid in fertilizing to maximum profits by determining whether the crop has received deficient, adequate, or excessive amounts of nitrogen, and has been endorsed by many as part of an adaptive management approach. However, we submit that the promotion of CSNTs should be reconsidered based on the existing evidence of its imprecision.
The Test and Its Utility
The basis of the test is that corn plants that received excessive nitrogen to attain maximum yields have high nitrate levels in the lower stalks at the end of the season. Conversely, plants suffering from nitrogen deficiency remove (translocate) more N from the lower corn stalks during the grain-filling period (Blackmer & Mallarino, 1996). Universities and grower associations suggest the following interpretations of the test:
- Low (less than 250 ppm nitrate-N, in some states 450 or 750): high probability that the crop was N deficient.
- Optimal (generally between 250 and 2000 ppm nitrate-N, in some states also including a “marginal” range when below 750): high probability that yields were not limited by N, and no apparent excess.
- Excess (>2000 ppm nitrate-N): high probability that N uptake exceeded plant needs.
The CSNT’s post-mortem evaluation is supposedly useful to growers for deciding future N management. With multiple year assessments, protocols state that appropriate consideration should be given for weather conditions, and fertilization rates should be increased for fields that usually test in the low range and decreased when CSNTs are in the excess range.
Following this logic, continued use of the test would allow growers to fine-tune adjustments toward optimal rates. In this, we need to consider the accuracy of the CSNT, notably its ability to detect (i) N deficiencies and (ii) excessive N applications. It has been reported in journal articles and fact sheets that yield adequacy is often observed with CSNT values in the “low” range, which indicates that the test is a weak indicator of N deficiency (What’s Cropping Up? Vol.22 No.3). An Iowa report based on a large data set of N rate trials (Sawyer, 2010) indicated that 15% of CSNT values in the “low” range were false positives, while of cases with field-verified N deficits, 30% of CSNT results were false negatives. In addition, a Maryland study involving 10 experiments (Forrestal et al., 2012) found about one third of “low” CSNT values to be false positives for deficiencies. In other words, adequate fertilizer was applied when the CSNT reported N deficiency.
For accurately detecting N excesses, earlier research from New York suggests that fields with excessive N applications may still show low or optimum CSNT values (What’s Cropping UP? Vol.21 No.3) and that site differences affect CSNT values more than excess or deficient fertilizer rates (Katsvairo et al., 2003). The aforementioned Iowa report (Sawyer, 2010) also indicated that 33% of cases with field-verified excess N applications were not identified through the test. The Maryland study found as much as half of the CSNT results to be false negative for excessive nitrogen.
As part of research on the Adapt-N tool (http://www.adapt-n.com/), we conducted strip trials from 2011-to-2014 (including 14 multiple year assessment trials) that provided the opportunity for us to evaluate whether the CSNT is an effective tool for adaptive nitrogen management in corn production.
Methods
Ninety-one replicated strip trials on commercial and research farms were conducted for four growing seasons (2011-2014) throughout New York (49 trials) and northern Iowa (42 trials). They involved two rates of N, a “high” rate and a “low” rate, which resulted in field-scale strips with N rate differences ranging from 10 to 140 lbs/ac. The rates were set by applying a conventional “Grower” rate or using the Adapt-N tool to make an adaptive N recommendation. In most cases the Grower rate was higher. Trials had 3 to 8 replications for each treatment (except for 13 trials that with only single strip yield measures but replicated CSNT values). Trials were distributed across both states under a wide range of weather conditions, and involved grain and silage corn, with and without manure application, and rotations of corn after corn and corn after soybean (Tables 1, 2, & 3).
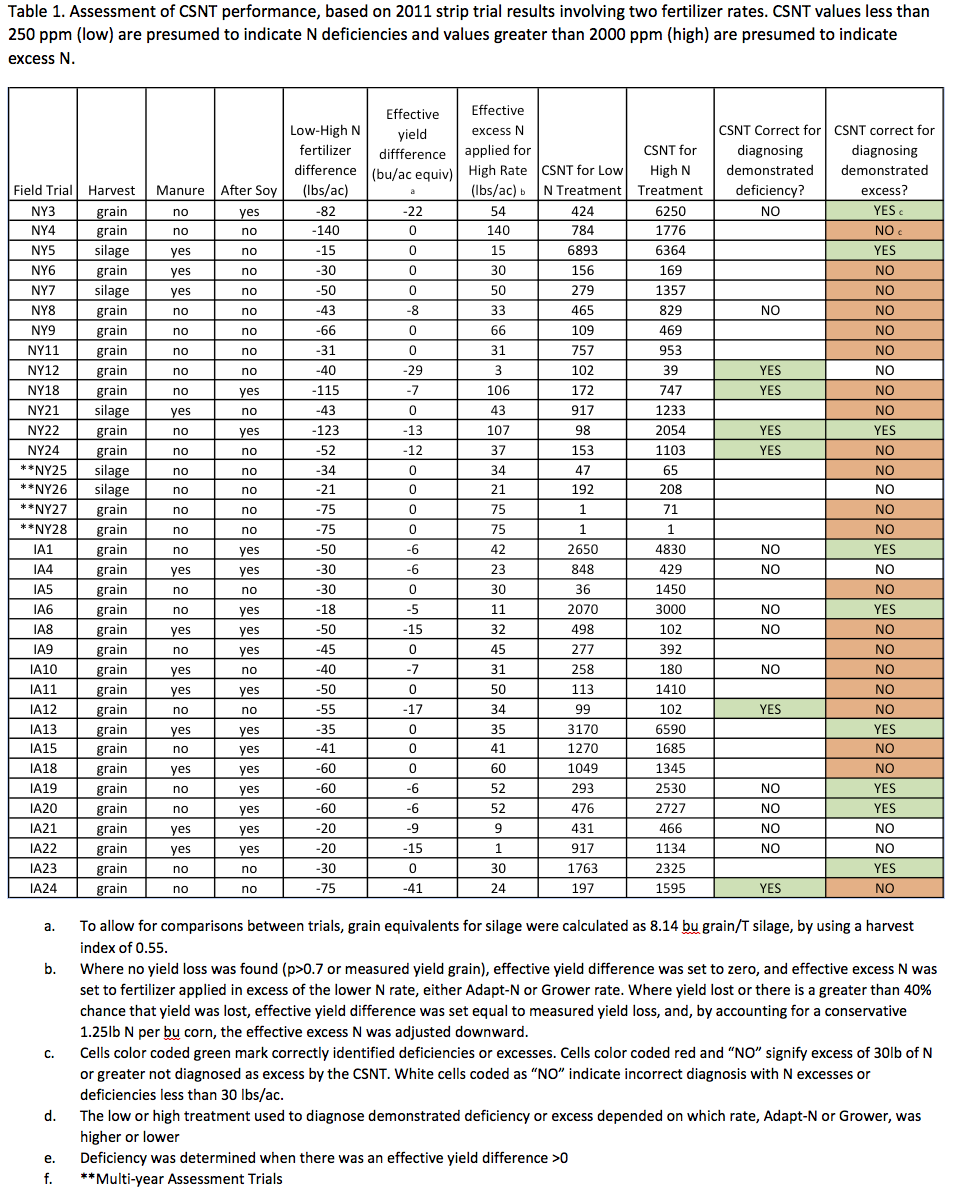

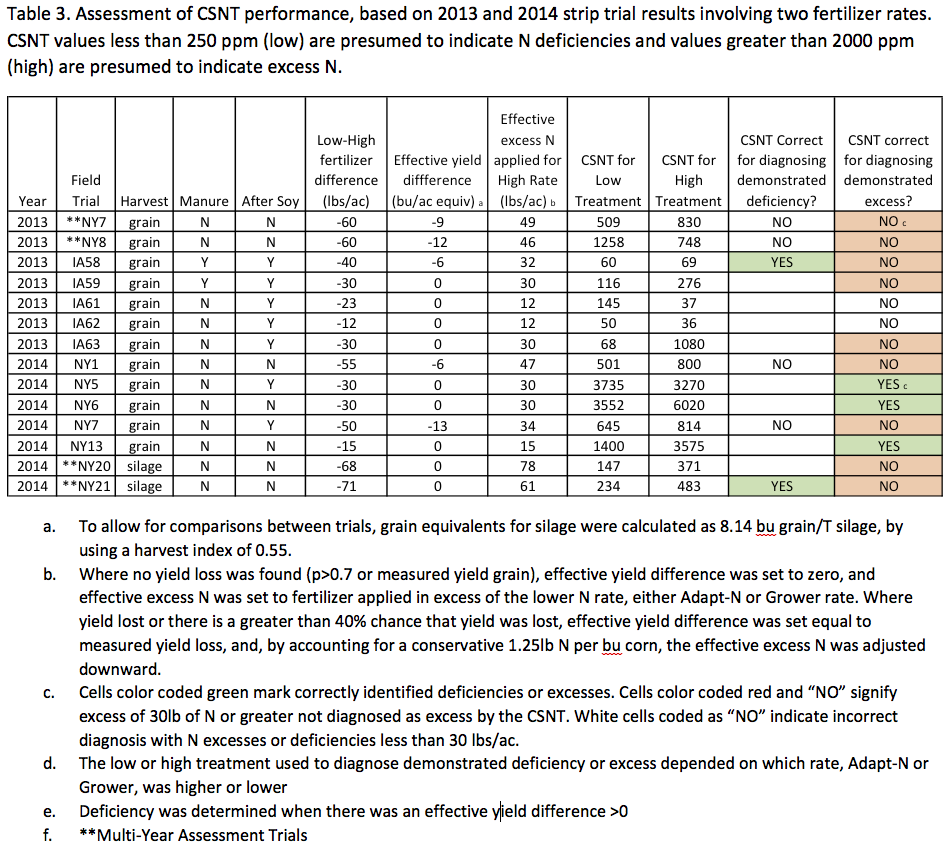
To allow for comparison across all trials, silage yield values were converted to grain equivalents (8.14 bu grain per ton silage, using a harvest index of 0.55). The yield results from a majority of the trials showed unambiguous over-fertilization associated with the higher N rate (same yields for both rates). In these cases, where there was no further yield gain with added N (within 5 bu/ac), the “effective yield difference” was set to zero. If there was a yield difference higher than 5 bu/ac the “effective yield difference” was set to the difference between the high and low rates. Where there was unambiguous over-fertilization with the higher N rates, the amount of “effective excess N applied” was set to the N rate difference between treatments (Tables 1-3).
In some cases the low rate provided insufficient N (reduced yields), and the optimum N level appeared to be between the high and low rates. In these cases, the amount of effective excess N applied was estimated by subtracting a conservative 1.25 lb N from the N rate difference between the treatments per bushel of yield lost due to the lower rate.
Fifteen corn stalk sections, sampled from each replicate strip, were dried, ground, and analyzed for nitrate content, according to published protocols. Means for each treatment are presented in Tables 1-3. The utility of the CSNT was then assessed by evaluating the relationship between N rates, test values, and yield losses, and determining whether it accurately diagnosed field-demonstrated deficient or excessive N levels.
Results
First, we evaluated whether CSNT values for the higher N rates were in fact higher than those for the lower N rates, which is an indicator of the precision to varying N levels. Overall, the CSNT values were higher for the low N rate in 31% of cases in NY and 26% of cases in IA, suggesting that in a significant number of cases the test was unable to reflect the actual N rate differences and results were presumably obscured by high variability.
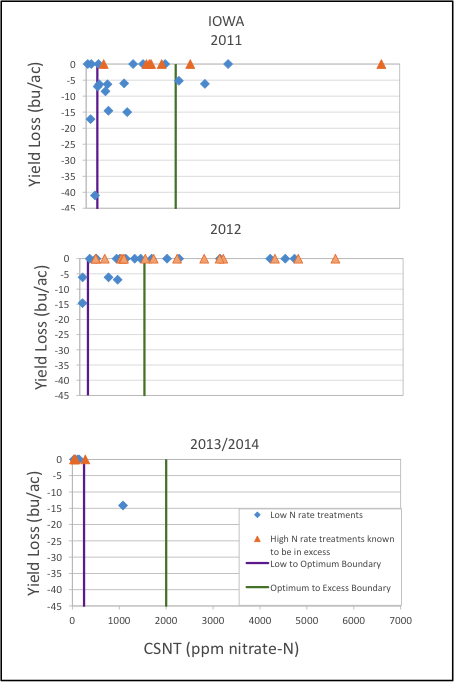
Next, we evaluated the relationship between yield loss and CSNT values. Figures 1 (NY) and 2 (IA) show the relationship between yield loss and CSNT results for the four growing seasons (2013 and 2014 were combined due to lower trial numbers). Given the categorical interpretation of CSNT results, we can identify four types of erroneous results from the CSNT):
- In many cases without yield loss CSNT values were below the 250 ppm “low” threshold, indicating frequent false positives for N deficiencies: The tool often identified deficiencies when in fact there were none.
- Many cases with yield losses were associated with CSNT values greater than 250 ppm, indicating frequent false negatives for deficiencies: The tool often did not identify deficiencies when fertilizer N levels were in fact deficient.
- In a few cases high CSNT values (>2000 ppm) were not associated with excess N rates. I.e., infrequent false positives for N excess: When the test indicated excess N, it was generally correct.
- In many cases with excess N rates the CSNT did not show high values (>2000 ppm).e., frequent false negatives for N excess: The tool often did not identify excesses when fertilizer N levels were in fact excessive.

Summarized results (Table 4) show that when CSNT values greater than 2000 ppm were measured (“excessive”), a high probability existed that indeed excess N was applied – only 6% (NY) and 8% (IA) false positives. This is the only criterion by which the test performs well. However, excessive N rates (no yield losses) can result in a wide range of CSNT values and we found that more than half of the fields with proven excess N application of greater than 30 lbs/ac (65% for NY AND 53% for IA) did not show CSNT values greater than 2000 ppm. I.e., the test failed to detect excess N rates in the majority of cases. Similarly, the CSNT generally performs very poorly when trying to detect deficiencies, with failure rates typically above 50% for both false positives and false negatives.

Conclusions
We conclude from these 91 strip trials over four years that the test has very limited ability to support management decisions. The poor utility for detection of N deficiencies was well known from the literature, although not recognized by many. Our results confirm this. The primary question therefore was whether the test can effectively detect excessive N applications. The answer appears to be a strong “no”. Although “excessive” CSNT values were reliably associated with over-fertilized plots (only 6-8% false positives), the test failed to identify over-fertilized crops (30 up to 140 lbs/ac) in about two-thirds of the cases in NY and half the cases in Iowa. I.e., a majority of the excessive N cases were not identified by the test. Since the test’s primary utility is related to determining excessive N rates, it appears to perform weakly in serving its main purpose.
An additional concern is that end-of-season evaluations of the current growing season have limited value for the predictability of N needs in future growing seasons. Research has demonstrated (summarized by van Es et al., 2007) that weather conditions during the early growing season greatly affect N losses and are a critical factor in determining optimum N rates. This implies that CSNT results from one growing season have limited value for predicting N needs for the next year when the weather may be very different. Overall, we conclude that the CSNT is not an effective tool for use in field-specific adaptive N management, primarily because it fails to identify the majority of cases with excessive or deficient N levels.
Acknowledgements
This work was supported by grants from the New York Farm Viability Institute, the USDA-NRCS Conservation Innovation Grants Program, the Northern New York Agricultural Development Program, and the International Plant Nutrition Institute. We are grateful for the cooperation in field activities from Bob Schindelbeck, Keith Severson, Kevin Ganoe, Sandra Menasha, and Anita Deming of Cornell Cooperative Extension, from Dave DeGolyer, Dave Shearing and other staff at the Western NY Crop Management Association, from Eric Bever and Mike Contessa at Champlain Valley Agronomics, and from Shannon Gomes, Hal Tucker, Michael McNeil and Frank Moore in Iowa, as well as the many farmers who implemented these trials.
References
Blackmer, A.M. and A.P. Mallarino. 1996. Cornstalk Testing to Evaluate Nitrogen Management (PM-1584). Iowa State Univ. Extension. Available on the Web at: http://www. extension.iastate.edu/Publications/PM1584.pdf. [URL verified 2/14/12].
Forrestal, P.J., R.J. Kratochvil, and J.J. Meisinger. 2012. Late-Season Corn Measurements to Assess Soil Residual Nitrate and Nitrogen Management. Agron. J. 104:148–157 (2012)
Katsvairo, T.W., W. J. Cox, and H. M. van Es. 2003. Spatial Growth and Nitrogen Uptake Variability of Corn at Two Nitrogen Levels. Agron. J. 95:1000–1011
Sawyer, John. 2010. Corn Stalk Nitrate Interpretation. Integrated Crop Management News. Iowa State University Extension and Outreach. http://www.extension.iastate.edu/ CropNews/2010/0914sawyer.htm [URL verified 3/11/12].
van Es, H.M., B.D. Kay, J.J. Melkonian, and J.M. Sogbedji. 2007. Nitrogen Management Under Maize in Humid Regions: Case for a Dynamic Approach. In: T. Bruulsema (ed.) Managing Crop Nutrition for Weather. Intern. Plant Nutrition Institute Publ. pp. 6-13. Managing N for Weather_Ch2.pdf .
