Aaron Gabriel, Senior Extension Educator, Cornell Cooperative Extension, Capital Area Agriculture & Horticulture Program
Over the last three years, I have been developing a partnership with high schools to have their students participate in my research projects. It started out with my interest in black cutworm. As I scouted corn fields, many of the skips were not due to rocks or soil conditions, as farmers often assume. Black cutworm frequently was the culprit (as well as birds). To collect enough data to support my observation, would take a lot of time for one person. So, I developed a protocol for determining the cause of skips in corn and contacted several high schools to see if they wanted their students to participate in field research. I found interest at Berne/Knox/Westerlo (BKW), Greenwich, Salem, New Lebanon, and Taconic Hills High Schools. I also found interest from a 4-H club in Columbia County and one Master Gardener.
It just so happens that there is a nation-wide effort to engage students in STEM (science, technology, engineering, and math). The desire to engage students in a research experience and the need for Cooperative Extensions to do research is coming together into a successful partnership. To obtain financial support, grant writing has taken a new perspective. I received two small grants from regional foundations, not to study the pedestrian black cutworm, or nematodes (which have been studied for many years), but to give students a research experience by involving them in relevant local Cooperative Extension research. The program objectives focus on the students and on helping the local agricultural community, not on solving a specific agricultural problem.
Program Objectives:
Develop a 4-session high school curriculum to give students a real-world research experience that will:
Teach students how to conduct and interpret research.
Help students recognize their interest and potential in pursuing careers in science and research.
Teach students how to critically evaluate research that is broadcast through news media.
Conduct agricultural research that will:
Provide useful information that CUCE can extend to farmers for positive impacts.
Give students an experience to help them better understand agricultural.
Teach students the impact that research has on the community.
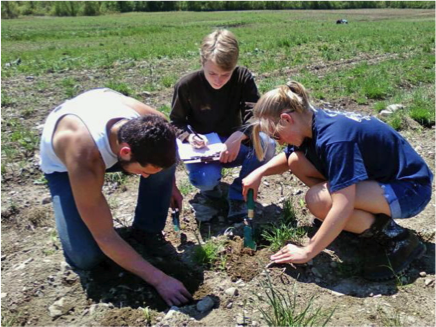
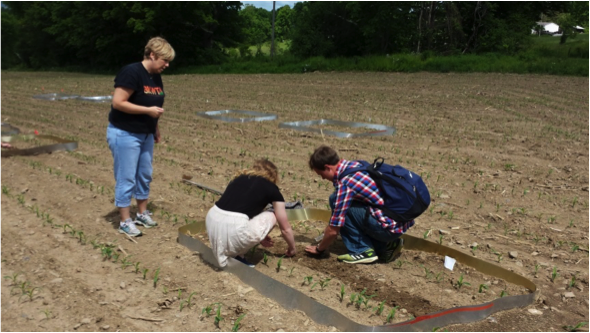
My first collaboration was with a class of BKW Advanced Placement Biology students in late May, 2012. Having taken their last exam in mid-May, like all AP Biology students in New York, they needed some projects until the end of the year in mid-June. First, I gave them a presentation in class to explain the dilemma of missing corn plants and my interest in the black cutworm (BCW). I armed them with a data collection sheet, tools, and pictures of the insects, bugs, and diseases they might find digging in a corn field looking for the culprits that cause skips in corn. The first field we sampled was an early-planted corn following sod. The seed had a low dose of seed-applied insecticide. The sod and weeds had not yet been sprayed with herbicide. There were many missing corn plants. To my surprise, at most of the skips they were finding seedcorn maggot pupae. We learned that at high pressure, the low-dose of seed-applied insecticide did not provide protection. The corn population was reduced by 23% to 21,017 plants/acre, with 30% of the skips due to seedcorn maggot. Seedcorn maggot was not as severe in other fields.
Berne/Knox/Westerlo students tallying the causes of missing corn plants. Seedcorn maggot was the most prominent culprit. The low-dose of seed-applied insecticide could not fully protect this early-planted field after sod.
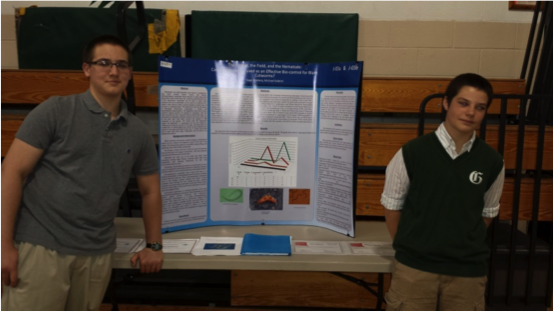
Currently, I am doing research to learn how to use beneficial nematodes to control insect pests in corn (grubs, black cutworm, and corn rootworm). Two students helped me by doing a bioassay in the lab to confirm that our nematodes would infect BCW. They entitled their project, “The Farmer, the Field, and the Nematode”, entered it into the Greater Capital Region Science and Engineering Fair and won the environmental award.
Two Junior High School students received an environmental award at the Greater Capital Region Science and Engineering Fair for a doing a bioassay that showed the nematodes were lethal to black cutworm.
With confidence that these nematodes (from the lab of Dr. Eslon Shields, Cornell Univ.) will infect black cutworm, plots were set up to evaluate their effectiveness on BCW in the field. Plots 5’ X 7” were treated with either nematodes or water, as a control, and then infested with purchased BCW. Fields were located in Salem and Berne. AP Biology students from the local schools helped infest the plots and collect data to compare the damage from the two treatments. Nematodes did kill some of the BCW, but damage between the two treatments was similar.
Students help set up field plots of nematodes and black cutworm, and then collected the data to compare cutworm damage in the two treatments.
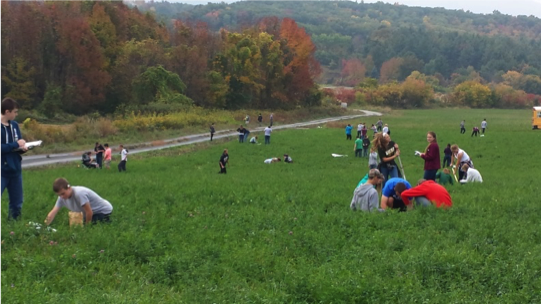
As I was trying to figure a new way to get the nematodes established in a field before the corn crop, Donna McGovern, BKW teacher, asked if I had a project for her entire class of ninth-grade biology students. We developed a plan to apply the nematodes to a white grub-infested hay field before it would be planted to corn. So, 52 biology students sampled 160 locations and collected and tallied up the white grubs in two fields. On my own, I could never sample the grub population like that. Nematodes were applied and corn will be planted in the spring. This time, some plots will be infested with BCW, and others with corn rootworm. The students will be there to collect the data on BCW damage. Since rootworm damage is evaluated in July, I will need to find a 4-H club to help, or students that want an education outside of the school year.
Fifty-two biology student sample 160 locations to determine the white grub population. Nematodes will establish themselves on the grubs before the corn is planted, and then lay in wait next spring to protect the corn seedlings.
Students have also performed lab bioassay experiments and determined that nematodes will not survive in pop-up fertilizer, unless it is diluted with 50% water. The purpose is to evaluate other methods of applying nematodes (which are suspended in water). New Lebanon students determined that our nematodes do not infect fly larvae, like the seedcorn maggot. These fairly simple experiments give students a real research experience and help me generate the information I need as a CCE educator to help local farmers.
The next step of the CCE / School Research Partnership is to complete development of a 4-session curriculum that can be used by any pair of Extension Educator and school teacher. This is currently underway where students will learn how to research a topic, formulate a hypothesis, design an experiment, do the experiment, analyze the data and make conclusions. The finale of the curriculum will be to visit a local farm and learn how research has shaped agriculture and how it impacts farmers.
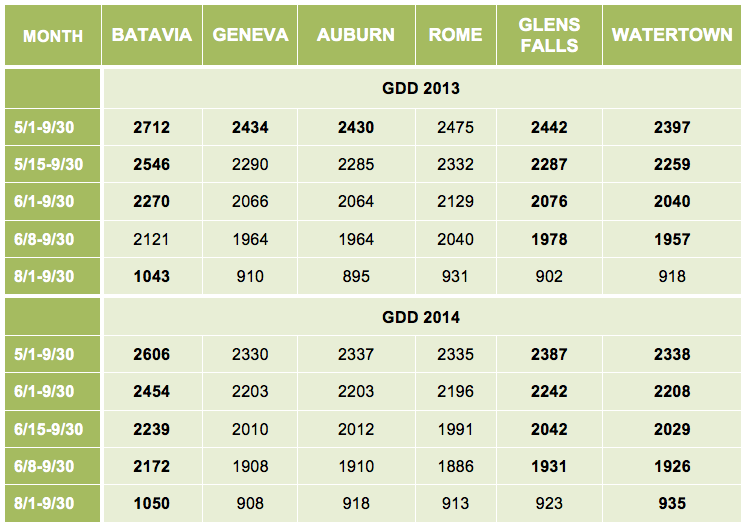
Corn and soybeans are typically planted sometime in May and mature from mid-to late September. Consequently, their growing seasons in NY are considered to occur from May 1 through September 30, with the understanding that an additional ~100 growing degree days (GDD) can be accumulated in October before the first fall frost; offsetting the loss of ~100 GDD from May 1 until either crop is planted. The 2014 growing season started slowly for both crops because of wet conditions during the first 20 days of May in most grain corn and soybean growing regions. Consequently, only 15% of corn and less than 1% of soybeans had been planted in NY by May 15th. The second half of May was dry in most regions so 58% of corn and 31% of soybean had been planted by June 1. By June 8th, 79% of corn and 46% of soybean had been planted by June 8th. Consequently, almost half of the NY corn crop (probably 75% of the grain corn crop) did not accumulate the typical 300 GDD that most grain corn and soybean regions receive in May. In addition, growing conditions were cool from mid-July though most of September and there were reports of isolated frost in some parts of the state on the morning of September 19th. So what is the outlook for grain corn and soybeans in NY in 2014?
In many respects, the 2014 growing season was similar to the 2013 growing season; mostly wet soil conditions in the spring and summer, followed by cool August and September conditions, and even a light frost in isolated pockets of the State in mid-September, although not in the major grain corn and soybean growing regions. So let’s examine both growing seasons and see if the 2014 crops will be similar to the 138 bushel/acre corn crop (3rd highest state average on record) and the 48 bushel/acre soybean crop (tied for the highest state average on record) in 2013. About 70% of the grain corn and 85% of NY soybeans are grown in western NY and the Finger Lakes regions so my discussion will mostly be in the context of the growing season in those regions.
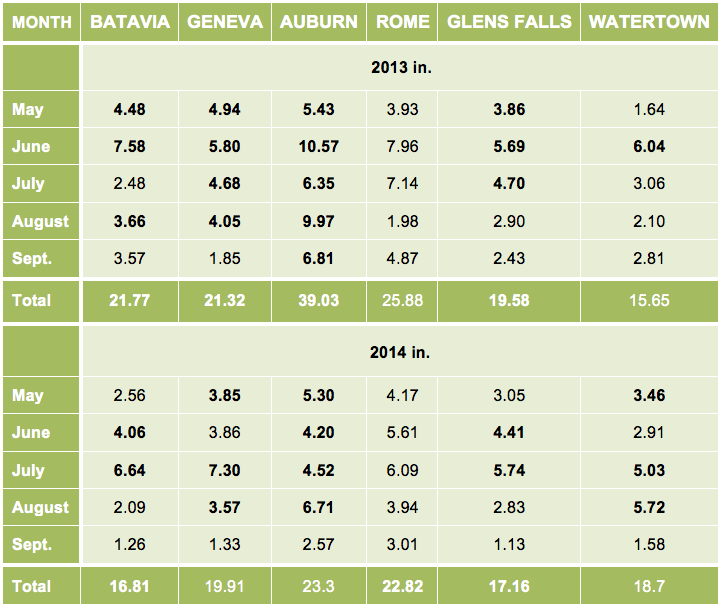
The second half of May and the month of June were exceedingly wet in 2013 (Table 1), resulting in drowned out grain corn in poorly drained areas of many fields. In addition, the somewhat poorly drained areas of most fields had stunted corn that was yellow during grain-filling because most of the pre-plant or at planting N fertilizer denitrified. Despite ideal growing conditions for the remainder of the 2013 growing season (more than adequate precipitation in July and August and below normal growing degree days from July 20 through September, Table 2), the damage had been done. So instead of the projected 150 bushel/acre grain corn yield ,based on grower surveys in October and November (who apparently were just looking at the high-yielding corn in the drained areas), the final crop came in at 138 bushels/ acre because of the early-season damage to the crop. Soybeans, on the other hand, are not quite as sensitive to wet soils in June and can fill in somewhat if gaps occur due to drainage problems. Consequently, soybean yields came in 1 bushel/acre higher than the projected 47 bushel/acre crop, based soybean grower surveys in October and November.
Table 1. Monthly and total precipitation during the 2013 and 2014 corn and soybean growing seasons. Bolded numbers indicate above-average precipitation compared with the 30 year mean (excluding Rome, which only has 9 years of data).
What about the 2014 crops? Well, the late planting of corn in 2014 may have been been a blessing in disguise (because both crops avoided the wet May conditions and most of the ensuing problems that the 2013 crops suffered from). Despite somewhat wet June soil conditions, only the poorly drained areas (and not the somewhat poorly drained areas of each field) suffered some stunting of growth and much less denitrification of pre-plant or at planting fertilizer N compared to the 2013 growing season. In addition, July was wet as was the first half of August in most regions so corn was essentially stress-free through the early grain-filling period. Some grain corn fields did encounter dry conditions during September but temperatures were cool so minimal stress would have been incurred. Likewise, soybeans never experienced any real drought stress in August and September because of the cool conditions. Consequently, based on soil and growing conditions in 2014, the September projected 2014 corn yield of 150 bushels/acre and a record soybean crop of 49 bushels/acre in NY might be right on.
But what about the late planting date for both crops, coupled with the perceived cool growing season? Will that hurt the 2014 corn crop and reduce the projected yield from 150 bushels/acre to 138 bushels/acre as in 2013? Believe it or not, western, eastern and northern regions of NY had above average growing degree days from June 1 through September 30 so delayed planting in those regions are not much of a concern (Table 2). In the Finger Lakes region, however, total GDD from June 1 until September 30 were about 100 below normal (Table 2), raising concerns about crop maturity. Most grain corn and soybean fields in Western NY and the Finger Lakes fortunately have not had a frost event and no frost is in the forecast through mid-October for those regions. In addition, both regions have already accumulated an additional 50-60 GDD through the first 5 days of October. Consequently, if the growers scaled back their hybrid maturity and the crop silked out by early August, enough GDD should have accumulated before a frost so grain corn should mature, albeit with delayed harvest well into November. If growers did not scale back their hybrid maturity when planting grain corn during the first week of June in the Finger Lakes, maturity could be an issue. Soybeans, on the other hand, respond more to photoperiod when planted in June so even if soybean growers did not scale back maturity, soybeans should make it (a 2.4 Maturity Group that we planted in a planting date study at Aurora on May 29 was at maturity or the R8 growth stage on October 1 and planted on June 11 was at the R8 growth stage on October 7th). So I am not concerned with maturity for most of the soybean crop.
Table 2. Growing Degree Days (GDD, 86/50 system) in 2013 and 2014 from four planting dates through September 30 and growing degree days from August 1 through September 30, which is typically the grain filling period for corn and the pod set and seed filling period for soybeans in NY. Bolded numbers indicate above average growing degree days compared with the 30 year mean (excluding Rome, which only has 9 years of data).
In conclusion, despite another very challenging and yes stressful year from a grower perspective (delayed planting in the spring and fear of potential frost in the fall), yields, according to the grower surveys in September, should come to fruition. The next report is due on October 10th , based on growers surveys in late September, and I hope that the isolated frost reports in the non-major grain corn and soybean growing regions don’t bias the yields down. In fact, light frosts occurred in isolated pockets of these regions on the morning of September 17th in 2013 (31 in Ithaca and Watertown), which escaped the September 19th frost of 2014 (32 in Ithaca and Watertown). So in many respects the 2013 and 2014 growing seasons, including the light September frosts in isolated pockets, were similar, which should bode well for soybean yields. For grain corn, the blessing in disguise of the delayed planting date probably reduced crop damage during vegetative growth compared to 2013,, resulting in 5-6% higher State yields or about 150 bushels/acre. We won’t really know until the crops are in the bin so let’s hope for a great harvest season for both crops.
Bianca Moebius-Clune, Margaret Ball, Harold van Es, Jeff Melkonian – School of Integrative Plant Science, Soil and Crop Sciences Section – Cornell University
Adapt-N is an on-line tool that provides location-specific, weather-adjusted nitrogen (N) recommendations for corn. At sidedress time, critical early-season weather that strongly influences actual N needs is incorporated into the recommendation. To accomplish this, the tool uses 1) a simulation model that was developed and calibrated through field research over several decades, 2) high resolution 2.5 x 2.5 mile daily temperature and precipitation information, and 3) soil and crop management information entered via a web interface on any internet-capable device. Adapt-N’s cloud-based environment (central data server, high security, and accessibility through desktop, laptop and mobile devices, future embedding in other farm software) offers a user-friendly experience.
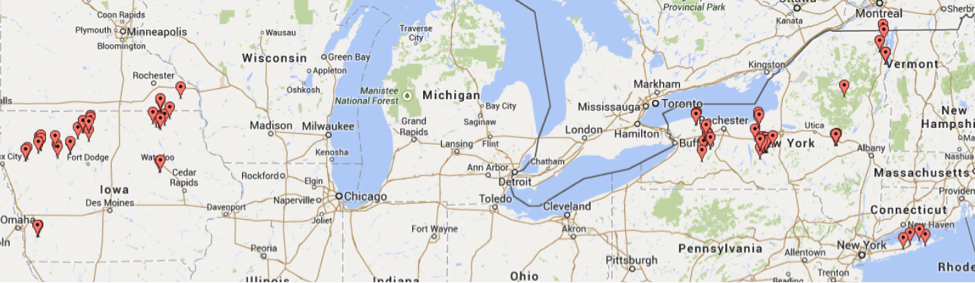
We conducted a total of 104 strip trials in 2011, 2012, and 2013 in New York and Iowa (Figure 1) to beta test Adapt-N for its ability to improve recommendations for corn N need at sidedress time. Yield data and simulated losses across trials show that the Adapt-N tool significantly increased grower profits, while decreasing N inputs and environmental losses, as summarized in this article. In 2014, Adapt-N was commercialized through a public-private partnership between Cornell University and Agronomic Technology Corporation (ATC, see http://www.adapt-n.com/). The partnership aims to sustain and broaden the tool’s availability, customer service, usability, and integration with existing farm management technologies, while allowing for continued research and development at Cornell University.
Methods
We completed 67 replicated strip trials in New York (14 in 2011; 42 in 2012; 11 in 2013) and 37 trials in Iowa (9 in 2011; 19 in 2012; 9 in 2013) on commercial and research farms throughout each state (Figure 1. One 2012 trial in Minnesota is included with the Iowa trials).
Figure 1. Map of 2011-2013 trial locations (map courtesy of batchgeo.com)
Sidedress treatments involved at least two rates of nitrogen, a conventional “Grower-N” rate based on current grower practice (G) and an “Adapt-N” recommended rate (A). An Adapt-N simulation was run for each field just prior to sidedressing to determine the optimum weather-adjusted N rate.
Table 1. Agronomic, economic and environmental assessment of model performance in 2012. Values are average differences resulting from Adapt-N use (Adapt-N minus Grower-N treatment) such that a negative number shows a decrease due to Adapt-N, a positive number shows an increase due to Adapt-N. *Simulated N leaching losses and N total losses do not include 2011 IA trials – data not available.
Yields were measured by weigh wagon, yield monitor, or in a few cases by representative sampling (two 20 ft x 2 row sections per strip). Partial profit differences between the Adapt-N and Grower-N practices were estimated using prices of $0.50/lb N, $5/bu grain, $50/T silage, and $8/ac operational savings if sidedress was avoided in either the Adapt-N or Grower treatment. Yields were used as measured, regardless of statistical significance, since the statistical power to detect treatment effects for a single experiment is inherently low.
Total N losses to the environment (atmosphere and water) and N leaching losses were simulated by Adapt-N for each N treatment, through the end of each growing season. End dates for N loss simulation were October 30, 2011 (NY trials only), December 15, 2012, and December 31, 2013.More detailed descriptions of each year’s methods and results were provided in previous WCU articles (Moebius-Clune et al., 2012, 2013, and 2014).
Agronomic and Economic Comparison
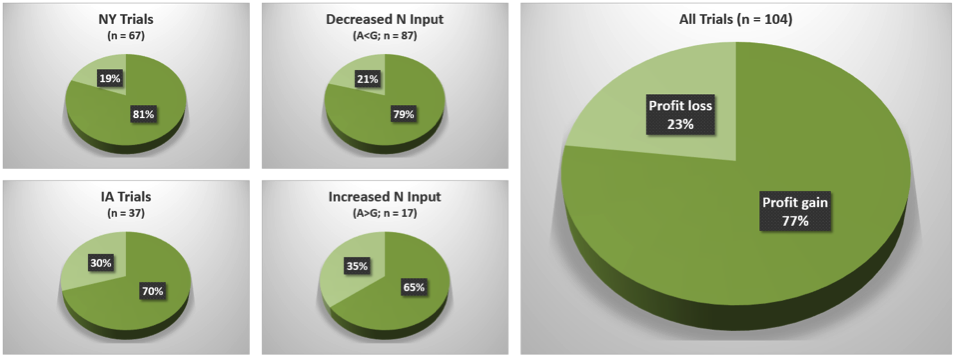
Adapt-N rates resulted in average N input reductions of 52 lbs/ac in NY, 29 lbs/ac in IA, and 44 lbs/ac overall (Table 1). Profit gains from the use of Adapt-N were considerable. Profits increased in 81% of all NY trials, in 70% of all IA trials, and in 77% overall when growers followed Adapt-N recommendations (Figure 2). Profit gains of $30/ac on average ($37/ac in NY, $17/ac in IA) were obtained most frequently due to reductions in N inputs, without significant yield loss: +1 bu/ac on average across all trials. Most collaborating growers were already using progressive N management including sidedressing, so that benefits achieved in these trials can be considered to be a conservative estimate of potential benefits of using Adapt-N. Benefits will be higher for growers who currently use few N best management practices.
Figure 2. Proportion of trials with profit gains (dark green) or losses (light green) as a result of using the Adapt-N recommendation compared to current grower N management in 2011-2013 trials. With appropriate use of the most up-to-date version of Adapt-N, success rates can be further improved.
Decreased N rates: Adapt-N recommended a lower N rate than grower practice in 84% of trials, by 60 lbs/ac on average (Table 1). Such recommendations occurred after a normal or dry spring, when N from spring mineralization or early fertilizer applications remains available to the crop. Yield losses were generally minor, averaging -2 bu/ac across trials with N reductions, and leading to profit gains in 79% of cases – on average $23/ac (Table 1, Figures 2 and 3). This implies that a grower is about four times more likely to achieve increased profit from a reduced Adapt-N rate than from their current higher rate. This statistic includes all trials over three years, although model improvements have been made each year based on trial information, such that actual probabilities of increased profit with reduced N inputs are likely further improved for future years.
Increased N rates: Even larger profit gains of $65/ac on average were achieved when Adapt-N recommended increasing N inputs over the grower’s current practice in 16% of trials. Consequent average yield increases of 17 bu/ac across these trials were achieved for an average additional 38lb/ac fertilizer application (Table 1). Such higher recommendations occurred primarily in 2013 ($94/ac profit on average in NY 2013 trials), and in select locations in other years, after a wet spring. Needs for additional N were correctly identified in 65% of these cases, resulting in significant yield and profit increases. In 35% of cases, on the other hand, the additional N was not needed. In almost all of these cases, unpredictable post-sidedress drought decreased yield potential below the expected yield that was used for the recommendation at the time the sidedress rate decision had to be made (Moebius-Clune et al., 2013).
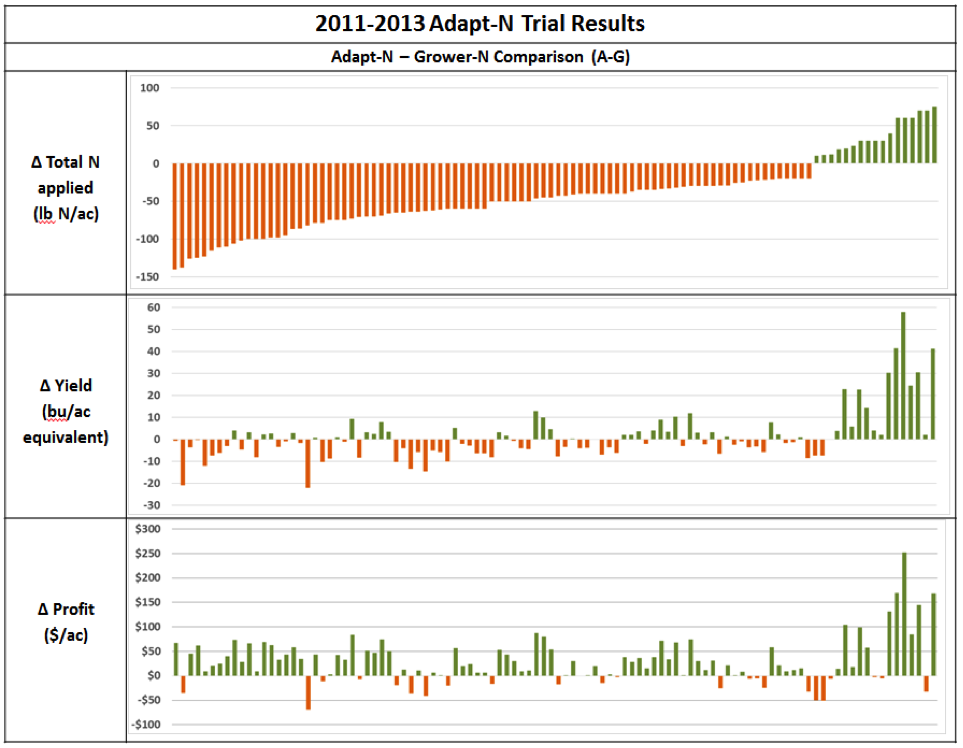
Profit loss when under-fertilizing (from reduced yields) is generally larger than when over-fertilizing (from unnecessary fertilizer application). Thus lower recommendations to account for potential future yield-limiting events cannot be justified for economical sidedress recommendations. By contrast, pre-sidedress weather events affecting yield potential and N availability are known, and Adapt-N can effectively manage this risk. Therefore, the chances of over-recommending N inputs are somewhat higher than those of under-recommending, further decreasing risk of profit loss. For illustration, overall, profit gains greater than $50/ac occurred in 29 cases, while losses greater than $50/ac were determined in only 2 cases (Figure 3).
Figure 3. Results from each trial (n = 104) are vertically aligned. Bars show difference between Adapt-N and Grower treatments (A-G) such that negative numbers (orange) show decrease due to Adapt-N, and positive numbers (green) show increase due to Adapt-N.
Environmental Benefits
Adapt-N reduced N rates in 84% of cases, by 60 lbs N/ac on average, resulting in simulated reductions in total N losses to the environment by the end of the growing season of 34 lbs/ac, and leaching losses by 10 lbs N/ac (Table 1). Further losses of residual excess N generally occur over the winter and spring months when crop uptake ceases, soil water is recharged, and saturation or near-saturation occur, particularly in the Northeast. Thus the simulated reductions are a low estimate of actual environmental loss reductions, which are likely closer to the difference in applied N. In 16% of trials, where Adapt-N increased N rates, by 38 lbs/ac on average, total N losses increased on average by only 16 lbs/ac, and leaching losses by 3 lbs/ac. Further over-winter losses in these cases are lower, because much of the additional applied N was taken up by the crop to produce the increased yield, and thus would not be lost.
Lessons for Expert Use of Adapt-N from three years in the field
Growers can decrease risk of N deficiency, environmental losses, and yield losses, and increase profit margins. To optimize Adapt-N use, we recommend the following:
Plan to apply the majority of fertilizer nitrogen at sidedress time instead of prior to or at planting. If manure is applied prior to planting or when enhanced efficiency products are used, aim for conservative rates.
Monitor the field’s N status and account for early season weather impacts on N availability by using Adapt-N’s daily updates.
Supply input information on soil and crop management that is representative of each management unit (e.g. test soil and manure based on representative samples, keep good records of operations, estimate expected yield as the second-highest out of 5 years of accurate yield information). For each management unit, measure soil organic matter at least every 3 years, ideally to a 12” depth.
If appropriate, adapt input information at the time of sidedressing to account for seasonal influences, such as decreased yield potentials or shallow rooting depths from extreme wet conditions.
Use the most recent Adapt-N recommendation available on sidedress day. Apply sidedress N between V6 and V12, depending on N and equipment availability. Generally, later sidedressing with high-clearance applicators allows for more accurate recommendations. Variable rate applicators can be used to adjust Adapt-N simulations for management units in fields.
Use Adapt-N scenario simulations after the growing season to learn more about how weather and management influence N availability.
In the long term, manage for healthy soils and use Adapt-N to account for N contributions from high organic matter levels and deep root zones.
Conclusions
Three consecutive growing seasons involving 104 on-farm strip trials demonstrate that Adapt-N is an effective tool for N management in corn systems, with average profit gains of at least $30/ac. With model improvements and increased expert use of the tool, we estimate that profit gains over current grower practices can be expected in at least four out of five cases. Adapt-N generally correctly identified cases when either decreased or increased N was needed to maintain yields. The tool also provides a strong incentive to shift N applications to sidedress time when weather impacts can be accounted for in the model. By using Adapt-N, growers can contribute to solving persistent problems with greenhouse gas emissions, groundwater pollution, and hypoxia in our estuaries, while increasing profits in both wet and dry years.
For more information: Recorded webinars, a manual, and other Adapt-N training materials are available at http://adapt-n.cals.cornell.edu/. The Adapt-N tool is accessible through any device with internet access, now from the team’s commercial partner, Agronomic Technology Corporation, at http://www.adapt-n.com/ (cost is about $1-3/ac, depending on area covered). Adapt-N users can elect to receive email and/or cell phone alerts providing daily updates on N recommendations and soil N and water status for each management unit in Adapt-N.
Acknowledgements: This work was supported by funding from the NY Farm Viability Institute, the USDA-NRCS Conservation Innovation Program, the International Plant Nutrition Institute, McKnight Foundation, Walton Family Foundation, USDA-NIFA, MGT Envirotec, and USDA-SARE. We are grateful for the cooperation in field activities from Keith Severson, Kevin Ganoe, Sandra Menasha, Joe Lawrence, Anita Deming, Harry Fefee, Kitty O’Neil, Mike Hunter, and Brent Buchanan of Cornell Cooperative Extension, Bob Schindelbeck of the Cornell Section of Soil and Crop Sciences, Mike Davis at the Willsboro Research Farm, Dave DeGolyer, Dave Shearing and Jason Post at Western NY Crop Management Association, Eric Bever and Mike Contessa at Champlain Valley Agronomics, Eric Young at Miner Institute, and Peg Cook at Cook’s Consulting in New York, and from Shannon Gomes, Hal Tucker, Michael McNeil, and Frank Moore at MGT Envirotec. We also are thankful for the cooperation of the many farmers who implemented these trials on their farms.
Jaime A. Cummings and Gary C. Bergstrom – School of Integrative Plant Science, Plant Pathology and Plant-Microbe Biology Section – Cornell University
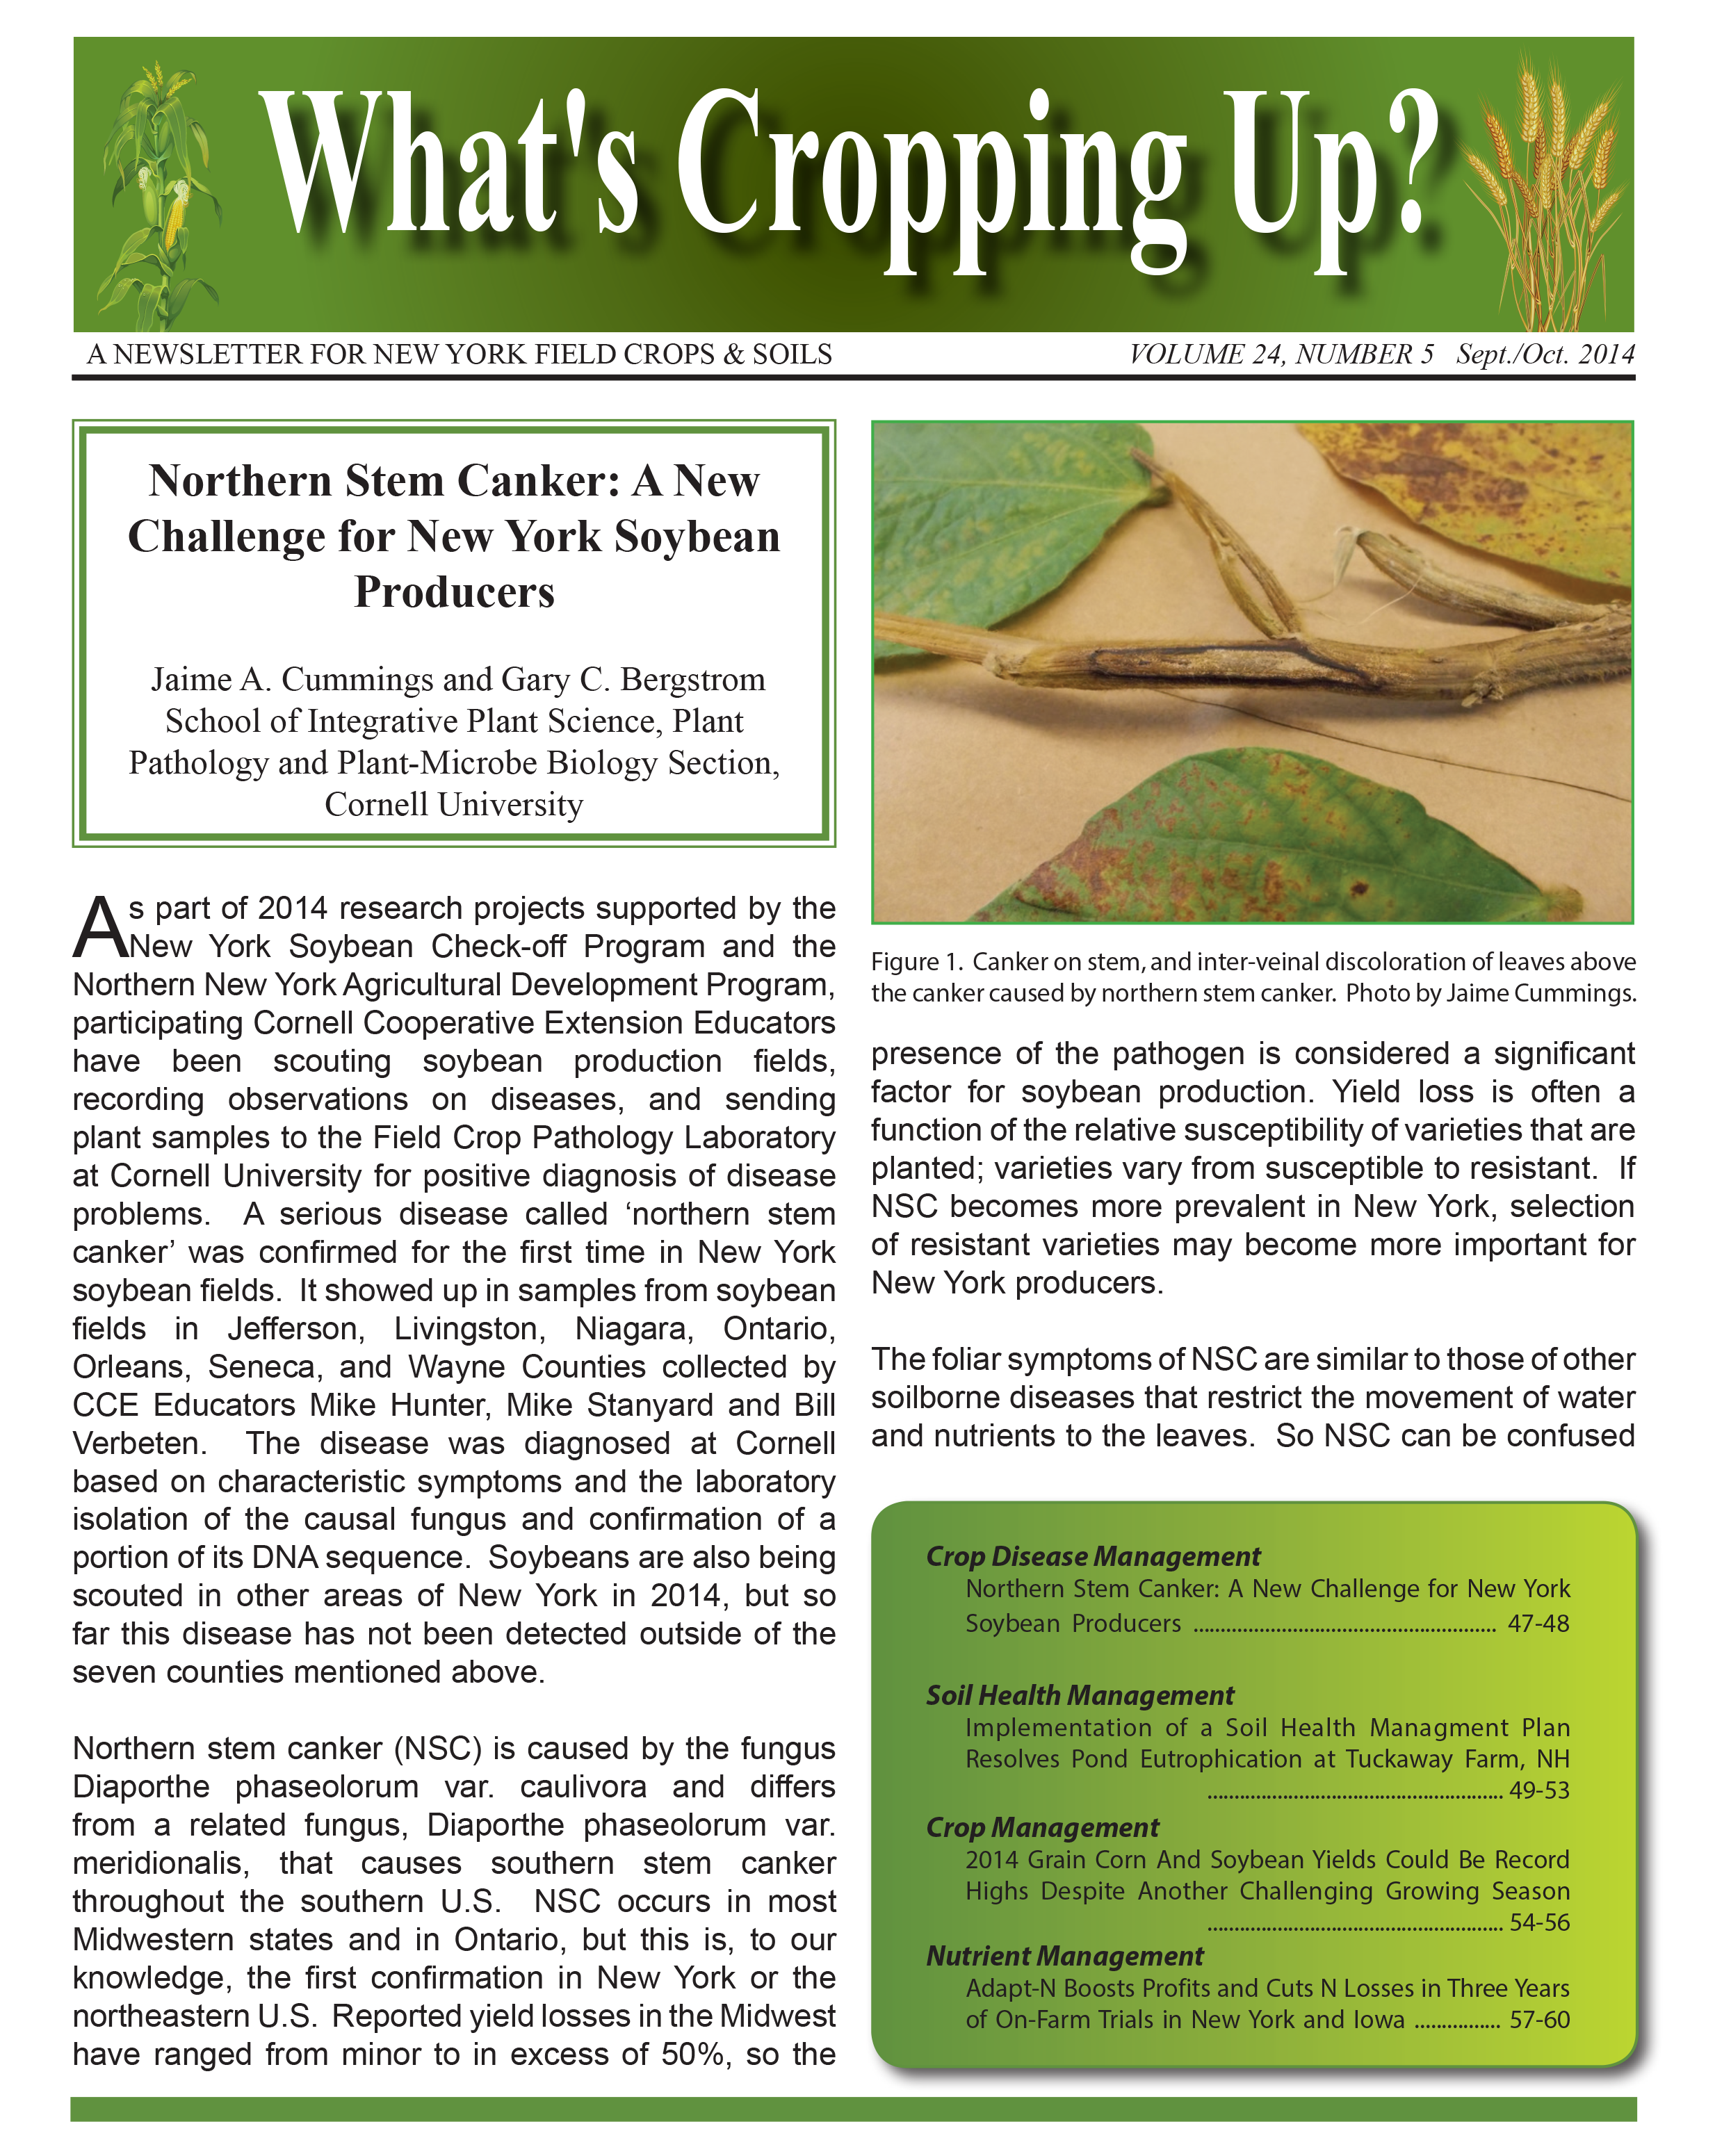
Figure 1. Canker on stem, and inter-veinal discoloration of leaves above the canker caused by northern stem canker. Photo by Jaime Cummings.
As part of 2014 research projects supported by the New York Soybean Check-off Program and the Northern New York Agricultural Development Program, participating Cornell Cooperative Extension Educators have been scouting soybean production fields, recording observations on diseases, and sending plant samples to the Field Crop Pathology Laboratory at Cornell University for positive diagnosis of disease problems. A serious disease called ‘northern stem canker’ was confirmed for the first time in New York soybean fields. It showed up in samples from soybean fields in Jefferson, Livingston, Niagara, Ontario, Orleans, Seneca, and Wayne Counties collected by CCE Educators Mike Hunter, Mike Stanyard and Bill Verbeten. The disease was diagnosed at Cornell based on characteristic symptoms and the laboratory isolation of the causal fungus and confirmation of a portion of its DNA sequence. Soybeans are also being scouted in other areas of New York in 2014, but so far this disease has not been detected outside of the seven counties mentioned above.
Northern stem canker (NSC) is caused by the fungus Diaporthe phaseolorum var. caulivora and differs from a related fungus, Diaporthe phaseolorum var. meridionalis, that causes southern stem canker throughout the southern U.S. NSC occurs in most Midwestern states and in Ontario, but this is, to our knowledge, the first confirmation in New York or the northeastern U.S. Reported yield losses in the Midwest have ranged from minor to in excess of 50%, so the presence of the pathogen is considered a significant factor for soybean production. Yield loss is often a function of the relative susceptibility of varieties that are planted; varieties vary from susceptible to resistant. If NSC becomes more prevalent in New York, selection of resistant varieties may become more important for New York producers.
Figure 2. Internal and external stem symptoms caused by northern stem canker. Photo by Jaime Cummings.
The foliar symptoms of NSC are similar to those of other soilborne diseases that restrict the movement of water and nutrients to the leaves. So NSC can be confused with brown stem rot and sudden death syndrome, all of which result first in yellowing and then browning of leaf tissues between the veins during pod-filling stages. What is distinctive about NSC is the stem lesions called cankers that form near nodes and often girdle the stem, resulting in wilting and necrosis above the canker (Figure 1). Dead leaves remain attached to the plant and turn blackish. Cankers often have a reddish margin and gray center (Figures 1 & 2). Symptoms in the interior stem initiate as a slight browning at the nodes and then may progress to complete browning and deterioration of the pith, while the roots remain symptomless (Figure 2). Necrotic stem symptoms may be confused with those caused by white mold or Phytophthora stem rot.
Infection by the fungus occurs early in the season, from spores splashed by rain from the soil to the stems; rainfall and warm temperatures favor epidemics. Because infection occurs at early stages (around the three leaf stage) of the crop, foliar fungicides applied during flowering and pod-filling stages will not be effective in suppressing NSC.
The fungus survives on soy residues in the field for many years, and produces its infective spores on these residues. Some research suggests that other legume crops such as alfalfa and a number of weed species can harbor the fungus between soybean crops though the importance of these associations is not well established. Deep plowing of infected soybean residues and multiple year rotations with corn or small grains may reduce the potential of NSC in a subsequent soybean crop. The pathogen can also survive in and be transmitted by infected seed, such that fungicidal seed treatment can reduce the chances for introducing the pathogen into new fields.
The most important thing that a New York soybean producer can do at this time is to learn to recognize the symptoms of NSC and other soilborne diseases and to get a diagnosis of problems that they observe in their fields. If NSC or other soilborne diseases are confirmed, producers should talk to their seed supplier and order soybean varieties with appropriate levels of resistance for the soilborne diseases observed on their farm.
Acknowledgements: This research received financial support from the New York Soybean Check-off Research Program, the Northern New York Agricultural Development Program, and Cornell University Hatch Project NYC153473.
Bianca Moebius-Clune, Dan Moebius-Clune, Robert Schindelbeck, Harold van Es – Section of Soil and Crop Sciences, Cornell University; Dorn Cox – GreenStart; Brandon Smith – NH NRCS
Dorn Cox manages Tuckaway Farm, his family’s 250 acre multi-generational diversified organic operation in Lee, NH. He is also a PhD Candidate at the University of New Hampshire, and director of GreenStart, an educational non-profit organization set up to foster a resilient food and energy system in New Hampshire by providing technical education and practical agricultural examples. Dorn discovered that the Cornell Soil Health Test was available in 2009, while discussing soil testing with Brandon Smith, State Agronomist of the NH NRCS. “It was a good fit for GreenStart’s mission and I was excited, because the test not only incorporated biological, physical, and chemical indicators, but it also presented an approach for land management planning and adaptive management.“ In the spring of 2010 he submitted his first samples.
A collaborative project was initiated among partners at NH NRCS, Cornell, Greenstart, NH Conservation Districts, and NH farms in four counties. The goal was to develop a framework for a soil health test-informed Soil Health Management Plan (SHMP), analogous with the NRCS’s Nutrient Management Plan, but with biological and physical test results to be considered, in addition to standard soil test results. Additionally the project set out to build local equipment infrastructure to enable soil health management through education and equipment rentals, and to demonstrate implementing these plans.
Tuckaway Farm became the first test case for the new planning and implementation framework. Through the particular resource concerns identified, this case became strong evidence for the need to move beyond Nutrient Management Planning, to Soil Health Management Planning. Implementation of a targeted set of soil health management practices has now resolved eutrophication problems that had made the farm irrigation pond unusable for recreation since 2009.
Background: from Soil Health Testing to Planning to Implementation
Soil health constraints beyond nutrient deficiencies and excesses currently limit agroecosystem sustainability, resilience to drought and extreme rainfall, and progress in soil and water conservation. The Cornell Soil Health Assessment (http://soilhealth.cals.cornell.edu/), makes it possible to identify and explicitly manage constraints. Available to the public on a fee-for-service basis since 2006, it provides field-specific information on constraints in biological and physical processes, in addition to standard nutrient analysis.
A more complete understanding of soil health status can better guide farmers’ soil management decisions. However, so far, there had been no formalized decision making process for implementing a soil health management system that alleviates field-specific constraints identified through standard measurements and then maintains improved soil health. We created a framework for developing Soil Health Management Plans (SHMP) for a farm operation, including:
A detailed listing of management suggestions specific to each indicator showing constrained soil functioning, and relevant NRCS cost-shared practices that could be applied to address the resource concerns identified through a soil health assessment.
A new Cornell Soil Health Assessment report format that more explicitly provides initial interpretation, prioritization, and management suggestions, from which a SHMP can then be developed.
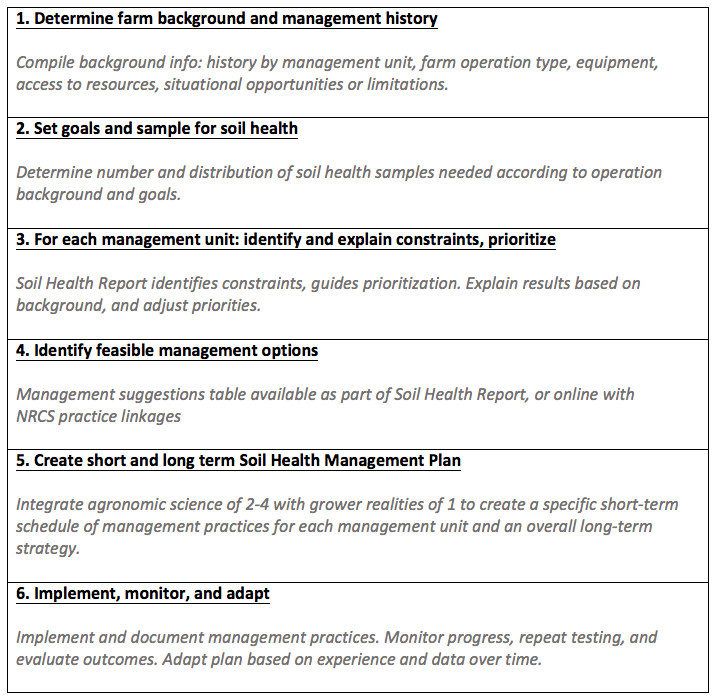
Six general steps for the planning and implementation process (Figure 1).
A pilot SHMP template for such plans that includes purpose, site information, assessment results and interpretation, and planned practices via a multi-year management calendar outlining a specific plan for each field.
We developed a pilot multi-field SHMP using this framework at Tuckaway Farm, owned and operated by the Cox family for over 30 years, and at 17 additional NH operations. The purpose of this case study is to share the outcomes achieved in one of Tuckaway Farm’s fields, and suggests, based on this example, that a broader soil health assessment-based planning approach is necessary to maintain our nation’s most vital resource: our soil.
Figure 1. Soil Health Management Planning Process Overview
Planning, implementation and evaluation for a field at Tuckaway Farm in 6 steps
1. Farm background and management history
Dorn and his father Chuck tell the story of a 30 year evolving family endeavor. Much of the land has been in long-term continuous organic hay for off-farm sales, with limited use of inputs such as wood ash and horse manure. The farm has added vegetable rotations and fruit over the years, and more recently dairy, eggs, meat, grains, and oils, among other products, all with organic certification. A Comprehensive Nutrient Management Plan determined that net nutrient exports off the farm were causing nutrient deficiencies in many long-term hay fields. The land base can potentially sustain a much larger number of animals. Management change has sped up since about 2009, with additional products being developed, experimentation with reduced tillage, cover crops, and rotational grazing, and a decrease in hay export as the younger generation farmers are building animal-based enterprises. Diverse equipment, owned by the farm, Greenstart, and the county conservation district, is available.
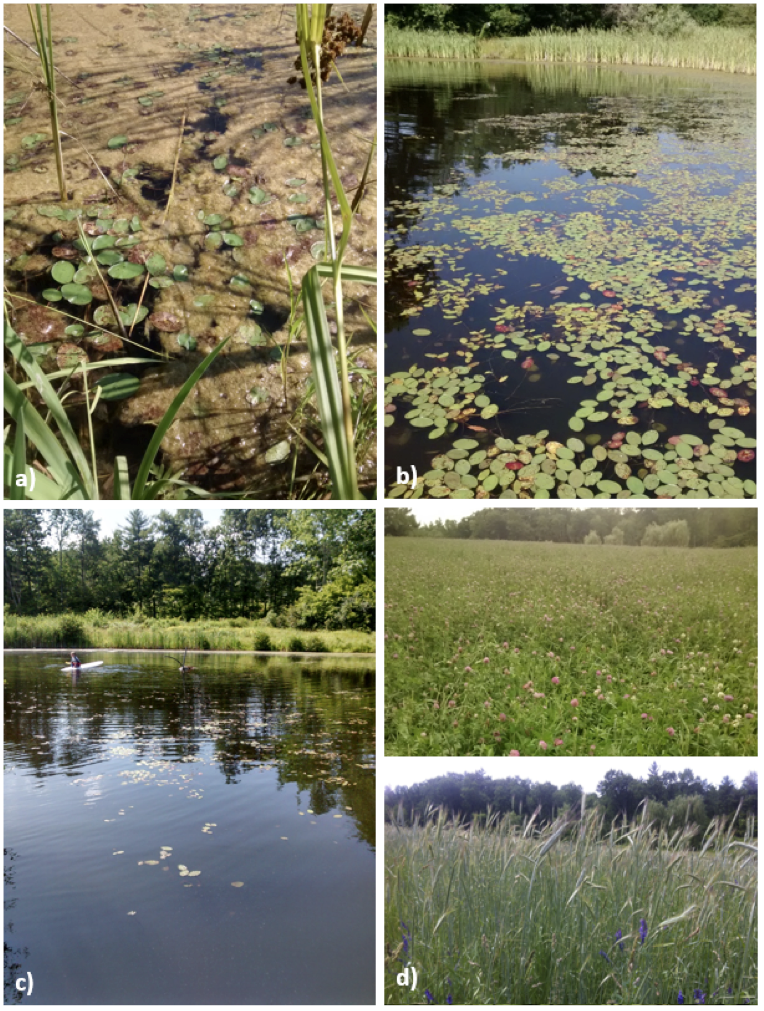
The Pond Field, the subject of this case study, is a long-term hay field, occasionally grazed outside of the CNMP-required buffer strip around the pond’s perimeter. The field’s soil is an inherently well-drained but easily eroded Hollis-Gloucester fine sandy loam of mostly 8-15% slope that levels near the pond at the bottom of the slope. Forage growth was mediocre, and legume content was very low, when the field was assessed for the project in spring of 2012. Dorn Cox noted that the pond had previously served as their swimming pond. It had become overgrown with algae since 2009, indicating excess phosphorus availability in the water (Figure 2), despite the fact that manure-spreading buffers were attended to in accordance with their CNMP.
Figure 2. Pond field. At initial assessment in spring 2012, the former recreational pond was eutrophic. Heavy algal growth was visible at the edges (a). Grass forage growth was of low vigor, and forage legume content was very low (b). Photo credits: Dorn Cox and Bianca Moebius-Clune
2. Goals and sampling
Goals for the farm included improving soil health, productivity, on-farm nutrient and carbon cycling, and long-term sustainability, and regaining use of the pond for recreational purposes. A number of representative fields on the farm were sampled to assess baseline status and to guide changes in management as the enterprises evolve.
3. Constraints: identified, explained, and prioritized
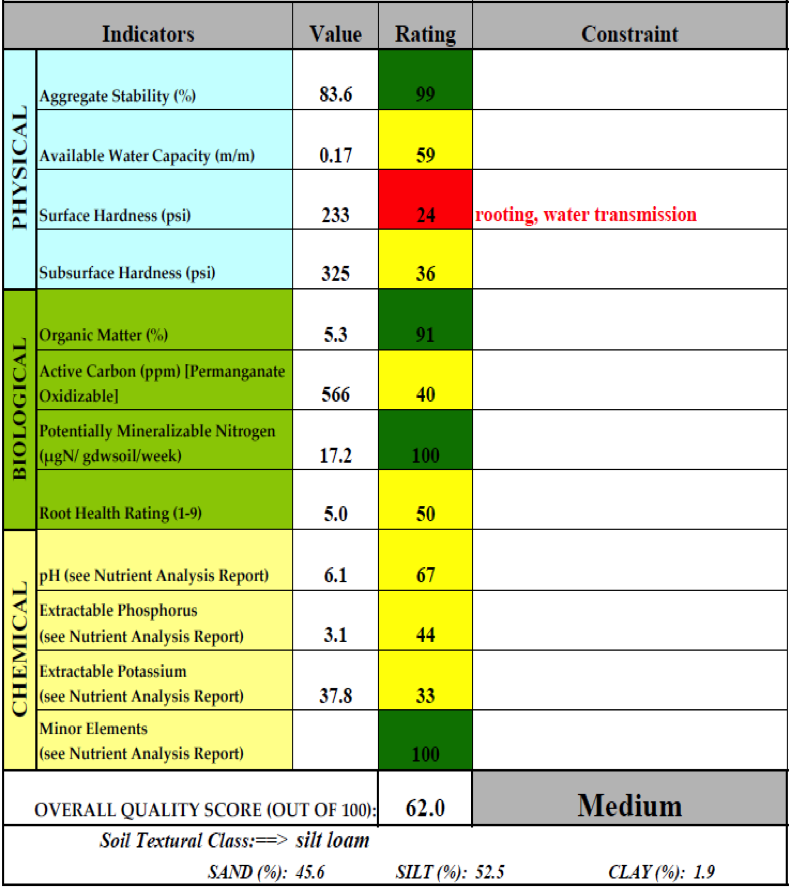
Overall, soil health at Tuckaway Farm was found to be medium to high, with generally high total organic matter and aggregate stability due to low tillage and long-term perennial forage growth. However, compaction was a prominent soil constraint. Severe surface compaction and suboptimal subsurface hardness were identified as factors driving decreased soil functioning and low current plant vigor in Pond Field (Figure 3), likely due to traffic on wet soils during haying and grazing. Active carbon was suboptimal or constraining in every field, likely resulting from low plant vigor and thus low fresh root and shoot contributions to soil organic matter. P, K and pH were suboptimal in many fields, including Pond Field, further contributing to low plant vigor and low legume content. Eutrophication problems from excessive P inputs into the pond were thus clearly not due to high soil P. Rather eutrophication was explained by poor physical and biological soil health. Severe compaction on a grazed slope with suboptimal vegetation growth was causing excessive runoff during rain events, and thus water quality problems.
Figure 3. 2012 Cornell Soil Health Assessment for Pond Field shows that compaction drives the lack of soil functioning observed for this field, with suboptimal nutrient and pH conditions contributing to poor plant growth, which in turn explains suboptimal active carbon availability.
4. Feasible management options
Surface and deep targeted soil disturbance were identified as feasible and most promising options (see table of management suggestions) for alleviating compaction. Improved selection of cover and pasture crop species was considered secondary for this constraint, based on low vigor and the need to jump-start the system through initial loosening of the soil, but these selections were deemed essential for improving and maintaining biological activity in the longer term. Woodash and manure were identified as the most feasible immediate ways to address nutrient and biological activity constraints. It was noted that bedrock for the soil type is generally at 10-20”, so that improving water dynamics and preventing erosion was particularly important, but that bedrock proximity might cause challenges for mechanical compaction management in some areas.
5. Short and Long Term Soil Health Management Plan
The short-term management calendar included the following immediate remediation in August of 2012:
Deep ripping with the available Yeoman’s plow along slope contours (30” spacing, to maximum depth possible considering bedrock), to alleviate subsoil compaction, low infiltration, and erosion issues.
Interseeding tillage radish or similar deep rooted fall brassica in order to keep soil pores open, implemented in the same pass as the above if feasible.
Woodash application followed by aerway incorporation to address suboptimal K, P, and pH, along with surface compaction.
A combination of rotational grazing or haying during appropriate soil moisture conditions was recommended. Grazing was to be followed with aerway incorporation of manure to increase soil P and decrease chances of erosion. Interseeding of additional species, such as warm season annual forages (sorghum sudangrass or forage soybean) during 2013 was planned to increase biomass production and thus biological activity. Monitoring compaction levels and possible follow-up with further mechanical alleviation was planned for subsequent years.
6. Implement, monitor, and adapt
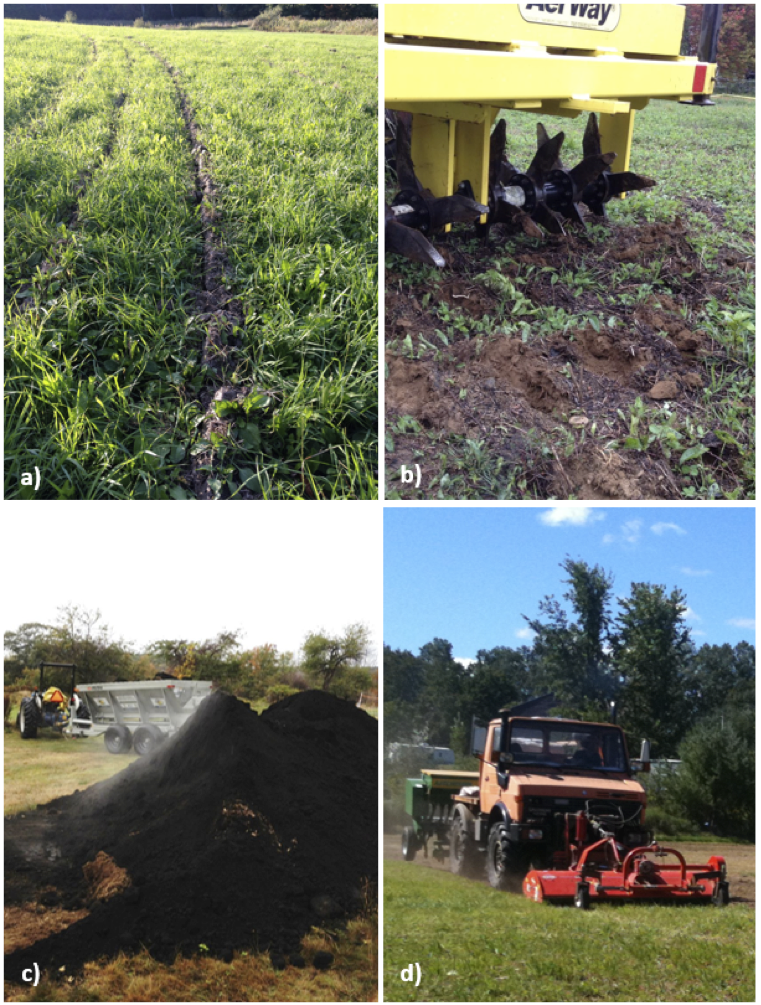
Implemented Practices: The plan was implemented with some adaptations due to farm scheduling, weather constraints and equipment availability (Figure 4). Yeoman’s plow and aerway with one hole offset were used according to plan, but no woodash was applied, nor were additional crops interseeded in the fall of 2012. The three shank yeoman’s plow was set to 20” depth and 30” spacing between shanks, followed by the aerway with one-hole offset on the same day. All grazing was stopped on the slopes above the pond starting in 2012. Two cuts of dry hay were taken during the summer of 2013. The wet 2013 spring delayed woodash delivery and spreading until after the second cut hay was removed, and the spreader was available for covering multiple fields. Woodash was surface spread in October 2013 using the conservation district’s Stolzfus wet lime and woodash spreader loan program. The slope above the pond was then seeded to a hairy vetch, winter rye, wheat, barley mix in a single pass cultivation using a Unimog U1200 tractor with a front mounted Howard rotovator set to 3”, and rear mounted Great Plains no-till drill. The mix was planted to address surface compaction for improved infiltration, as well as to produce one of multiple potential crops depending on needs at harvest: feed grain, cover crop seed (usable as on-farm custom winter mix, or separable with the farm’s spiral separator), or a single cut of legume mix dry hay harvestable in late August of 2014.
Figure 4. Soil Health Management Plan Implementation: Deep ripping with a yeoman’s plow along the slope’s contours (a) to alleviate subsoil hardness, followed by Aerway treatment (b) to alleviate surface hardness in the fall of 2012. Wood ash application to alleviate low pH, and K and P deficiencies (c), followed by single pass shallow rotovator cultivation and seeding of grain-vetch mix (d) to further alleviate surface compaction and produce crop. Photo credits: Dorn Cox and Bianca Moebius-Clune
Observed Results: Prior to implementation in 2012, significant runoff was evident during rain events. Algal growth (Figure 5a) prevented use for recreational purposes. Water flow from the slope during rainfall was noticeably reduced after deep rip and aerway treatments, despite the wet 2013 spring, and the pond started to clear and became usable for recreation in 2013. Runoff reduction appeared even greater post grain-vetch-mix planting in the fall of 2013, and the pond’s water quality continued to improve into the 2014 summer season (Figure 5b, 5c). The effect of wood ash was evident in the spring of 2014 as vigorous clover growth returned to the field, and the grain-vetch mix grew with satisfactory vigor (Figure 5d). Progress in crop productivity and pond water quality will be monitored further.
Figure 5. Heavy algal growth as was seen along the pond’s perimeter in 2012 (a). Clear water (b), regained recreational use (c), and improved legume content and satisfactory crop vigor (d) after implementation of the first ~ 20 months of a situationally adapted Soil Health Management Plan. Photo credits: Dorn Cox and Bianca Moebius-Clune
Conclusions
In this case-study, a targeted set of soil health management practices were implemented to alleviate previously unidentified compaction, in addition to interacting minor biological and chemical constraints. These treatments have resolved eutrophication problems in a pond that can now again be used for recreation. This case demonstrates strong evidence for the need to move beyond simple Nutrient Management Planning, to more comprehensive Soil Health Management Planning. We illustrate interactions between nutrient-related constraints and biological and physical limitations in soil conditions: in this case the lack of infiltration from compaction and poor rooting allow for simultaneous occurrence of nutrient deficiencies in soil and nutrient excesses in water. We further illustrate the limitations of applying prescribed best management practices (e.g. buffers), as opposed to using environmental monitoring and systems indicators to provide feedback for adaptive nutrient management. Biological and physical constraints must be explicitly identified through soil health assessment, and managed comprehensively alongside nutrient-related constraints. Management must be adapted in response to seasonal conditions and observations, in order to achieve satisfactory progress in soil and water conservation.
Acknowledgements
We would like to acknowledge funding received from a NH NRCS Conservation Innovation Grant, a Specialty Crops Block Grant, from the NH Charitable Foundation, and from NY Hatch, which enabled completion of this project. We would also like to acknowledge the collaboration of NH NRCS and Soil and Water Conservation District staff, and of additional NH growers, who helped inform the development through their participation in the planning process and contribution of diverse farm scenarios to test the flexibility of the framework.


 such that a negative number shows a decrease due to Adapt-N, a positive number shows an increase due to Adapt-N.")