What’s Cropping Up? Volume 30 No. 2 – March/April 2020 Now Available!

New York State Soil Health Characterization | Part I: Soil Health and Texture

Joseph Amsili, Harold van Es, Bob Schindelbeck, and Kirsten Kurtz
Soil and Crop Sciences Section, Cornell University

Take-aways:

    • Soil biological indicators (organic matter, active carbon and respiration) were higher in finer textured soils than coarser textured soils, but organic matter quality was higher in coarser textured soils.
    • Soil texture exerted a strong control on a soil’s available water capacity.
    • Organic matter improvements are more likely to increase available water capacity in coarse textured soils compared to fine textured categories.

As progress is made in characterizing the biological and physical health of soils nationwide, soil health labs will be able to develop regionally specific scoring functions that correspond to inherent differences in soil properties and processes, which are shaped by the complex interplay of local climate, geology, biology, and time. The Cornell Soil Health Program has recognized this need and is developing scoring functions by region, soil type, and cropping system. Naturally, we have begun these efforts by focusing on New York State soils. In this first preview of the New York State Soil Health Characterization Report, we focus on the effects of soil texture on biological and physical soil health parameters. Stay tuned for the full technical report, titled “New York State Soil Health Characterization Report”, which will be published soon.

Methods
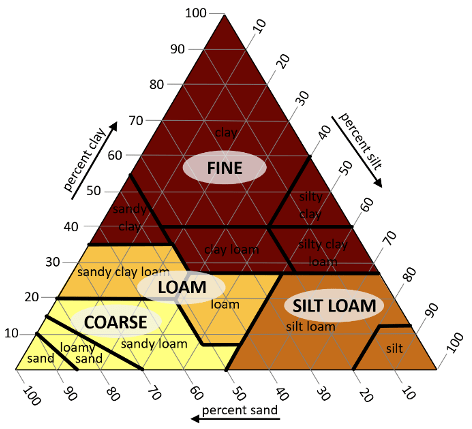
The Cornell Soil Health Laboratory analyzed 1,456 samples from across New York State between 2014-2018. Soil samples were analyzed for the standard Comprehensive Analysis of Soil Health (CASH) package, which included two physical indicators – wet aggregate stability (AgStab), and available water capacity (AWC); four biological indicators – soil organic matter (SOM), active carbon (ActC), autoclavable citrate extractable protein (Protein), and respiration (Resp); and seven chemical measurements. Results were summarized by four textural groups: coarse, loam, silt loam, and fine (Figure 1). Additionally, NY SH results were compared across five cropping systems which included annual grain, dairy system, process vegetables, mixed vegetables, and pasture (Part II will include a summary of the effects of cropping systems on soil health).

Soil texture chart
Figure 1. Soil health indicators were characterized by coarse (sand, loamy sand, sandy loam), loam (sandy clay loam, loam), silt loam (silt loam, silt), and fine (sandy clay, clay loam, silty clay loam, silty clay, clay) texture groups.

Results and Discussion
Soil texture is a dominant inherent soil property that exerts strong controls on a soil’s ability to function. Specifically, soil texture influences the amount of storable carbon and nutrients, a soil’s water holding capacity, erodibility, and drainage, and the habitat that soil provides to organisms. In order to evaluate the impacts of human land management (tillage, crop rotation, organic amendments) on the soil, it’s critical to understand the effects of the underlying inherent soil properties, like soil texture, on these soil health parameters.

Effects of soil texture on biological soil health indicators

Soil texture influences the quantity and quality of organic matter a soil can hold. Soils with higher concentrations of silt and clay (fine-textured) can store more organic matter than sandy (coarse-textured) soils due to the large amount of surface area available to bind with organic molecules. In the NYS database, SOM, ActC, and Resp were highest in fine textured soils, followed by silt loam, loam, and coarse textured soils. Fine textured soils in fact had 79%, 59%, and 56% higher SOM, Resp, and Act C than coarse textured soils, respectively (Table 1). Protein did not follow the pattern of an increasing concentration in finer texture groups. This is likely because it is more difficult to extract proteins from soils with high amounts of clay. Additionally, two ratios, Protein/SOM and ActC/SOM, exhibited lower values in finer textured soils (data not shown), which also suggests a lower ability to extract protein and active carbon in fine textured soils despite high OM levels. Alternatively, it suggests higher proportions of higher-quality organic carbon and nitrogen relative to the stable organic matter, i.e., relatively more “fresh” organic matter than stable mineral-bound organic matter in coarse textured soils.

Biological soil health indicators table

Effects of soil texture on physical soil health indicators

Soil texture exerts a dominant control on a soil’s available water capacity, which is the amount of water that a soil can hold and make available to plants. Coarse textured soils store the least amount of water because large pores between sand particles are unable to hold on to water against gravity. Specifically, as sand content increases, AWC goes down (r = -0.70). In contrast, clayey soils can store the most water, but some of that is tightly held in micropores and plants can’t access it. Therefore, soils with intermediate textures, like silt loams and to a slightly lesser extent loams, are known to store the most plant available water. We indeed found that silt content was positively correlated with AWC (r = 0.72), and silt loams and silty clay loam soils had the highest AWC. Silt loam soils had 273%, 139%, 47%, 28%, higher AWC than sand, loamy sand, sandy loam, and loam soil textures (Figure 2).

The strong textural control on AWC has implications for trying to improve a soil’s AWC with sustainable soil management strategies. The claim that, “one percent of organic matter in the top six inches of soil would hold approximately 27,000 gallons of water per acre” is often used to promote soil organic matter management. While this number is likely an over exaggeration of reality as evidenced by a recent study by Libohova, et al, 2018, who found that this number was closer to 2,850 gallons of available water stored per acre, it is true that increasing SOM is an important strategy to increase AWC. Furthermore, our research and other’s research show that SOM was more strongly related to AWC in coarse textured soils (r = 0.48) compared to loam (r = 0.14) or silt loam (r = 0.12) textured soils. This finding demonstrates that improved organic matter management can lead to increases in AWC in coarse textured soils to a much greater extent than for silt loams or finer soil textures.

Available water capacity chart
Figure 2. Bar chart of mean AWC for different soil texture classes. Error bars represent 1 SD of the mean. Unlike the other soil health indicators in the Cornell Soil Health Test, AWC was highly related to soil texture to the degree that more texture classes were required to understand the effect of soil texture on AWC.

Conclusions
Soil texture is a critical inherent soil property that exerts strong control on a soil’s ability to function, including its potential to store organic matter and retain plant available water. For biological indicators, SOM, ActC, and Resp values were higher in finer texture groups. Furthermore, AWC, an important physical indicator, was strongly controlled by texture. Our data suggest that coarse textured soils with low inherent AWC respond to increases in SOM to a much larger degree than silt loam soils. This NYS soil health database analysis demonstrates that soil texture is an essential variable to include in developing soil health targets at the policy or conservation planner level. Stay tuned for the full technical report titled, “New York State Soil Health Characterization Report” and for part II in the next WCU issue on the effects of cropping system on soil health indicators.

Acknowledgements
We acknowledge support from the New York State Environmental Protection Fund (administered through the Department of New York Agriculture and Markets).

Print Friendly, PDF & Email

What’s Cropping Up? Volume 29, Number 2 – March/April 2019

Soil Health Indicators Can Be Correlated to Agronomic Management and Crop Yield

Joseph Amsili, Harold van Es, and Bob Schindelbeck
Soil and Crop Section, School of Integrative Plant Science, Cornell University

Take-aways:

  • Soil health metrics were sensitive to long-term tillage practices.
  • Biological indicators related to labile carbon and nitrogen were best correlated with crop yields.

Soil health has been defined as the “the capacity of the soil to function as a vital living ecosystem that sustains plants, animals, and humans” (NRCS). The soil health concept recognizes that biological, physical, and chemical constraints must all be addressed for the soil to reach its full potential. Soil health assessment has become a powerful tool to diagnose biological and physical constraints in addition to the more traditionally measured chemical limitations (nutrients and pH).

In 2017, Roper et al. published an article using Cornell University’s Comprehensive Analysis of Soil Health (CASH) approach to link soil health indicators to different agronomic management systems in North Carolina. The results from this experiment allowed us to explore the linkages between soil health and yield, which has remained an important gap in the soil health literature.

Methods

Soil samples were collected from three long-term experiments (20+ years) in the coastal plain, piedmont, and mountain physiographic regions of North Carolina. Samples were sent to Cornell University to be analyzed for the standard CASH package, which includes two physical indicators – wet aggregate stability (AgStab), and available water capacity (AWC); four biological indicators – organic matter (OM), active carbon (ActC), autoclavable citrate extractable protein (Protein), and respiration (Resp); and seven chemical measurements (pH, and extractable P, K, Mg, Fe, Mn, and Zn). The results were made available in a supplemental table in the Roper et al. paper and re-analyzed by us.

Results and Discussion

Sensitivity of Soil Health Measurements

The coastal plain and mountain region experiments involved different tillage practices combined with organic vs. conventional management. When the CASH values were analyzed, we found  significant differences in AgStab, ActC, P, and Zn at each site (Table 1), while the mountain site also showed differences in Protein and several other chemical indicators. The effects on chemical indicators were primarily related to the organic vs. conventional treatments as compost applications tended to increase nutrient levels. But the physical (AgStab) and biological indicators (ActC and Protein) were mostly influenced by tillage practices.

The piedmont experiment involved different levels of tillage intensity including moldboard plowing, chisel-till and no-till, and almost all CASH indicators were affected by the treatments (Table 1). Over all three sites, no-till treatments had higher soil physical and biological indicators than conventional tillage (data not shown).  These findings are in agreement with many other studies that have demonstrated that CASH indicators are sensitive to management.

Soil Health and Yield

Establishing positive relationships between soil health and crop yield is a difficult task because soil health effects are often masked by non-soil factors such as pest and weed pressures, erratic weather, and management effects. However, in the piedmont study, several individual CASH indicator values were positively correlated with mean corn and soybean yield (annual yield variability was not considered here). Specifically, eight CASH indicators (in order of correlation strength: Protein, ActC, Mn, Resp, AgStab, P, Mg, and OM) displayed significant linear relationships to mean corn yields (Figure 1). Each indicator tended to be highest under minimum-till, intermediate under chisel-till, and lowest under moldboard plow.

This implies that reducing tillage positively impacted these SH indicators, which in turn benefitted crop yield.  Most notable is the fact that the indicators related to labile carbon and nitrogen (Protein, ActC, Resp, and AgStab) showed the strongest correlations with mean corn yield, while total organic matter content showed weaker relations (Figure 1). This suggests that organic matter quality may be more important for improving corn yield than total organic matter quantity. When we analyzed the relationship between soil health indicators and mean soybean yield at this site, we found that Protein was a much weaker predictor of soybean yield than it was for corn yield (not shown). This makes sense because a legume crop would be less influenced by nitrogen supply from soil organic nitrogen sources (Protein reflects the largest such pool) than a non-legume crop. Additionally, we found that Mn showed a strong positive relationship to both corn and soybean yield, which is explained by Mn’s important role in organic matter decomposition.

Figure 1. Linear regression of mean corn yield (bu/acre) as a function of different soil health indicators and tillage practices at the Piedmont site. Plots are organized from highest to lowest R2adj value. Error bars represent standard deviations associated with annual yield variability.

Conclusions

Soil health data from three long-term field experiments in North Carolina showed that the CASH indicators were sensitive to agricultural management at each location, which is in line with previous results from our work in New York. Furthermore, soil health indicators were positively correlated with long-term average cash crop yield at the piedmont site, which illustrates the benefit of labile organic matter for crop growth. These results help to demonstrate the linkage between tillage, organic additions, soil health, and crop yield, which had remained an elusive goal.

Acknowledgements

We acknowledge the work and funding of the original paper by Roper et al., 2017 (Soil Science Society of America Journal 81: 828-843).

This article was based on Harold van Es and Douglas Karlen’s article titled, “Reanalysis validates soil health indicator sensitivity and correlation with long-term crop yields” (van Es and Karlen, 2019; accepted in Soil Science Society of America Journal).

Print Friendly, PDF & Email

What’s Cropping Up? Volume 28, Number 5 – November/December 2018

Survey of Farmers in New York Reveals Challenges and Opportunities in Soil Health

By Cedric Mason (cwm77@cornell.edu) and David Wolfe (dww5@cornell.edu)

The condition of a farm’s soil has an important impact on crop production and the environment. Healthy agricultural soil holds adequate nutrients, absorbs heavy rainfall, and stores water. But in many annual production systems these functions are compromised by tillage that diminishes soil organic matter and creates compaction, ultimately restricting crop growth while increasing susceptibility to drought, erosion, and nutrient losses. Healthy soil, containing substantial levels of organic matter and beneficial pore space, can be developed over time by reducing tillage and using cover crops. But both strategies require significant investments of time and resources, while the benefits may require some years to take effect and are difficult to quantify.

To help clarify exactly what costs and benefits farmers in New York experience when using these soil health-enhancing practices, we conducted a state-wide survey during the winter of 2017-18. Over 180 farmers from 46 NY counties provided information about the crops they grow, and how using reduced tillage and cover crops have impacted their farm business. From the survey results, we identified the most frequent expenses and benefits (Table 1).

Note that costs and benefits reported in Table 1 go beyond revenue associated with yield, to include increases or decreases in annual input costs, as well as avoided investment costs (e.g., drainage systems).  The most common benefit of both reduced tillage and cover crops was less erosion or sedimentation repair. Greater yield was reported by 52% of farmers using reduced tillage, and by 50% of those using cover crops. Lower yield was reported by 10% and 3% of farmers using reduced tillage and cover crops respectively (Table 1). When asked about profitability, less than 5% reported that either practice had a negative net impact (data not shown).

Our survey also found distinctions in the costs and benefits depending on the type of cash crop being produced, for example greater yield of cash crops attributed to the use of cover crops was more frequently reported for vegetable systems than for corn and soybean, while corn and soybean systems in particular were more likely to benefit from forage uses of cover crops (data not shown). These results emphasize the differences that exist between cropping systems, and show that any decision to implement a specific soil health practice should be made on a case-by-case basis, carefully evaluating both the positive and the negative impacts that could occur following a shift in management practice.

Some benefits that result from these practices are realized over many years as the productivity and function of the soil is gradually improved. We asked farmers how long they had been using reduced tillage and cover crops, and found that there was an association between the length of time a farmer had been using those practices and what benefits they saw. Farmers that had been using reduced tillage and cover crops the longest saw greater benefits. One such benefit is less erosion or sedimentation repair. While about 66% of farmers who had used reduced tillage for less than 5 years reported this benefit, after 10 years that number approached 100% (Fig 1). Similarly, among farmers who used cover crops, greater yield of cash crops was associated with long-term cover crop use (Fig 2).

Figure 1: Reducing tillage helps protect against erosion, especially when practiced for more than 10 years.
Figure 2: The use of cover crops can result in greater yields of cash crops, but this benefit is most common when the practice is in place for 10 years or more.

We also wanted to know if farmers in New York state are improving their resilience to severe weather events by using soil health practices. Rainfall patterns in the region could change in the future, and we hypothesized that enhanced soil health provides protection against flooding and erosion from especially heavy downpours due to the presence of stable aggregates and the soil’s increased capacity to absorb water. That same healthy soil may also help a farmer during times of drought by storing water in the soil profile and making it available for crop growth. Both reduced tillage and cover crops were found to help farmers cope with extreme weather events, with over 60% reporting resilience benefits (Fig. 3).

Figure 3: Over 60% of farmers surveyed confirmed that reduced tillage and cover crops help protect against extreme weather events.

This study was conducted by New York Soil Health, and funded by NYS Dept. of Ag & Markets and Cornell University College of Agriculture and Life Sciences (CALS). To learn more about soil health in New York, visit newyorksoilhealth.org.

Print Friendly, PDF & Email