
Joseph Amsili, Harold van Es, Bob Schindelbeck, and Kirsten Kurtz
Soil and Crop Sciences Section, Cornell University
Take-aways:
-
- Soil biological indicators (organic matter, active carbon and respiration) were higher in finer textured soils than coarser textured soils, but organic matter quality was higher in coarser textured soils.
- Soil texture exerted a strong control on a soil’s available water capacity.
- Organic matter improvements are more likely to increase available water capacity in coarse textured soils compared to fine textured categories.
As progress is made in characterizing the biological and physical health of soils nationwide, soil health labs will be able to develop regionally specific scoring functions that correspond to inherent differences in soil properties and processes, which are shaped by the complex interplay of local climate, geology, biology, and time. The Cornell Soil Health Program has recognized this need and is developing scoring functions by region, soil type, and cropping system. Naturally, we have begun these efforts by focusing on New York State soils. In this first preview of the New York State Soil Health Characterization Report, we focus on the effects of soil texture on biological and physical soil health parameters. Stay tuned for the full technical report, titled “New York State Soil Health Characterization Report”, which will be published soon.
Methods
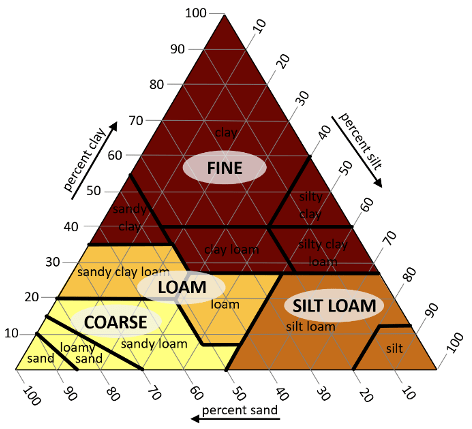
The Cornell Soil Health Laboratory analyzed 1,456 samples from across New York State between 2014-2018. Soil samples were analyzed for the standard Comprehensive Analysis of Soil Health (CASH) package, which included two physical indicators – wet aggregate stability (AgStab), and available water capacity (AWC); four biological indicators – soil organic matter (SOM), active carbon (ActC), autoclavable citrate extractable protein (Protein), and respiration (Resp); and seven chemical measurements. Results were summarized by four textural groups: coarse, loam, silt loam, and fine (Figure 1). Additionally, NY SH results were compared across five cropping systems which included annual grain, dairy system, process vegetables, mixed vegetables, and pasture (Part II will include a summary of the effects of cropping systems on soil health).
Results and Discussion
Soil texture is a dominant inherent soil property that exerts strong controls on a soil’s ability to function. Specifically, soil texture influences the amount of storable carbon and nutrients, a soil’s water holding capacity, erodibility, and drainage, and the habitat that soil provides to organisms. In order to evaluate the impacts of human land management (tillage, crop rotation, organic amendments) on the soil, it’s critical to understand the effects of the underlying inherent soil properties, like soil texture, on these soil health parameters.
Effects of soil texture on biological soil health indicators
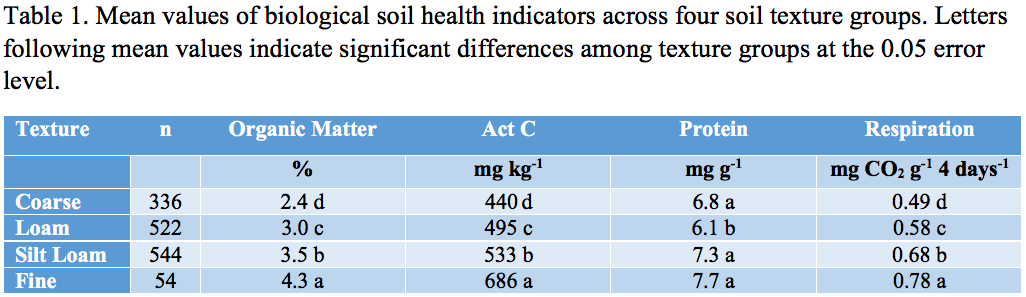
Soil texture influences the quantity and quality of organic matter a soil can hold. Soils with higher concentrations of silt and clay (fine-textured) can store more organic matter than sandy (coarse-textured) soils due to the large amount of surface area available to bind with organic molecules. In the NYS database, SOM, ActC, and Resp were highest in fine textured soils, followed by silt loam, loam, and coarse textured soils. Fine textured soils in fact had 79%, 59%, and 56% higher SOM, Resp, and Act C than coarse textured soils, respectively (Table 1). Protein did not follow the pattern of an increasing concentration in finer texture groups. This is likely because it is more difficult to extract proteins from soils with high amounts of clay. Additionally, two ratios, Protein/SOM and ActC/SOM, exhibited lower values in finer textured soils (data not shown), which also suggests a lower ability to extract protein and active carbon in fine textured soils despite high OM levels. Alternatively, it suggests higher proportions of higher-quality organic carbon and nitrogen relative to the stable organic matter, i.e., relatively more “fresh” organic matter than stable mineral-bound organic matter in coarse textured soils.
Effects of soil texture on physical soil health indicators
Soil texture exerts a dominant control on a soil’s available water capacity, which is the amount of water that a soil can hold and make available to plants. Coarse textured soils store the least amount of water because large pores between sand particles are unable to hold on to water against gravity. Specifically, as sand content increases, AWC goes down (r = -0.70). In contrast, clayey soils can store the most water, but some of that is tightly held in micropores and plants can’t access it. Therefore, soils with intermediate textures, like silt loams and to a slightly lesser extent loams, are known to store the most plant available water. We indeed found that silt content was positively correlated with AWC (r = 0.72), and silt loams and silty clay loam soils had the highest AWC. Silt loam soils had 273%, 139%, 47%, 28%, higher AWC than sand, loamy sand, sandy loam, and loam soil textures (Figure 2).
The strong textural control on AWC has implications for trying to improve a soil’s AWC with sustainable soil management strategies. The claim that, “one percent of organic matter in the top six inches of soil would hold approximately 27,000 gallons of water per acre” is often used to promote soil organic matter management. While this number is likely an over exaggeration of reality as evidenced by a recent study by Libohova, et al, 2018, who found that this number was closer to 2,850 gallons of available water stored per acre, it is true that increasing SOM is an important strategy to increase AWC. Furthermore, our research and other’s research show that SOM was more strongly related to AWC in coarse textured soils (r = 0.48) compared to loam (r = 0.14) or silt loam (r = 0.12) textured soils. This finding demonstrates that improved organic matter management can lead to increases in AWC in coarse textured soils to a much greater extent than for silt loams or finer soil textures.

Conclusions
Soil texture is a critical inherent soil property that exerts strong control on a soil’s ability to function, including its potential to store organic matter and retain plant available water. For biological indicators, SOM, ActC, and Resp values were higher in finer texture groups. Furthermore, AWC, an important physical indicator, was strongly controlled by texture. Our data suggest that coarse textured soils with low inherent AWC respond to increases in SOM to a much larger degree than silt loam soils. This NYS soil health database analysis demonstrates that soil texture is an essential variable to include in developing soil health targets at the policy or conservation planner level. Stay tuned for the full technical report titled, “New York State Soil Health Characterization Report” and for part II in the next WCU issue on the effects of cropping system on soil health indicators.
Acknowledgements
We acknowledge support from the New York State Environmental Protection Fund (administered through the Department of New York Agriculture and Markets).
