Northern Stem Canker: A New Challenge for New York Soybean Producers

Jaime A. Cummings and Gary C. Bergstrom – School of Integrative Plant Science, Plant Pathology and Plant-Microbe Biology Section – Cornell University

Figure 1.  Canker on stem, and inter-veinal discoloration of leaves above the canker caused by northern stem canker. Photo by Jaime Cummings.
Figure 1. Canker on stem, and inter-veinal discoloration of leaves above the canker caused by northern stem canker. Photo by Jaime Cummings.

As part of 2014 research projects supported by the New York Soybean Check-off Program and the Northern New York Agricultural Development Program, participating Cornell Cooperative Extension Educators have been scouting soybean production fields, recording observations on diseases, and sending plant samples to the Field Crop Pathology Laboratory at Cornell University for positive diagnosis of disease problems.  A serious disease called ‘northern stem canker’ was confirmed for the first time in New York soybean fields.  It showed up in samples from soybean fields in Jefferson, Livingston, Niagara, Ontario, Orleans, Seneca, and Wayne Counties collected by CCE Educators Mike Hunter, Mike Stanyard and Bill Verbeten.  The disease was diagnosed at Cornell based on characteristic symptoms and the laboratory isolation of the causal fungus and confirmation of a portion of its DNA sequence.  Soybeans are also being scouted in other areas of New York in 2014, but so far this disease has not been detected outside of the seven counties mentioned above.

Northern stem canker (NSC) is caused by the fungus Diaporthe phaseolorum var. caulivora and differs from a related fungus, Diaporthe phaseolorum var. meridionalis, that causes southern stem canker throughout the southern U.S.  NSC occurs in most Midwestern states and in Ontario, but this is, to our knowledge, the first confirmation in New York or the northeastern U.S.  Reported yield losses in the Midwest have ranged from minor to in excess of 50%, so the presence of the pathogen is considered a significant factor for soybean production. Yield loss is often a function of the relative susceptibility of varieties that are planted; varieties vary from susceptible to resistant.  If NSC becomes more prevalent in New York, selection of resistant varieties may become more important for New York producers.

Figure 2. Internal and external stem symptoms caused by northern stem canker. Photo by Jaime Cummings.

The foliar symptoms of NSC are similar to those of other soilborne diseases that restrict the movement of water and nutrients to the leaves.  So NSC can be confused with brown stem rot and sudden death syndrome, all of which result first in yellowing and then browning of leaf tissues between the veins during pod-filling stages.  What is distinctive about NSC is the stem lesions called cankers that form near nodes and often girdle the stem, resulting in wilting and necrosis above the canker (Figure 1).  Dead leaves remain attached to the plant and turn blackish.  Cankers often have a reddish margin and gray center (Figures 1 & 2).  Symptoms in the interior stem initiate as a slight browning at the nodes and then may progress to complete browning and deterioration of the pith, while the roots remain symptomless (Figure 2). Necrotic stem symptoms may be confused with those caused by white mold or Phytophthora stem rot.

Infection by the fungus occurs early in the season, from spores splashed by rain from the soil to the stems; rainfall and warm temperatures favor epidemics. Because infection occurs at early stages (around the three leaf stage) of the crop, foliar fungicides applied during flowering and pod-filling stages will not be effective in suppressing NSC.

The fungus survives on soy residues in the field for many years, and produces its infective spores on these residues. Some research suggests that other legume crops such as alfalfa and a number of weed species can harbor the fungus between soybean crops though the importance of these associations is not well established. Deep plowing of infected soybean residues and multiple year rotations with corn or small grains may reduce the potential of NSC in a subsequent soybean crop. The pathogen can also survive in and be transmitted by infected seed, such that fungicidal seed treatment can reduce the chances for introducing the pathogen into new fields.

The most important thing that a New York soybean producer can do at this time is to learn to recognize the symptoms of NSC and other soilborne diseases and to get a diagnosis of problems that they observe in their fields.  If NSC or other soilborne diseases are confirmed, producers should talk to their seed supplier and order soybean varieties with appropriate levels of resistance for the soilborne diseases observed on their farm.

Acknowledgements: This research received financial support from the New York Soybean Check-off Research Program, the Northern New York Agricultural Development Program, and Cornell University Hatch Project NYC153473.


Implementation of a Soil Health Management Plan Resolves Pond Eutrophication at Tuckaway Farm, NH

Bianca Moebius-Clune, Dan Moebius-Clune, Robert Schindelbeck, Harold van Es – Section of Soil and Crop Sciences, Cornell University; Dorn Cox – GreenStart; Brandon Smith – NH NRCS

Dorn Cox manages Tuckaway Farm, his family’s 250 acre multi-generational diversified organic operation in Lee, NH. He is also a PhD Candidate at the University of New Hampshire, and director of GreenStart, an educational non-profit organization set up to foster a resilient food and energy system in New Hampshire by providing technical education and practical agricultural examples.  Dorn discovered that the Cornell Soil Health Test was available in 2009, while discussing soil testing with Brandon Smith, State Agronomist of the NH NRCS. “It was a good fit for GreenStart’s mission and I was excited, because the test not only incorporated biological, physical, and chemical indicators, but it also presented an approach for land management planning and adaptive management.“  In the spring of 2010 he submitted his first samples.

A collaborative project was initiated among partners at NH NRCS, Cornell, Greenstart, NH Conservation Districts, and NH farms in four counties. The goal was to develop a framework for a soil health test-informed Soil Health Management Plan (SHMP), analogous with the NRCS’s Nutrient Management Plan, but with biological and physical test results to be considered, in addition to standard soil test results. Additionally the project set out to build local equipment infrastructure to enable soil health management through education and equipment rentals, and to demonstrate implementing these plans.

Tuckaway Farm became the first test case for the new planning and implementation framework. Through the particular resource concerns identified, this case became strong evidence for the need to move beyond Nutrient Management Planning, to Soil Health Management Planning. Implementation of a targeted set of soil health management practices has now resolved eutrophication problems that had made the farm irrigation pond unusable for recreation since 2009.

Background: from Soil Health Testing to Planning to Implementation

Soil health constraints beyond nutrient deficiencies and excesses currently limit agroecosystem sustainability, resilience to drought and extreme rainfall, and progress in soil and water conservation. The Cornell Soil Health Assessment (http://soilhealth.cals.cornell.edu/), makes it possible to identify and explicitly manage constraints. Available to the public on a fee-for-service basis since 2006, it provides field-specific information on constraints in biological and physical processes, in addition to standard nutrient analysis.

A more complete understanding of soil health status can better guide farmers’ soil management decisions. However, so far, there had been no formalized decision making process for implementing a soil health management system that alleviates field-specific constraints identified through standard measurements and then maintains improved soil health. We created a framework for developing Soil Health Management Plans (SHMP) for a farm operation, including:

  1. A detailed listing of management suggestions specific to each indicator showing constrained soil functioning, and relevant NRCS cost-shared practices that could be applied to address the resource concerns identified through a soil health assessment.
  2. A new Cornell Soil Health Assessment report format that more explicitly provides initial interpretation, prioritization, and management suggestions, from which a SHMP can then be developed.
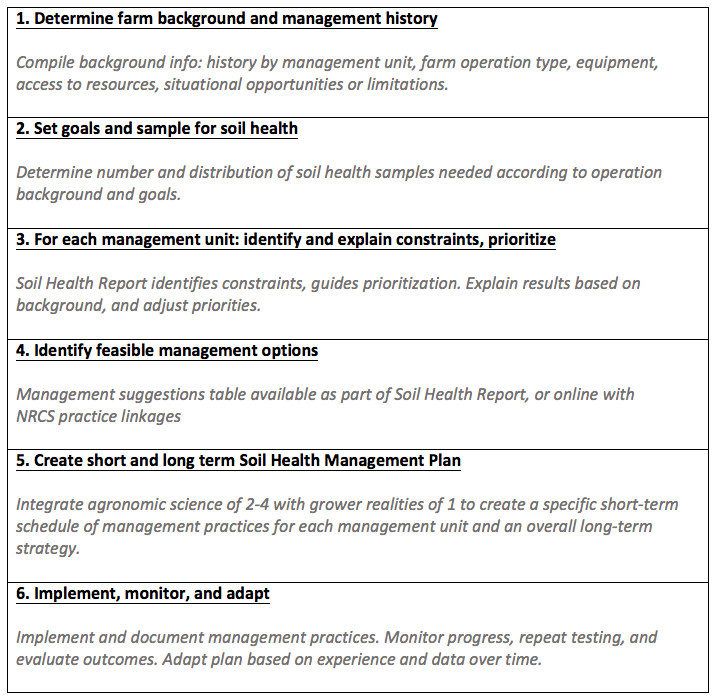
  3. Six general steps for the planning and implementation process (Figure 1).
  4. A pilot SHMP template for such plans that includes purpose, site information, assessment results and interpretation, and planned practices via a multi-year management calendar outlining a specific plan for each field.

We developed a pilot multi-field SHMP using this framework at Tuckaway Farm, owned and operated by the Cox family for over 30 years, and at 17 additional NH operations. The purpose of this case study is to share the outcomes achieved in one of Tuckaway Farm’s fields, and suggests, based on this example, that a broader soil health assessment-based planning approach is necessary to maintain our nation’s most vital resource: our soil.

Figure 1. Soil Health Management Planning Process Overview
Screen Shot 2014-09-16 at 11.46.28 AM

Planning, implementation and evaluation for a field at Tuckaway Farm in 6 steps

1. Farm background and management history

Dorn and his father Chuck tell the story of a 30 year evolving family endeavor. Much of the land has been in long-term continuous organic hay for off-farm sales, with limited use of inputs such as wood ash and horse manure. The farm has added vegetable rotations and fruit over the years, and more recently dairy, eggs, meat, grains, and oils, among other products, all with organic certification. A Comprehensive Nutrient Management Plan determined that net nutrient exports off the farm were causing nutrient deficiencies in many long-term hay fields. The land base can potentially sustain a much larger number of animals. Management change has sped up since about 2009, with additional products being developed, experimentation with reduced tillage, cover crops, and rotational grazing, and a decrease in hay export as the younger generation farmers are building animal-based enterprises. Diverse equipment, owned by the farm, Greenstart, and the county conservation district, is available.

The Pond Field, the subject of this case study, is a long-term hay field, occasionally grazed outside of the CNMP-required buffer strip around the pond’s perimeter. The field’s soil is an inherently well-drained but easily eroded Hollis-Gloucester fine sandy loam of mostly 8-15% slope that levels near the pond at the bottom of the slope. Forage growth was mediocre, and legume content was very low, when the field was assessed for the project in spring of 2012. Dorn Cox noted that the pond had previously served as their swimming pond. It had become overgrown with algae since 2009, indicating excess phosphorus availability in the water (Figure 2), despite the fact that manure-spreading buffers were attended to in accordance with their CNMP.

Figure 2. Pond field. At initial assessment in spring 2012, the former recreational pond was eutrophic. Heavy algal growth was visible at the edges (a). Grass forage growth was of low vigor, and forage legume content was very low (b). Photo credits: Dorn Cox and Bianca Moebius-Clune
Screen Shot 2014-09-16 at 11.53.52 AM

2. Goals and sampling

Goals for the farm included improving soil health, productivity, on-farm nutrient and carbon cycling, and long-term sustainability, and regaining use of the pond for recreational purposes. A number of representative fields on the farm were sampled to assess baseline status and to guide changes in management as the enterprises evolve.

3. Constraints: identified, explained, and prioritized

Overall, soil health at Tuckaway Farm was found to be medium to high, with generally high total organic matter and aggregate stability due to low tillage and long-term perennial forage growth. However, compaction was a prominent soil constraint. Severe surface compaction and suboptimal subsurface hardness were identified as factors driving decreased soil functioning and low current plant vigor in Pond Field (Figure 3), likely due to traffic on wet soils during haying and grazing. Active carbon was suboptimal or constraining in every field, likely resulting from low plant vigor and thus low fresh root and shoot contributions to soil organic matter. P, K and pH were suboptimal in many fields, including Pond Field, further contributing to low plant vigor and low legume content. Eutrophication problems from excessive P inputs into the pond were thus clearly not due to high soil P. Rather eutrophication was explained by poor physical and biological soil health. Severe compaction on a grazed slope with suboptimal vegetation growth was causing excessive runoff during rain events, and thus water quality problems.

Figure 3. 2012 Cornell Soil Health Assessment for Pond Field shows that compaction drives the lack of soil functioning observed for this field, with suboptimal nutrient and pH conditions contributing to poor plant growth, which in turn explains suboptimal active carbon availability.
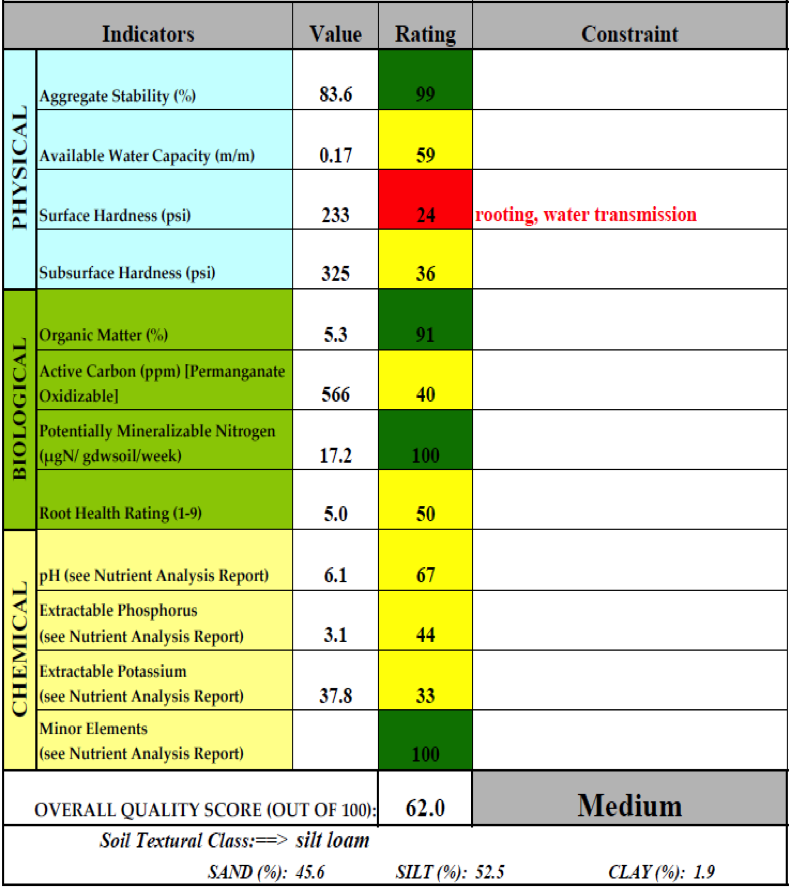
Fig3

4. Feasible management options

Surface and deep targeted soil disturbance were identified as feasible and most promising options (see table of management suggestions) for alleviating compaction. Improved selection of cover and pasture crop species was considered secondary for this constraint, based on low vigor and the need to jump-start the system through initial loosening of the soil, but these selections were deemed essential for improving and maintaining biological activity in the longer term. Woodash and manure were identified as the most feasible immediate ways to address nutrient and biological activity constraints. It was noted that bedrock for the soil type is generally at 10-20”, so that improving water dynamics and preventing erosion was particularly important, but that bedrock proximity might cause challenges for mechanical compaction management in some areas.

5. Short and Long Term Soil Health Management Plan

The short-term management calendar included the following immediate remediation in August of 2012:

  • Deep ripping with the available Yeoman’s plow along slope contours (30” spacing, to maximum depth possible considering bedrock), to alleviate subsoil compaction, low infiltration, and erosion issues.
  • Interseeding tillage radish or similar deep rooted fall brassica in order to keep soil pores open, implemented in the same pass as the above if feasible.
  • Woodash application followed by aerway incorporation to address suboptimal K, P, and pH, along with surface compaction.

A combination of rotational grazing or haying during appropriate soil moisture conditions was recommended. Grazing was to be followed with aerway incorporation of manure to increase soil P and decrease chances of erosion. Interseeding of additional species, such as warm season annual forages (sorghum sudangrass or forage soybean) during 2013 was planned to increase biomass production and thus biological activity. Monitoring compaction levels and possible follow-up with further mechanical alleviation was planned for subsequent years.

6. Implement, monitor, and adapt

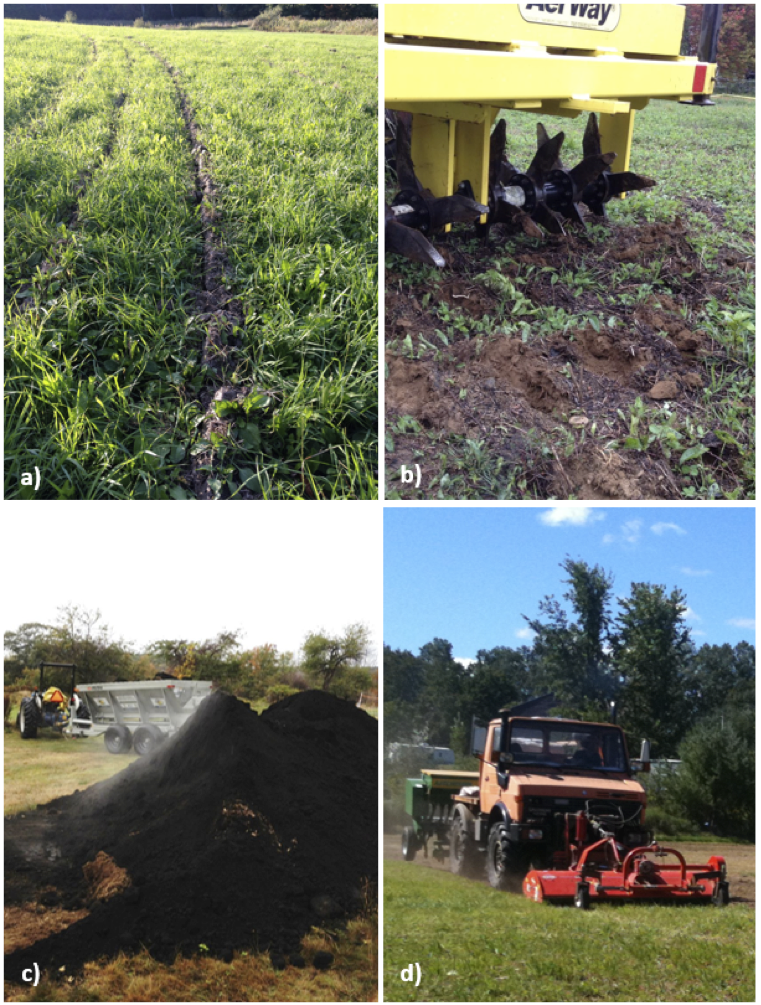
Implemented Practices: The plan was implemented with some adaptations due to farm scheduling, weather constraints and equipment availability (Figure 4). Yeoman’s plow and aerway with one hole offset were used according to plan, but no woodash was applied, nor were additional crops interseeded in the fall of 2012.  The three shank yeoman’s plow was set to 20” depth and 30” spacing between shanks, followed by the aerway with one-hole offset on the same day.  All grazing was stopped on the slopes above the pond starting in 2012.  Two cuts of dry hay were taken during the summer of 2013. The wet 2013 spring delayed woodash delivery and spreading until after the second cut hay was removed, and the spreader was available for covering multiple fields. Woodash was surface spread in October 2013 using the conservation district’s Stolzfus wet lime and woodash spreader loan program. The slope above the pond was then seeded to a hairy vetch, winter rye, wheat, barley mix in a single pass cultivation using a Unimog U1200 tractor with a front mounted Howard rotovator set to 3”, and rear mounted Great Plains no-till drill. The mix was planted to address surface compaction for improved infiltration, as well as to produce one of multiple potential crops depending on needs at harvest: feed grain, cover crop seed (usable as on-farm custom winter mix, or separable with the farm’s spiral separator), or a single cut of legume mix dry hay harvestable in late August of 2014.

Figure 4. Soil Health Management Plan Implementation: Deep ripping with a yeoman’s plow along the slope’s contours (a) to alleviate subsoil hardness, followed by Aerway treatment (b) to alleviate surface hardness in the fall of 2012. Wood ash application to alleviate low pH, and K and P deficiencies (c), followed by single pass shallow rotovator cultivation and seeding of grain-vetch mix (d) to further alleviate surface compaction and produce crop. Photo credits: Dorn Cox and Bianca Moebius-Clune
Screen Shot 2014-09-16 at 11.54.35 AM

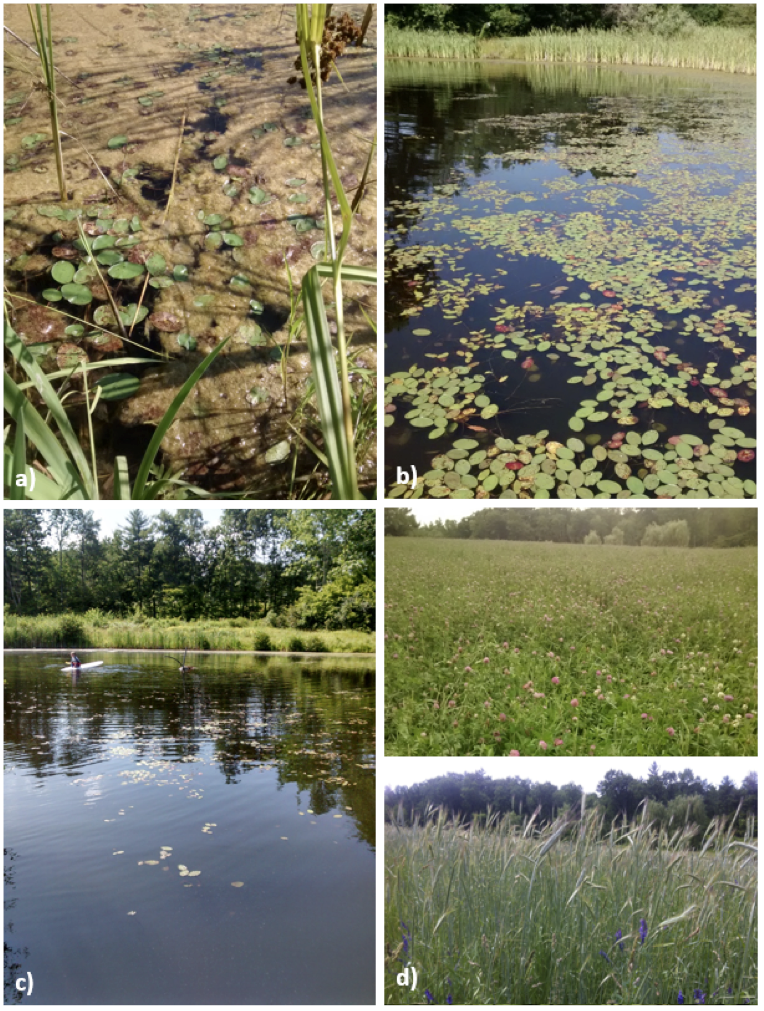
Observed Results: Prior to implementation in 2012, significant runoff was evident during rain events. Algal growth (Figure 5a) prevented use for recreational purposes.  Water flow from the slope during rainfall was noticeably reduced after deep rip and aerway treatments, despite the wet 2013 spring, and the pond started to clear and became usable for recreation in 2013. Runoff reduction appeared even greater post grain-vetch-mix planting in the fall of 2013, and the pond’s water quality continued to improve into the 2014 summer season (Figure 5b, 5c). The effect of wood ash was evident in the spring of 2014 as vigorous clover growth returned to the field, and the grain-vetch mix grew with satisfactory vigor (Figure 5d). Progress in crop productivity and pond water quality will be monitored further.

Figure 5. Heavy algal growth as was seen along the pond’s perimeter in 2012 (a). Clear water (b), regained recreational use (c), and improved legume content and satisfactory crop vigor (d) after implementation of the first ~ 20 months of a situationally adapted Soil Health Management Plan.  Photo credits: Dorn Cox and Bianca Moebius-Clune
Screen Shot 2014-09-16 at 11.54.52 AM

Conclusions

In this case-study, a targeted set of soil health management practices were implemented to alleviate previously unidentified compaction, in addition to interacting minor biological and chemical constraints. These treatments have resolved eutrophication problems in a pond that can now again be used for recreation. This case demonstrates strong evidence for the need to move beyond simple Nutrient Management Planning, to more comprehensive Soil Health Management Planning. We illustrate interactions between nutrient-related constraints and biological and physical limitations in soil conditions: in this case the lack of infiltration from compaction and poor rooting allow for simultaneous occurrence of nutrient deficiencies in soil and nutrient excesses in water. We further illustrate the limitations of applying prescribed best management practices (e.g. buffers), as opposed to using environmental monitoring and systems indicators to provide feedback for adaptive nutrient management.  Biological and physical constraints must be explicitly identified through soil health assessment, and managed comprehensively alongside nutrient-related constraints. Management must be adapted in response to seasonal conditions and observations, in order to achieve satisfactory progress in soil and water conservation.

Acknowledgements

We would like to acknowledge funding received from a NH NRCS Conservation Innovation Grant, a Specialty Crops Block Grant, from the NH Charitable Foundation, and from NY Hatch, which enabled completion of this project. We would also like to acknowledge the collaboration of NH NRCS and Soil and Water Conservation District staff, and of additional NH growers, who helped inform the development through their participation in the planning process and contribution of diverse farm scenarios to test the flexibility of the framework.


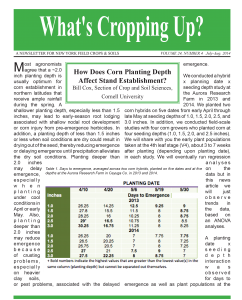
What’s Cropping Up? Vol. 24, No. 4 – Full Version

WCUVol24No4 cover imageThe full version of What’s Cropping Up? Vol. 24, No. 4 is available as a downloadable PDF.  Individual articles are available below:

Late Summer is a Good Time to Control “Deep-Rooted” Perennial Broadleaf Weeds

Russell R. Hahn, Section of Soil and Crop Sciences, Cornell University

Common Milkweed
Common Milkweed

All perennial weeds can be troublesome, however “deep-rooted”, creeping perennial broadleaf weeds such as field bindweed, hemp dogbane, horsenettle, and common milkweed are among the most difficult to control.  Like annual and biennial weeds, these perennials reproduce by forming seed.  In addition, they spread by rhizomes (underground stems).  Buds or growing points are found all along these underground stems.  Effective control programs must control newly germinated seedlings and minimize the ability of these underground buds to produce new above ground shoots.  Between-cropping applications of translocated herbicides during late summer or early fall have proven more effective than other programs for control or suppression of these perennial broadleaf weeds.

Rhizomes are Key to Survival
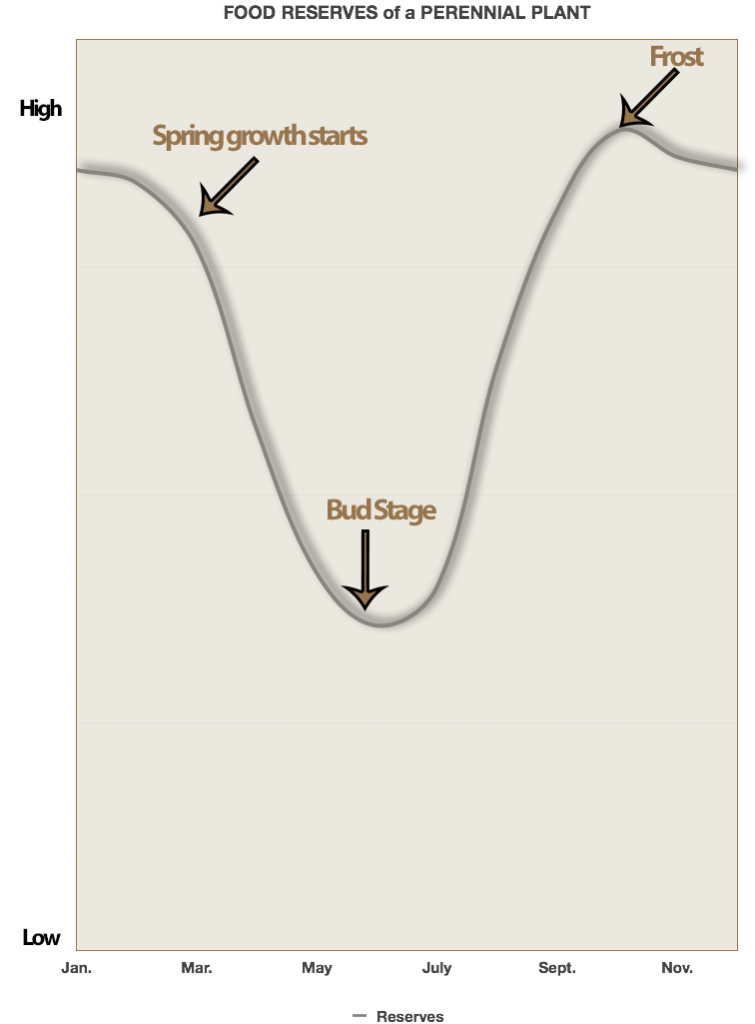
FOOD RESERVES TABLERhizomes are the key to the survival of these perennial broadleaf weeds since they serve as a storehouse for food reserves (carbohydrates).  It is these food reserves that allow these plants to survive winter.  In the spring these creeping perennials draw on these reserves to make new growth.  During this period of vegetative growth, carbohydrate movement is mainly upward in the plants.  The depletion of food reserves continues until the plants reach full leaf development and flower bud formation in mid- to late summer as shown in the accompanying figure.  At this time, these plants have the maximum leaf area and the lowest level of carbohydrate reserves that they will have all season.  After flowering, they start moving carbohydrates from the leaves into the rhizomes in preparation for winter.  Effective chemical control of established patches of these perennial weeds takes advantage of this food storage period to move translocated herbicides down to the underground buds or growing points.

Translocated Herbicides
Translocated herbicides are the key to chemical control of “deep-rooted” perennial broadleaf weeds.  Translocation refers to the movement of substances from one place to another, such as the movement of herbicides in plants.  Herbicide movement in plants may follow the pathway of sugars formed during photosynthesis and/or the pathway of water that us absorbed by plant roots.  Perennial weed control is most dependent on herbicide movement with the manufactured sugars.  These sugars move out of the leaves to areas of rapid growth (growing points).  Herbicide translocation to the growing points on the underground stems is most rapid and most effective when large amounts of sugars are being moved to the rhizomes.  This usually occurs after full bloom in late summer and fall.  Since 2,4-D, dicamba (Banvel, Clarity, etc.) and glyphosate (Roundup, etc.) are readily translocated from leaves into underground structures of perennial weeds, these herbicides can be effective in controlling or suppressing these weeds.

Between-Cropping Applications
Between-cropping herbicide applications are simply those that are made: 1) after harvesting one crop, 2) before killing frost, and 3) before planting the next crop.  Situations that meet these requirements include fields where small grains (not seeded to legumes) or certain vegetable crops (peas, early sweet corn, etc.) have recently been harvested, and where the next crop won’t be planted until fall (small grains) or until the next spring. These between-cropping situations provide the opportunity to use non-selective herbicides such as glyphosate or to use high rates of 2,4-D or dicamba that cannot be used safely when crops are present.  These herbicides should be applied when the weeds are actively growing.  It may be necessary to allow the weeds to recover from damage done during crop harvest. Herbicide labels should be consulted to determine application rates for the targeted perennial broadleaf weeds.  In all cases, tillage and other operations should be delayed for 7 or more days following application to allow time for herbicide translocation to the underground buds.

Rotational Crops
Glyphosate is inactivated upon contact with the soil so a variety of crops can be planted following the 7-day waiting period.  Since dicamba, the active ingredient in Banvel, Clarity, and numerous other products, has residual soil activity, rotational guidelines must be followed to avoid injuring subsequent crops.  Corn, soybeans, and all other crops grown in areas with 30 inches or more of annual rainfall may be planted 120 days after application of up to 4 pints/acre of dicamba products like Banvel and Clarity.  Small grains may be planted if the interval between dicamba application and planting is 20 to 30 days (depends on which product is applied) per 1 pint/acre east of the Mississippi River.  These waiting periods should exclude days when the ground is frozen.  The waiting period for planting winter wheat or barley following late summer dicamba applications can be shortened by applying reduced dicamba rates in tank mixes with glyphosate or 2,4-D.

Between-cropping applications of translocated herbicides provide the best opportunity to suppress or control “deep-rooted” perennial broadleaf weeds, however, growers must act now to take advantage of existing situations or to plan a rotation that will allow such applications next year.  Unfortunately, the typical dairy rotation of corn and perennial forages doesn’t provide good opportunities for these between-cropping herbicide applications.

Preliminary Data Indicate Corn and Wheat Acreage Down but Soybean Acreage Soars in NY in 2014

Bill Cox, Section of Crop and Soil Sciences, Cornell University

Wheat harvest and stressed corn 051
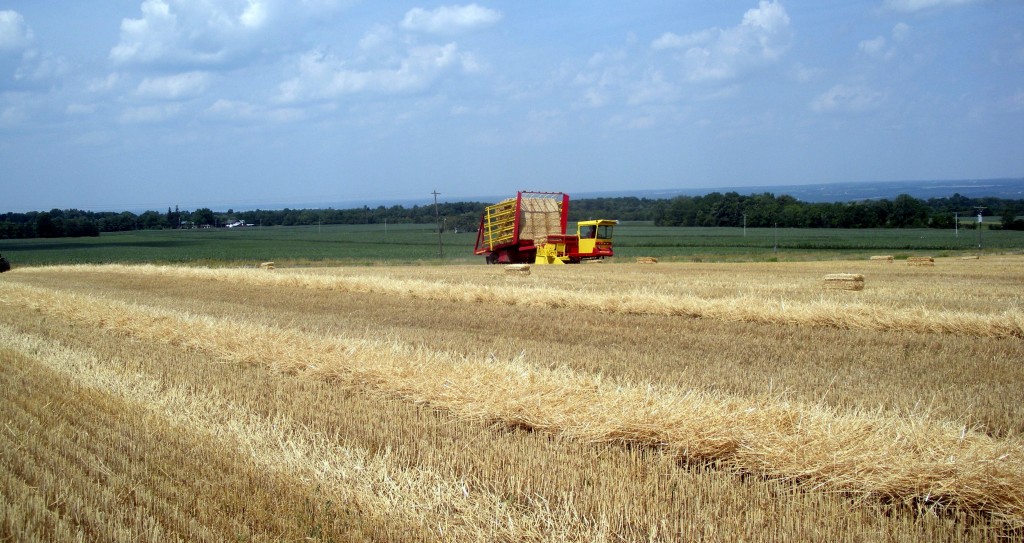
Many wheat growers harvest and sell the straw, adding greatly to the overall value of the wheat crop in NY.

Corn acreage for grain in NY, as of June 1, is expected to total 660,000 acres in 2014, a decrease of about 4% from 2013 (690,000 acres). Corn acreage for silage production in NY, as of June 1, is expected to total 500,000 acres in 2014, down about 2% from 2013 (510,000 acres). Only 58% of the corn in NY was planted by June 1, however, so grain acreage could decrease further because of maturity concerns for June-planted corn, especially on dairy farms. Likewise, the price of grain corn has dropped significantly since June 1, providing more incentive for dairy farmers to switch from grain to silage. Overall, total corn acreage in NY is projected to be 1,160,000 acres in 2014, down by 3.3% (1,200,000 acres in 2013. A further update on the corn acreage will be provided on August 11th by USDA, based on the August 1 survey. Total corn acreage in NY could decrease further because the first half of June was wet in the Southern Tier region of NY, which may have prevented planting some of the remaining 42%, intended acreage.

Wheat acreage in NY in 2014 declined by 20,000 acres or 17% (95,000 acres) compared to 2013 (115,000 acres). This was somewhat surprising because about 40,000 soybean acres were declared as Prevented Planting in NY in 2013, and it was assumed that a significant number of those acres would be planted to wheat. The projected wheat yield in NY as of July 1 was projected to be 66 bushels/acre, down 2 bushels/acre from the record yields in 2013 (68 bushels/acre). Preliminary testimonies by NY wheat producers indicate average yields so far in 2014 as of July 24th so final yield estimates may decrease a bit.

Wheat harvest and stressed corn 050
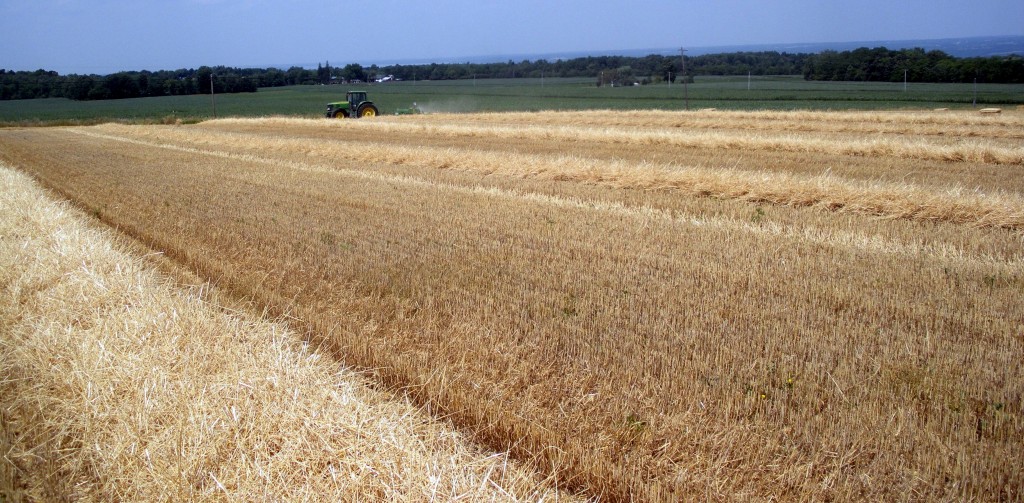
Field crop producers typically rotate corn, soybeans, and wheat on many of their fields.

The 2013 June report estimated 320,000 acres of soybeans were expected to be planted in NY but the wet June conditions prevented many acres from being planted; thereby reducing harvested soybean acreage to 278,000 acres. Soybean acreage in NY in 2014, as of June 1, was expected to increase to 397,000 acres, a stunning 43% increase from the previous year. Only 66% of the intended soybean acreage was planted as of June 15, however, so wet conditions in some regions of NY during the first half of June may have prevented some of these intended acres from being planted in 2014. Soybeans can be successfully planted in NY until about June 25th in the Finger Lakes Region and western NY, and 93% of the crop was reported to be planted as of June 29th. Consequently, it is expected that at least 370,000 of these intended acres were planted, thereby eclipsing the previous soybean acreage record in NY of 315,000 acres in 2012. A further update on soybean acreage will be provided on August 11th by USDA, based on the August 1 survey. If 370,000 acres of soybeans were planted in NY in 2014, this would represent an 8.25 fold increase in soybean acreage over the last 25 years (40,000 acres planted in 1990). Truly, soybean expansion in NY is an unheralded success story of NY agriculture.

How Does Corn Planting Depth Affect Stand Establishment?

Bill Cox, Section of Crop and Soil Sciences, Cornell University

2013 CORN AND SOYBEAN PLANTING AND EMERGENCE 016
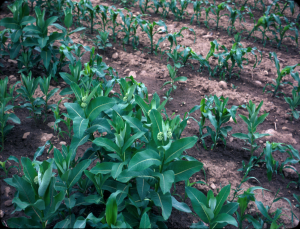
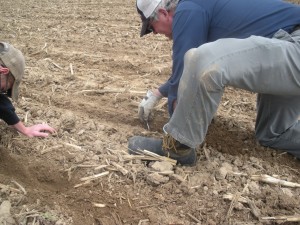
Growers should check corn seeding depths when they enter fields with different soil types or tillage practices.

Most agronomists agree that a ~2.0 inch planting depth is usually optimum for corn establishment in northern latitudes that receive ample rainfall during the spring. A shallower planting depth, especially less than 1.5 inches, may lead to early-season root lodging associated with shallow nodal root development or corn injury from pre-emergence herbicides. In addition, a planting depth of less than 1.5 inches or less when soil conditions are dry could result in drying out of the seed, thereby reducing emergence or delaying emergence until precipitation alleviates the dry soil conditions. Planting deeper than 2.0 inches may delay emergence, especially when planting under cool conditions in April or early May. Also, planting deeper than 2.0 inches may reduce emergence because of crusting problems, especially on heavier clay soils, or pest problems, associated with the delayed emergence.

2013 CORN AND SOYBEAN PLANTING AND EMERGENCE 033
Optimum corn seeding depths depends greatly on soil conditions as well as climatic conditions before and after planting.

We conducted a hybrid x planning date x seeding depth study at the Aurora Research Farm in 2013 and 2014. We planted two corn hybrids on five dates from early April through late May at seeding depths of 1.0, 1.5, 2.0, 2.5, and 3.0 inches. In addition, we conducted field-scale studies with four corn growers who planted corn at four seeding depths (1.0, 1.5, 2.0, and 2.5 inches). We will share with you the early plant populations taken at the 4th leaf stage (V4), about 3 to 7 weeks after planting (depending upon planting date), in each study. We will eventually run regression analyses on the data but in this news article we will just observe trends in the data, based on an ANOVA analyses.

Table 1. Days to emergence, averaged across two corn hybrids, planted on five dates and at five depths at the Aurora Research Farm in Cayuga Co. in 2013 and 2014.

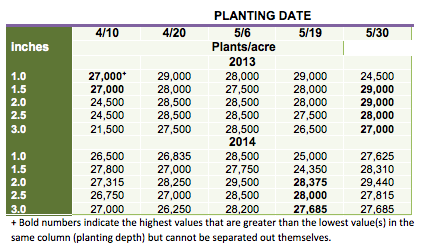
A planting date x seeding depth interaction was observed for days to emergence as well as plant populations at the V4 stage for both years in the small plot study at Aurora (Tables 1 and 2). The deeper planting depths, especially the 3.0 planting depth, required 2 to 4 additional days for emergence on the April planting dates in 2013 and 1.25 to 2.25 additional days in 2014. The 1.0 inch depth however, required an additional 1 to 1.75 days for emergence for the May planting dates in 2013 and an additional 0.75 days for the late May planting date in 2014. Obviously, cool conditions delayed emergence at the 3.0 inch depth for the April planting dates and dry soil conditions probably delayed emergence at the 1.0 inch planting depth for May planting dates in 2013 and the late May planting date in 2014.

Table 2. Corn plant populations at the 4th leaf stage (V4), averaged across two corn hybrids, planted on five dates at five depths at a seeding rate of 31,800 kernels/acre at the Aurora Research Farm in Cayuga Co. in 2013 and 2014.

Delayed emergence at the 2.0, 2.5 and 3.0 inch depths affected plant populations on the early April planting date in 2013 (Table 2). Compared with the 1.0 and 1.5 inch depths, the 2.0 and 2.5 inch depths had 2500 fewer plants/acre and the 3.0 inch planting depth had 6500 fewer plants/acre. Plant populations among seeding depths, however, did not differ for most other planting dates in both years, except for the late May planting date in 2013 and the mid-May planting date in 2014. On both those planting dates, the 1.0 inch planting depth had ~4000 fewer plants/acre compared with the 2.0 inch planting depth. Overall, the 1.5 to 2.0 inch planting depth mostly had the highest plant populations with the exceptions being the 2.0 inch depth too deep for the early April planting date in 2013 and the 1.5 inch depth being too shallow for the late May planting date in 2013 and mid-May planting date in 2014.

Despite the planting date x seeding depth interaction for days to emergence and plant populations in 2013, yield did not have a planting date x seeding depth interaction (What’s Cropping Up?, vol.24, no.1, 2014, p.7-8). The 1.5 and 2.0 inch seeding depths, however, did have a significant 4% yield advantage when compared with the 2.5 and 3.0 inch seeding depths but yielded the same as the 1.0 inch seeding depth. Wet spring conditions prevailed in 2013 (3.6 inches of May precipitation), however, so soil conditions did not become dry in the top 1.0 inch until late May, which contributed to the similar yield at the 1.0, 1.5, and 2.0 planting depths in 2013. Wet spring conditions prevailed again in 2014 (4.2 inches of precipitation in May), which again negated a reduction in plants/acre on most planting dates. Root lodging did not occur in this study in 2013.

Table 3. Corn plant populations at the 4th leaf stage (V4) at four seeding depths planted on four farms from May 7 to May 15 in 2013 and from May 14 to June 2 in 2014.

Growers at three of the sites in the field-scale studies had new planters in 2013 so depth control and seed metering were optimum. Nevertheless, plant populations had year x location x seeding depth interactions in the field-scale studies, illustrating that the optimum planting depth depends equally upon soil conditions at and shortly after planting as the actual planting depth itself (Table 3). The Cayuga County site, a well-drained silt loam soil in both years, had ideal conditions at planting (moist at planting and a light shower after planting) in 2013 and plant populations (and yield) did not differ among seeding depths. In 2014, however, dry conditions prevailed for 10 days after planting at the Cayuga Co. site and the 1.0 inch seeding depth had ~ 3000 fewer plants/acre compared with the other seeding depths. At Livingston County, pre-emergence herbicide injury resulted in severe damage to stand establishment in 2013 (~2.0 inch rainstorm shortly after planting) greatly reducing plant populations (and yield). In 2014, dry conditions prevailed for 2 weeks after planting and the 1.0 inch depth had more than 6000 fewer plants/acre compared with the 2.0 and 2.5 seeding depths. Obviously, the grower will not plant below the 2.0 inch depth at this site in the future.

Dry conditions also prevailed for 15 days after planting on the silty clay loam soil at the Orleans Co. site in 2013 resulting in ~2000 fewer plants/acre (and 12 bushel/acre lower yield) at the 1.0 inch compared with the 2.0 and 2.5 inch seeding depths. In 2014, a torrential downpour occurred within minutes of planting at Orleans Co. The silty clay loam soil at this site apparently developed significant soil crust upon drying, which contributed to 2000 to 4000 fewer plants/acre at the 2.0 and 2.5 inch depths compared with the 1.0 inch depth. Likewise, in 2013 at the Seneca Co. site, torrential rainstorms (3.0 inches) occurred a few days after planting resulting in significant crusting upon drying on this clay loam soil, which contributed to ~2500 to 6000 fewer plants/acre (and 10-15 fewer bushels/acre) at the 2.0 and 2.5 inch depths compared with the 1.5 inch depth. In 2014, dry conditions prevailed after planting but this no-till site had ample moisture in the top inch for similar emergence rates as from the deeper soil depths. Root lodging was not observed at the 1.0 inch depth at any sites in 2013.

In closing, soil conditions play an equal role as seeding depth does for corn stand establishment. Generally, planting depth should be shallower on heavier soils but not always as indicated by the 2.0 and 2.5 inch depths having the greatest plant populations because of dry conditions after planting at Orleans Co. in 2013. The 1.0 inch planting depth is usually too shallow because of dry soil conditions (Orleans Co. in 2013 and Cayuga and Livingston Co. in 2014 or can result in herbicide damage to the shallow-planted seed at Livingston Co. in 2013). On the other hand, torrential rains after planting can reduce plant populations, especially on heavier clay soils (Seneca Co. in 2013 and Orleans Co. in 2014). Overall, the 1.5 inch seeding depth provided the most consistent plant populations in the field-scale studies (but yields were higher at the 2.0 and 2.5 inch depths at Livingston and Orleans Co. in 2013). Once we get the yield data from 2014 we will summarize our findings. Based on the plant population data, there does not appear to be a “one size fits all optimum seeding depth” and the optimum seeding depth depends equally on soil and weather conditions as actual planting depth.