Soybean Planting Depth Affects Plant Populations But Not Always Yield

Bill Cox, School of Integrative Plant Science, Soil and Crop Sciences Section, Cornell University

Correct soybean planting depth is considered essential for maximum soybean yields. Too shallow a seeding depth (<1.0 inch) may result in poor early stand establishment. Soybean must imibibe half of its weight in water before it germinates. Tilled soils may dry out in the top inch after planting, resulting in the initiation of the emergence process but not completion. Consequently, poor stand establishment can occur at a shallow planting depth because of seed desiccation under extended dry periods after planting. On the other hand, planting deeper than 2.0 inches may also result in poor stand establishment. The soybean hypocotyl, the plant part that breaks through the soil surface during soybean emergence, is somewhat fragile. Heavy rains after planting may result in soil crusting, resulting in hypocotyl damage and unsuccessful emergence, especially for deep-planted soybeans struggling to break through a thick soil crust.

We conducted field-scale (5 to 10 acre) studies in 2013 and 2014 with growers in Cayuga, Livingston, and Tompkins County to evaluate early plant populations and yield of soybeans planted at 1.0, 1.5, 2.0, and 2.5 inch depths. Group II varieties were used at all sites but varieties differed as did planting dates (May 8 and May 24 at Cayuga Co.; May 27 and June 6 at Livingston Co.; and May 18 and June 2 at Tompkins Co. in 2013 and 2014, respectively), and seeding rates (~140,000 seeds/acre at Cayuga and Livingston Co. and ~175,000 seeds/acre at Tompkins Co.). Silt loam soils predominated at the Cayuga Co. site, clay loam soils at the Livingston Co. site, and gravelly loam soils at the Tompkins Co. The Cayuga Co. site (30-inch rows) was no-tilled, and the Livingston and Tompkins Co. sites (15-inch rows) were chisel-tilled. Corn was the preceding crop at all sites.

Negative linear responses of plant populations to seeding depths were observed at Livingston and Tompkins Co. sites in both years, indicating a decrease in early plant populations as seeding depth increased from 1.0 to 2.5 inches (Table 1). In contrast, seeding depth did not affect early soybean plant populations at the Cayuga Co. site in 2013, and showed a positive quadratic response to seeding depth in 2014 (no significant increase in early plant populations beyond the 1.5 inch depth). It is not clear if soil type (silt loam soil), row spacing (30-inch rows), land preparation (no-till), or planting date (earliest planting date among three locations in both years) influenced the different response at the Cayuga Co. site, or if the response was unique to this particular farm. Visual observation during plant population estimates in 2014, however, indicated poor penetration of the planter unit in one of the rows at the 1.0 inch depth, resulting in low plant populations in that row, suggesting that the response was unique to this farm in Cayuga Co.

Table 1. Plant populations of soybean at ~1st trifoliate leaf stage (~V2) at three locations and four seeding depths in the 2013 and 2014 growing seasons.

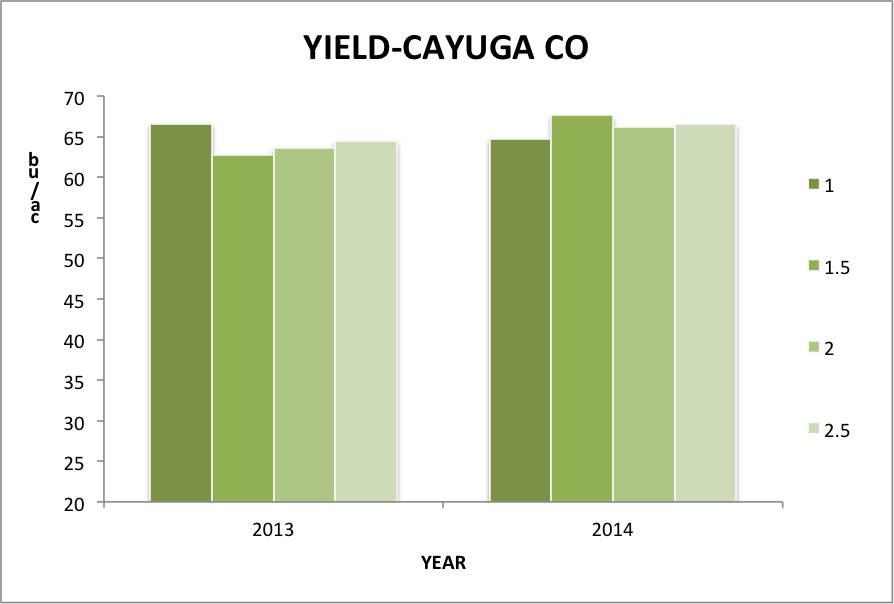
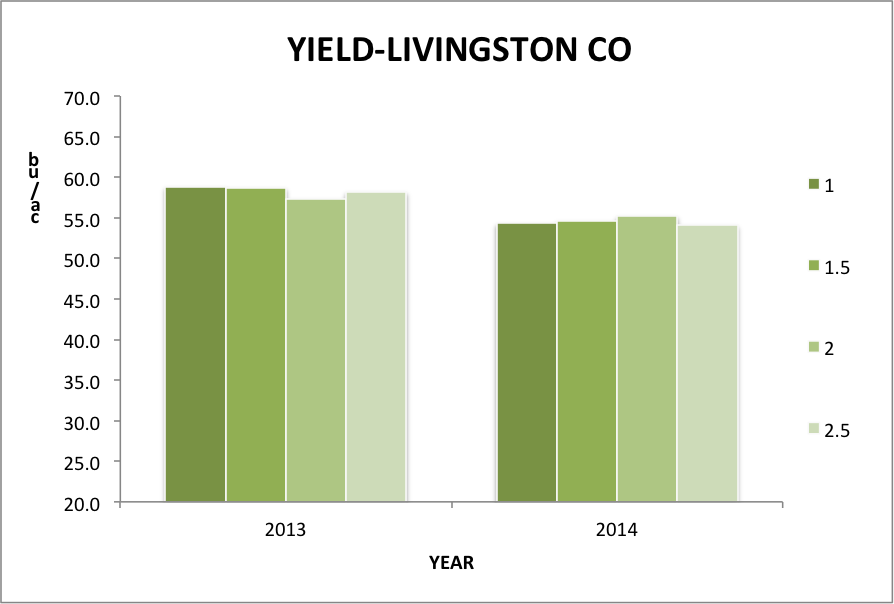
Early plant populations at all sites in both years exceeded ~114,000 plants/acre, except at the 2.5 inch depth at Livingston Co. in 2013, the threshold below which soybeans yields decreased in previous studies in NY (Cox and Atkins, What’s Cropping Up, Vol.21, No.2, p. 5-6). Consequently, it was not clear until harvest if plant population decreases with deeper seeding depths were of sufficient magnitude to result in yield differences. Soybean yields at the Cayuga Co. site showed a positive quadratic response to seeding depth with maximum yield occurring at the 1.0 depth in 2013, despite no differences in early plant populations (Fig.1). In 2014, the 1.5 inch depth yielded the greatest (least at the 1.0 depth with early plant populations of ~111,000 plants/acre) , similar to the early plant population response (Fig.1). Despite negative linear responses of early plant populations to seeding depth at the Livingston Co. site, yields did not respond to seeding depth in either year of the study (Fig.2). Evidently, early plant populations of ~112,000 plants/acre in 2013  was sufficient to attain maximum soybean yield at this site. Soybean yields showed a positive quadratic response to seeding depth at the Tompkins C. site in 2013 with maximum yields occurring at the 1.5 inch depth, but yield did not respond to seeding depth in 2014 (Fig.3). It is not clear why the early plant population response to seeding depth was consistent across years, but the yield response to seeding depth was inconsistent across years at this location.
Cox field scale fig 1
Fig.1 Soybean yield at a Cayuga Co. farm at 1.0, 1.5, 2.0, and 2.5 inch seeding depths in 2013 and 2014.
Fig.2 Soybean yield at a Livingston Co. farm at 1.0, 1.5, 2.0, and 2.5 inch seeding depths in 2013 and 2014.
Fig.3 Soybean yield at a Tompkins Co. farm at 1.0, 1.5, 2.0, and 2.5 inch seeding depths in 2013 and 2014.

Conclusion

Late May and early June conditions were generally wet and warm at all locations in both years so weather conditions were not conducive to drying of the seed at the 1.0 inch seeding depth, nor soil crust development and subsequent hypocotyl damage to deep-planted soybeans. Consequently, soil and weather conditions were close to ideal for soybean emergence. Nevertheless, deeper seeding depths (2.0 to 2.5 inch range) consistently decreased early plant populations at two sites in both years, indicating that deeper planted soybeans, especially beyond the 1.5 inch depth, can result in poorer stand establishment even under ideal emergence conditions. At the third site, however, where soybeans were no-tilled in 30-inch rows, seeding depth had minimum effect on early plant populations, except at the 1.0 inch depth in 2014, when one planter unit had trouble penetrating the soil. It is not clear if 30-inch row spacing (~8 seeds/foot of row combining to break through the soil compared to 4-5 seeds/foot of row in 15-inch rows) allowed for better emergence from the deeper seeding depths at this location.

Yield did not respond to seeding depth in 3 site/years and showed quadratic responses in 3 site/years.  Yield differences, however, were generally small at responsive sites with only 4.5 to 6.0% differences between the highest and lowest yields at the 30-inch row, no-tilled site, and 7.0% at the gravelly loam site. Despite the somewhat muted yield responses in this study, in part because of ideal conditions for emergence (>72% for all seeding depths at all sites in both years), soybean growers should be mindful that the 1.0 inch seeding depth can be too shallow in some instances (Cayuga Co. in 2014) and the 2.5 inch seeding depth can be too deep in some instances (Tompkins Co. site in 2013). The 1.5 inch seeding depth generally resulted in excellent early stand establishment (>85% emergence for all site/years except for 77% at Tompkins Co. site in 2013) and maximum yield in two of the three instances where yields responded to seeding depth. Growers should probably strive to be ~1.5-2.0 inch seeding depth range to avoid potential desiccation of the seed at depths < 1.5 inch and potential soil crusting problems at depths >2.0 inches.

Resistance to Brown Stem Rot May Be Needed in Future Soybean Varieties for New York State

Jaime A. Cummings and Gary C. Bergstrom, School of Integrative Plant Science, Plant Pathology and Plant-Microbe Biology Section, Cornell University

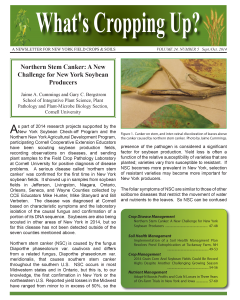
A potentially yield-reducing disease called ‘brown stem rot’ (BSR) was confirmed for the first time in New York soybean fields in 2013, and was found again in 2014.  It showed up in some plants from soybean fields in Cayuga, Herkimer, Niagara, and Yates Counties collected by Cornell Cooperative Extension Educators Kevin Ganoe, Keith Severson, Michael Stanyard, and Bill Verbeten, with support from the New York Soybean Check-off Program.  The disease was diagnosed in the Field Crops Pathology Laboratory at Cornell based on characteristic symptoms and the laboratory isolation of the causal fungus and confirmation of a portion of its signature DNA sequence. So far, BSR has not been detected outside of the four counties mentioned above.  It is noteworthy that BSR was not detected in soybean fields in northern New York scouted in 2013 and 2014 by CCE Educators Michael Hunter and Kitty O’Neil, with support from the Northern New York Agricultural Development Program.

Brown stem rot is caused by the fungus Cadophora gregata (syn. Phialophora gregata) and occurs in most soybean production regions of the US, but this is, to our knowledge, the first confirmation in New York or the northeastern U.S.  Reported yield losses in the Midwest have ranged from minor to in excess of 25%, so the presence of the pathogen is considered a significant factor for soybean production. Yield loss is often a function of the relative susceptibility of varieties that are planted; varieties vary from susceptible to resistant.  BSR is a disease of priority to soybean seed companies.  Resistant varieties are widely available, and most seed catalogs provide resistance ratings for BSR.  If BSR becomes more prevalent in New York, selection of resistant varieties may become more important for New York producers.

The foliar symptoms of BSR are similar to those of other soilborne diseases that restrict the movement of water and nutrients to the leaves.  So BSR can be confused with northern stem canker and sudden death syndrome, all of which result first in yellowing and then browning of leaf tissues between the veins during pod-filling stages.  However, not all soybean varieties exhibit foliar symptoms when infected with the BSR fungus.  What is distinctive about BSR is the browning of the internal tissues of infected plants (Figure 1).  This discoloration is often most obvious near the nodes when stems are split lengthwise.  Dead leaves may remain attached to the plant. Stem discoloration symptoms may be confused with those caused by white mold, northern stem canker, or Phytophthora stem rot.

Figure 1.  Foliar symptoms and browning of internal stem tissues caused by brown stem rot.  (Photo courtesy of Iowa State University http://www.ipm.iastate.edu/ipm/icm/2006/9-18/sds.html )
Figure 1. Foliar symptoms and browning of internal stem tissues caused by brown stem rot. (Photo courtesy of Iowa State University http://www.ipm.iastate.edu/ipm/icm/2006/9-18/sds.html )

Infection by the fungus occurs early in the season, through the roots, from where the fungus continues to grow throughout the plant’s water-conducting tissues.  Temperature has the greatest impact on disease development, and is favored by temperatures between 60 – 80F.  But, temperatures above 80F may halt BSR development and spread.  Because infection occurs at early stages (around the three leaf stage) of the crop, foliar fungicides applied during flowering and pod-filling stages will not be effective in suppressing BSR.

The fungus survives on soy residues and in the soil in the field for many years. Luckily, the pathogen survives on few other plant species, and in severely infested fields, a rotation of at least 3 years out of soybean and deep plowing of infected soybean residues would reduce the incidence of BSR in a subsequent soybean crop.

The most important thing that a New York soybean producer can do at this time is to learn to recognize the symptoms of BSR and other soilborne diseases and to get a diagnosis of problems that they observe in their fields.  If BSR or other soilborne diseases are confirmed, producers should talk to their seed supplier and order soybean varieties with appropriate levels of resistance for the soilborne diseases observed on their farm.

Acknowledgements: This research received financial support from the New York Soybean Check-off Research Program, the Northern New York Agricultural Development Program, and Cornell University Hatch Project NYC153473.

Developing a CUCE / High School Research Partnership

Aaron Gabriel, Senior Extension Educator, Cornell Cooperative Extension, Capital Area Agriculture & Horticulture Program

Over the last three years, I have been developing a partnership with high schools to have their students participate in my research projects.  It started out with my interest in black cutworm.  As I scouted corn fields, many of the skips were not due to rocks or soil conditions, as farmers often assume.  Black cutworm frequently was the culprit (as well as birds).  To collect enough data to support my observation, would take a lot of time for one person.  So, I developed a protocol for determining the cause of skips in corn and contacted several high schools to see if they wanted their students to participate in field research.  I found interest at Berne/Knox/Westerlo (BKW), Greenwich, Salem, New Lebanon, and Taconic Hills High Schools.  I also found interest from a 4-H club in Columbia County and one Master Gardener.

It just so happens that there is a nation-wide effort to engage students in STEM (science, technology, engineering, and math).  The desire to engage students in a research experience and the need for Cooperative Extensions to do research is coming together into a successful partnership.  To obtain financial support, grant writing has taken a new perspective.  I received two small grants from regional foundations, not to study the pedestrian black cutworm, or nematodes (which have been studied for many years), but to give students a research experience by involving them in relevant local Cooperative Extension research.  The program objectives focus on the students and on helping the local agricultural community, not on solving a specific agricultural problem.

Program Objectives:

  • Develop a 4-session high school curriculum to give students a real-world research experience that will:
    • Teach students how to conduct and interpret research.
    • Help students recognize their interest and potential in pursuing careers in science and research.
    • Teach students how to critically evaluate research that is broadcast through news media.
  • Conduct agricultural research that will:
    • Provide useful information that CUCE can extend to farmers for positive impacts.
    • Give students an experience to help them better understand agricultural.
    • Teach students the impact that research has on the community.

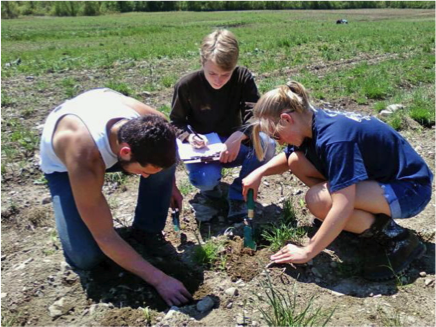
My first collaboration was with a class of BKW Advanced Placement Biology students in late May, 2012.  Having taken their last exam in mid-May, like all AP Biology students in New York, they needed some projects until the end of the year in mid-June.  First, I gave them a presentation in class to explain the dilemma of missing corn plants and my interest in the black cutworm (BCW).  I armed them with a data collection sheet, tools, and pictures of the insects, bugs, and diseases they might find digging in a corn field looking for the culprits that cause skips in corn.  The first field we sampled was an early-planted corn following sod.  The seed had a low dose of seed-applied insecticide.  The sod and weeds had not yet been sprayed with herbicide.  There were many missing corn plants.  To my surprise, at most of the skips they were finding seedcorn maggot pupae.  We learned that at high pressure, the low-dose of seed-applied insecticide did not provide protection.  The corn population was reduced by 23% to 21,017 plants/acre, with 30% of the skips due to seedcorn maggot.  Seedcorn maggot was not as severe in other fields.

Berne/Knox/Westerlo students tallying the causes of missing corn plants.  Seedcorn maggot was the most prominent culprit.  The low-dose of seed-applied insecticide could not fully protect this early-planted field after sod.
Berne/Knox/Westerlo students tallying the causes of missing corn plants. Seedcorn maggot was the most prominent culprit. The low-dose of seed-applied insecticide could not fully protect this early-planted field after sod.

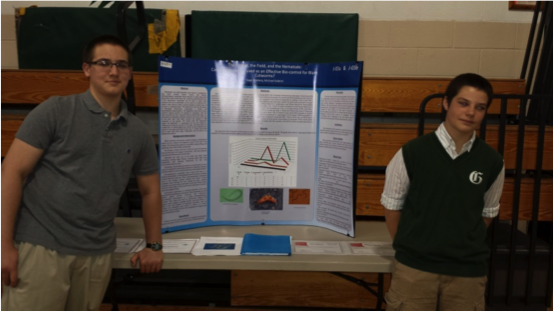
Currently, I am doing research to learn how to use beneficial nematodes to control insect pests in corn (grubs, black cutworm, and corn rootworm).  Two students helped me by doing a bioassay in the lab to confirm that our nematodes would infect BCW.  They entitled their project, “The Farmer, the Field, and the Nematode”, entered it into the Greater Capital Region Science and Engineering Fair and won the environmental award.

Two Junior High School students received an environmental award at the Greater Capital Region Science and Engineering Fair for a doing a bioassay that showed the nematodes were lethal to black cutworm.

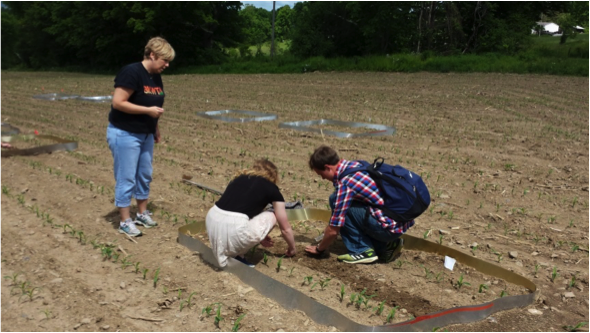
With confidence that these nematodes (from the lab of Dr. Eslon Shields, Cornell Univ.) will infect black cutworm, plots were set up to evaluate their effectiveness on BCW in the field.  Plots 5’ X 7” were treated with either nematodes or water, as a control, and then infested with purchased BCW.  Fields were located in Salem and Berne.  AP Biology students from the local schools helped infest the plots and collect data to compare the damage from the two treatments.  Nematodes did kill some of the BCW, but damage between the two treatments was similar.

Students help set up field plots of nematodes and black cutworm, and then collected the data to compare cutworm damage in the two treatments.

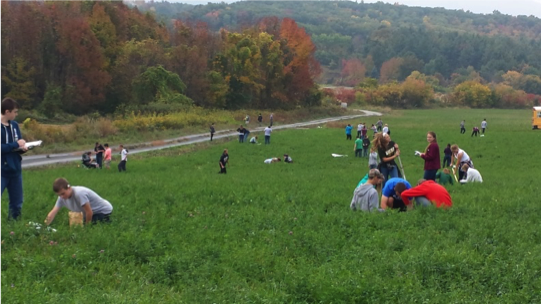
As I was trying to figure a new way to get the nematodes established in a field before the corn crop, Donna McGovern, BKW teacher, asked if I had a project for her entire class of ninth-grade biology students.  We developed a plan to apply the nematodes to a white grub-infested hay field before it would be planted to corn.  So, 52 biology students sampled 160 locations and collected and tallied up the white grubs in two fields.  On my own, I could never sample the grub population like that.  Nematodes were applied and corn will be planted in the spring.  This time, some plots will be infested with BCW, and others with corn rootworm.  The students will be there to collect the data on BCW damage.  Since rootworm damage is evaluated in July, I will need to find a 4-H club to help, or students that want an education outside of the school year.

Fifty-two biology student sample 160 locations to determine the white grub population.  Nematodes will establish themselves on the grubs before the corn is planted, and then lay in wait next spring to protect the corn seedlings.
Fifty-two biology student sample 160 locations to determine the white grub population. Nematodes will establish themselves on the grubs before the corn is planted, and then lay in wait next spring to protect the corn seedlings.

Students have also performed lab bioassay experiments and determined that nematodes will not survive in pop-up fertilizer, unless it is diluted with 50% water.  The purpose is to evaluate other methods of applying nematodes (which are suspended in water).  New Lebanon students determined that our nematodes do not infect fly larvae, like the seedcorn maggot.  These fairly simple experiments give students a real research experience and help me generate the information I need as a CCE educator to help local farmers.

The next step of the CCE / School Research Partnership is to complete development of a 4-session curriculum that can be used by any pair of Extension Educator and school teacher.  This is currently underway where students will learn how to research a topic, formulate a hypothesis, design an experiment, do the experiment, analyze the data and make conclusions.  The finale of the curriculum will be to visit a local farm and learn how research has shaped agriculture and how it impacts farmers.

What’s Cropping Up? Vol. 24, No. 5 – September/October – Full Version

WCUVol24No5The full version of What’s Cropping Up? Volume 24, No. 5 is available as a downloadable PDF.  Individual articles are available below:

2014 Grain Corn And Soybean Yields Could Be Record Highs Despite Another Challenging Growing Season

Corn and soybeans are typically planted sometime in May and mature from mid-to late September. Consequently, their growing seasons in NY are considered to occur from May 1 through September 30, with the understanding that an additional ~100 growing degree days (GDD) can be accumulated in October before the first fall frost; offsetting the loss of ~100 GDD from May 1 until either crop is planted. The 2014 growing season started slowly for both crops because of wet conditions during the first 20 days of May in most grain corn and soybean growing regions. Consequently, only 15% of corn and less than 1% of soybeans had been planted in NY by May 15th. The second half of May was dry in most regions so 58% of corn and 31% of soybean had been planted by June 1. By June 8th, 79% of corn and 46% of soybean had been planted by June 8th. Consequently, almost half of the NY corn crop (probably 75% of the grain corn crop) did not accumulate the typical 300 GDD that most grain corn and soybean regions receive in May. In addition, growing conditions were cool from mid-July though most of September and there were reports of isolated frost in some parts of the state on the morning of September 19th. So what is the outlook for grain corn and soybeans in NY in 2014?

In many respects, the 2014 growing season was similar to the 2013 growing season; mostly wet soil conditions in the spring and summer, followed by cool August and September conditions, and even a light frost in isolated pockets of the State in mid-September, although not in the major grain corn and soybean growing regions. So let’s examine both growing seasons and see if the 2014 crops will be similar to the 138 bushel/acre corn crop (3rd highest state average on record) and the 48 bushel/acre soybean crop (tied for the highest state average on record) in 2013. About 70% of the grain corn and 85% of NY soybeans are grown in western NY and the Finger Lakes regions so my discussion will mostly be in the context of the growing season in those regions.

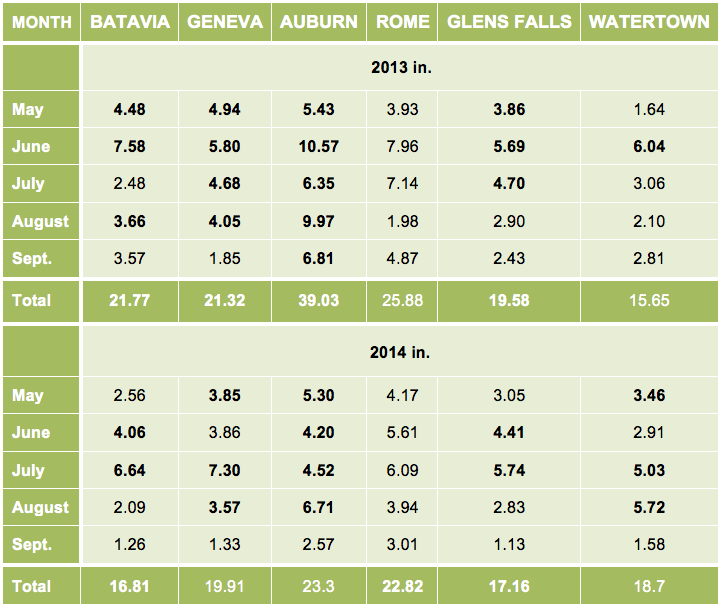
The second half of May and the month of June were exceedingly wet in 2013 (Table 1), resulting in drowned out grain corn in poorly drained areas of many fields. In addition, the somewhat poorly drained areas of most fields had stunted corn that was yellow during grain-filling because most of the pre-plant or at planting N fertilizer denitrified. Despite ideal growing conditions for the remainder of the 2013 growing season (more than adequate precipitation in July and August and below normal growing degree days from July 20 through September, Table 2), the damage had been done. So instead of the projected 150 bushel/acre grain corn yield ,based on grower surveys in October and November (who apparently were just looking at the high-yielding corn in the drained areas), the final crop came in at 138 bushels/ acre because of the early-season damage to the crop. Soybeans, on the other hand, are not quite as sensitive to wet soils in June and can fill in somewhat if gaps occur due to drainage problems. Consequently, soybean yields came in 1 bushel/acre higher than the projected 47 bushel/acre crop, based soybean grower surveys in October and November.

Table 1. Monthly and total precipitation during the 2013 and 2014 corn and soybean growing seasons. Bolded numbers indicate above-average precipitation compared with the 30 year mean (excluding Rome, which only has 9 years of data).

What about the 2014 crops?  Well, the late planting of corn in 2014 may have been been a blessing in disguise (because both crops avoided the wet May conditions and most of the ensuing problems that the 2013 crops suffered from). Despite somewhat wet June soil conditions, only the poorly drained areas (and not the somewhat poorly drained areas of each field) suffered some stunting of growth and much less denitrification of pre-plant or at planting fertilizer N compared to the 2013 growing season. In addition, July was wet as was the first half of August in most regions so corn was essentially stress-free through the early grain-filling period. Some grain corn fields did encounter dry conditions during September but temperatures were cool so minimal stress would have been incurred. Likewise, soybeans never experienced any real drought stress in August and September because of the cool conditions. Consequently, based on soil and growing conditions in 2014, the September projected 2014 corn yield of 150 bushels/acre and a record soybean crop of 49 bushels/acre in NY might be right on.  

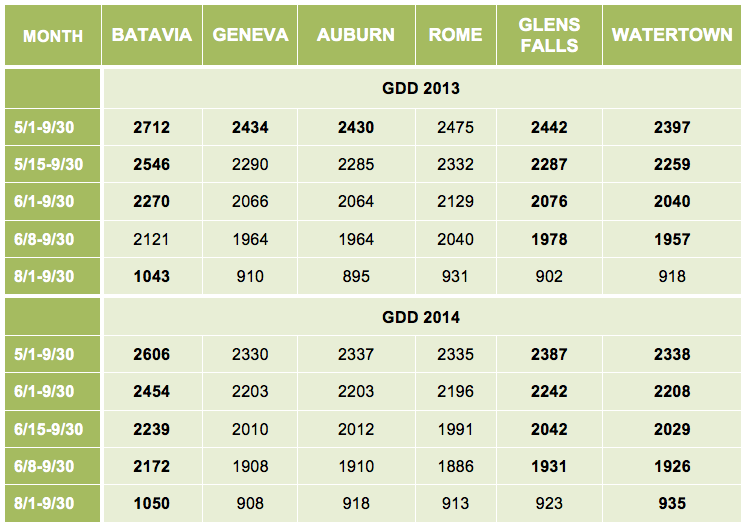
But what about the late planting date for both crops, coupled with the perceived cool growing season?  Will that hurt the 2014 corn crop and reduce the projected yield from 150 bushels/acre to 138 bushels/acre as in 2013? Believe it or not, western, eastern and northern regions of NY had above average growing degree days from June 1 through September 30 so delayed planting in those regions are not much of a concern (Table 2). In the Finger Lakes region, however, total GDD from June 1 until September 30 were about 100 below normal (Table 2), raising concerns about crop maturity. Most grain corn and soybean fields in Western NY and the Finger Lakes fortunately have not had a frost event and no frost is in the forecast through mid-October for those regions. In addition, both regions have already accumulated an additional 50-60 GDD through the first 5 days of October. Consequently, if the growers scaled back their hybrid maturity and the crop silked out by early August, enough GDD should have accumulated before a frost so grain corn should mature, albeit with delayed harvest well into November. If growers did not scale back their hybrid maturity when planting grain corn during the first week of June in the Finger Lakes, maturity could be an issue. Soybeans, on the other hand, respond more to photoperiod when planted in June so even if soybean growers did not scale back maturity, soybeans should make it (a 2.4 Maturity Group that we planted in a planting date study at Aurora on May 29 was at maturity or the R8 growth stage on October 1 and planted on June 11 was at the R8 growth stage on October 7th). So I am not concerned with maturity for most of the soybean crop.

Table 2. Growing Degree Days (GDD, 86/50 system) in 2013 and 2014 from four planting dates through September 30 and growing degree days from August 1 through September 30, which is typically the grain filling period for corn and the pod set and seed filling period for soybeans in NY. Bolded numbers indicate above average growing degree days compared with the 30 year mean (excluding Rome, which only has 9 years of data).

In conclusion, despite another very challenging and yes stressful year from a grower perspective (delayed planting in the spring and fear of potential frost in the fall), yields, according to the grower surveys in September, should come to fruition. The next report is due on October 10th , based on growers surveys in late September, and I hope that the isolated frost reports in the non-major grain corn and soybean growing regions don’t bias the yields down. In fact, light frosts occurred in isolated pockets of these regions on the morning of September 17th in 2013 (31 in Ithaca and Watertown), which escaped the September 19th frost of 2014 (32 in Ithaca and Watertown). So in many respects the 2013 and 2014 growing seasons, including the light September frosts in isolated pockets, were similar, which should bode well for soybean yields. For grain corn, the blessing in disguise of the delayed planting date probably reduced crop damage during vegetative growth compared to 2013,, resulting in 5-6% higher State yields or about 150 bushels/acre. We won’t really know until the crops are in the bin so let’s hope for a great harvest season for both crops.

Adapt-N Boosts Profits and Cuts N Losses in Three Years of On-Farm Trials in New York and Iowa

Bianca Moebius-Clune, Margaret Ball, Harold van Es, Jeff Melkonian – School of Integrative Plant Science, Soil and Crop Sciences Section – Cornell University

Adapt-N is an on-line tool that provides location-specific, weather-adjusted nitrogen (N) recommendations for corn. At sidedress time, critical early-season weather that strongly influences actual N needs is incorporated into the recommendation. To accomplish this, the tool uses 1) a simulation model that was developed and calibrated through field research over several decades, 2) high resolution 2.5 x 2.5 mile daily temperature and precipitation information, and 3) soil and crop management information entered via a web interface on any internet-capable device. Adapt-N’s cloud-based environment (central data server, high security, and accessibility through desktop, laptop and mobile devices, future embedding in other farm software) offers a user-friendly experience.

We conducted a total of 104 strip trials in 2011, 2012, and 2013 in New York and Iowa (Figure 1) to beta test Adapt-N for its ability to improve recommendations for corn N need at sidedress time. Yield data and simulated losses across trials show that the Adapt-N tool significantly increased grower profits, while decreasing N inputs and environmental losses, as summarized in this article. In 2014, Adapt-N was commercialized through a public-private partnership between Cornell University and Agronomic Technology Corporation (ATC, see http://www.adapt-n.com/).  The partnership aims to sustain and broaden the tool’s availability, customer service, usability, and integration with existing farm management technologies, while allowing for continued research and development at Cornell University.

Methods

We completed 67 replicated strip trials in New York (14 in 2011; 42 in 2012; 11 in 2013) and 37 trials in Iowa (9 in 2011; 19 in 2012; 9 in 2013) on commercial and research farms throughout each state (Figure 1. One 2012 trial in Minnesota is included with the Iowa trials).

3yearsfig1
Figure 1. Map of 2011-2013 trial locations (map courtesy of batchgeo.com)

Sidedress treatments involved at least two rates of nitrogen, a conventional “Grower-N” rate based on current grower practice (G) and an “Adapt-N” recommended rate (A).  An Adapt-N simulation was run for each field just prior to sidedressing to determine the optimum weather-adjusted N rate.

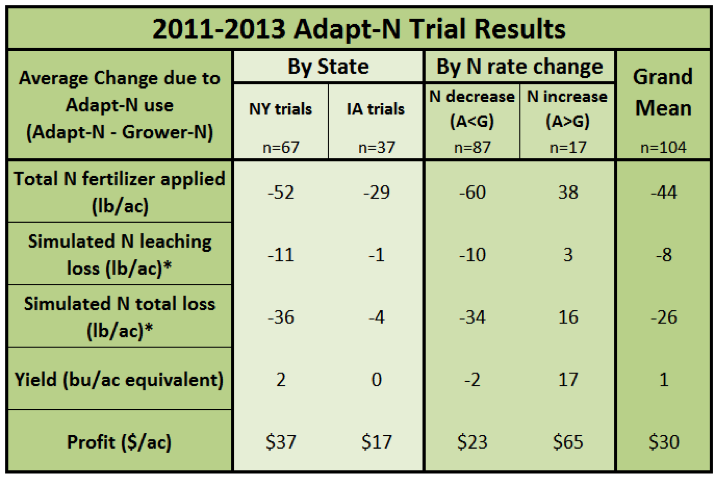
Table 1. Agronomic, economic and environmental assessment of model performance in 2012. Values are average differences resulting from Adapt-N use (Adapt-N minus Grower-N treatment) such that a negative number shows a decrease due to Adapt-N, a positive number shows an increase due to Adapt-N.
Table 1. Agronomic, economic and environmental assessment of model performance in 2012. Values are average differences resulting from Adapt-N use (Adapt-N minus Grower-N treatment) such that a negative number shows a decrease due to Adapt-N, a positive number shows an increase due to Adapt-N. *Simulated N leaching losses and N total losses do not include 2011 IA trials – data not available.

Yields were measured by weigh wagon, yield monitor, or in a few cases by representative sampling (two 20 ft x 2 row sections per strip). Partial profit differences between the Adapt-N and Grower-N practices were estimated using prices of $0.50/lb N, $5/bu grain, $50/T silage, and $8/ac operational savings if sidedress was avoided in either the Adapt-N or Grower treatment. Yields were used as measured, regardless of statistical significance, since the statistical power to detect treatment effects for a single experiment is inherently low.

Total N losses to the environment (atmosphere and water) and N leaching losses were simulated by Adapt-N for each N treatment, through the end of each growing season. End dates for N loss simulation were October 30, 2011 (NY trials only), December 15, 2012, and December 31, 2013. More detailed descriptions of each year’s methods and results were provided in previous WCU articles (Moebius-Clune et al., 2012, 2013, and 2014).

Agronomic and Economic Comparison

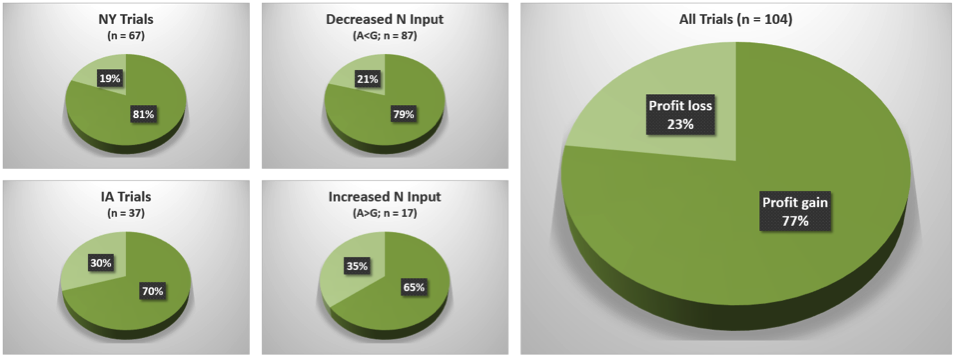
Adapt-N rates resulted in average N input reductions of 52 lbs/ac in NY, 29 lbs/ac in IA, and 44 lbs/ac overall (Table 1). Profit gains from the use of Adapt-N were considerable.  Profits increased in 81% of all NY trials, in 70% of all IA trials, and in 77% overall when growers followed Adapt-N recommendations (Figure 2). Profit gains of $30/ac on average ($37/ac in NY, $17/ac in IA) were obtained most frequently due to reductions in N inputs, without significant yield loss: +1 bu/ac on average across all trials. Most collaborating growers were already using progressive N management including sidedressing, so that benefits achieved in these trials can be considered to be a conservative estimate of potential benefits of using Adapt-N. Benefits will be higher for growers who currently use few N best management practices.

Figure 2. Proportion of trials with profit gains (dark green) or losses (light green) as a result of using the Adapt-N recommendation compared to current grower N management in 2011-2013 trials. With appropriate use of the most up-to-date version of Adapt-N, success rates can be further improved.

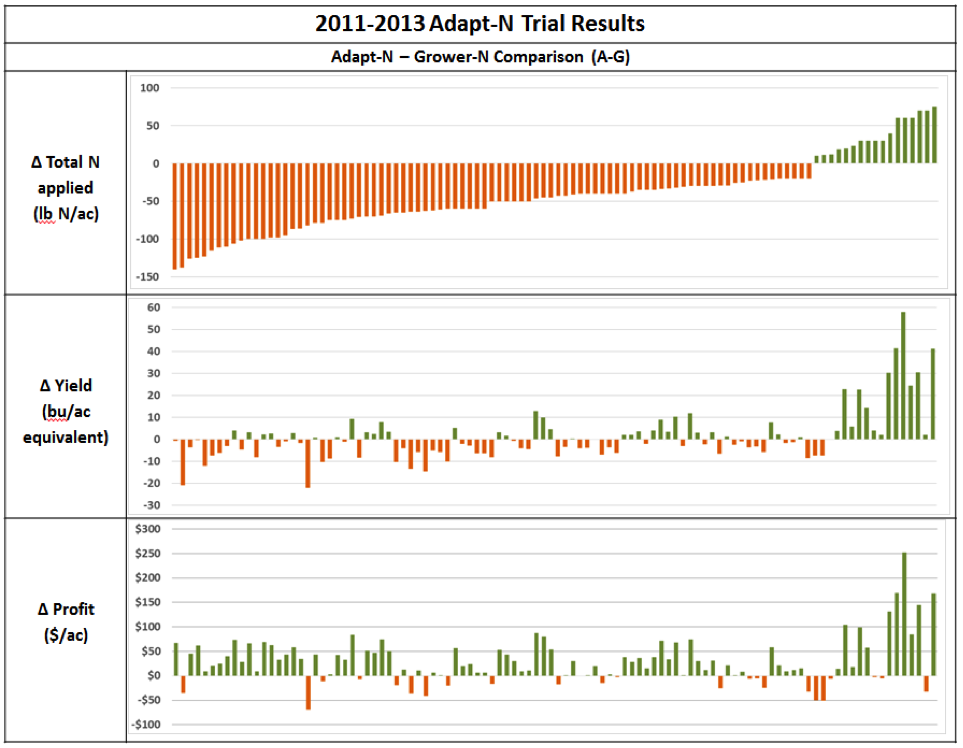
Decreased N rates: Adapt-N recommended a lower N rate than grower practice in 84% of trials, by 60 lbs/ac on average (Table 1). Such recommendations occurred after a normal or dry spring, when N from spring mineralization or early fertilizer applications remains available to the crop. Yield losses were generally minor, averaging -2 bu/ac across trials with N reductions, and leading to profit gains in 79% of cases – on average $23/ac (Table 1, Figures 2 and 3). This implies that a grower is about four times more likely to achieve increased profit from a reduced Adapt-N rate than from their current higher rate. This statistic includes all trials over three years, although model improvements have been made each year based on trial information, such that actual probabilities of increased profit with reduced N inputs are likely further improved for future years.

Increased N rates: Even larger profit gains of $65/ac on average were achieved when Adapt-N recommended increasing N inputs over the grower’s current practice in 16% of trials. Consequent average yield increases of 17 bu/ac across these trials were achieved for an average additional 38lb/ac fertilizer application (Table 1). Such higher recommendations occurred primarily in 2013 ($94/ac profit on average in NY 2013 trials), and in select locations in other years, after a wet spring. Needs for additional N were correctly identified in 65% of these cases, resulting in significant yield and profit increases. In 35% of cases, on the other hand, the additional N was not needed. In almost all of these cases, unpredictable post-sidedress drought decreased yield potential below the expected yield that was used for the recommendation at the time the sidedress rate decision had to be made (Moebius-Clune et al., 2013).

Profit loss when under-fertilizing (from reduced yields) is generally larger than when over-fertilizing (from unnecessary fertilizer application). Thus lower recommendations to account for potential future yield-limiting events cannot be justified for economical sidedress recommendations. By contrast, pre-sidedress weather events affecting yield potential and N availability are known, and Adapt-N can effectively manage this risk. Therefore, the chances of over-recommending N inputs are somewhat higher than those of under-recommending, further decreasing risk of profit loss.  For illustration, overall, profit gains greater than $50/ac occurred in 29 cases, while losses greater than $50/ac were determined in only 2 cases (Figure 3).

Figure 3. Results from each trial (n = 104) are vertically aligned. Bars show difference between Adapt-N and Grower treatments (A-G) such that negative numbers (orange) show decrease due to Adapt-N, and positive numbers (green) show increase due to Adapt-N.

Environmental Benefits

Adapt-N reduced N rates in 84% of cases, by 60 lbs N/ac on average, resulting in simulated reductions in total N losses to the environment by the end of the growing season of 34 lbs/ac, and leaching losses by 10 lbs N/ac (Table 1). Further losses of residual excess N generally occur over the winter and spring months when crop uptake ceases, soil water is recharged, and saturation or near-saturation occur, particularly in the Northeast. Thus the simulated reductions are a low estimate of actual environmental loss reductions, which are likely closer to the difference in applied N. In 16% of trials, where Adapt-N increased N rates, by 38 lbs/ac on average, total N losses increased on average by only 16 lbs/ac, and leaching losses by 3 lbs/ac. Further over-winter losses in these cases are lower, because much of the additional applied N was taken up by the crop to produce the increased yield, and thus would not be lost.

Lessons for Expert Use of Adapt-N from three years in the field

Growers can decrease risk of N deficiency, environmental losses, and yield losses, and increase profit margins.  To optimize Adapt-N use, we recommend the following:

  • Plan to apply the majority of fertilizer nitrogen at sidedress time instead of prior to or at planting. If manure is applied prior to planting or when enhanced efficiency products are used, aim for conservative rates.
  • Monitor the field’s N status and account for early season weather impacts on N availability by using Adapt-N’s daily updates.
  • Supply input information on soil and crop management that is representative of each management unit (e.g. test soil and manure based on representative samples, keep good records of operations, estimate expected yield as the second-highest out of 5 years of accurate yield information).  For each management unit, measure soil organic matter at least every 3 years, ideally to a 12” depth.
  • If appropriate, adapt input information at the time of sidedressing to account for seasonal influences, such as decreased yield potentials or shallow rooting depths from extreme wet conditions.
  • Use the most recent Adapt-N recommendation available on sidedress day. Apply sidedress N between V6 and V12, depending on N and equipment availability. Generally, later sidedressing with high-clearance applicators allows for more accurate recommendations.  Variable rate applicators can be used to adjust Adapt-N simulations for management units in fields.
  • Use Adapt-N scenario simulations after the growing season to learn more about how weather and management influence N availability.
  • In the long term, manage for healthy soils and use Adapt-N to account for N contributions from high organic matter levels and deep root zones.

Conclusions

Three consecutive growing seasons involving 104 on-farm strip trials demonstrate that Adapt-N is an effective tool for N management in corn systems, with average profit gains of at least $30/ac.  With model improvements and increased expert use of the tool, we estimate that profit gains over current grower practices can be expected in at least four out of five cases. Adapt-N generally correctly identified cases when either decreased or increased N was needed to maintain yields. The tool also provides a strong incentive to shift N applications to sidedress time when weather impacts can be accounted for in the model. By using Adapt-N, growers can contribute to solving persistent problems with greenhouse gas emissions, groundwater pollution, and hypoxia in our estuaries, while increasing profits in both wet and dry years.

For more information: Recorded webinars, a manual, and other Adapt-N training materials are available at http://adapt-n.cals.cornell.edu/. The Adapt-N tool is accessible through any device with internet access, now from the team’s commercial partner, Agronomic Technology Corporation, at http://www.adapt-n.com/ (cost is about $1-3/ac, depending on area covered). Adapt-N users can elect to receive email and/or cell phone alerts providing daily updates on N recommendations and soil N and water status for each management unit in Adapt-N.

Acknowledgements:  This work was supported by funding from the NY Farm Viability Institute, the USDA-NRCS Conservation Innovation Program, the International Plant Nutrition Institute, McKnight Foundation, Walton Family Foundation, USDA-NIFA, MGT Envirotec, and USDA-SARE.  We are grateful for the cooperation in field activities from Keith Severson, Kevin Ganoe, Sandra Menasha, Joe Lawrence, Anita Deming, Harry Fefee, Kitty O’Neil, Mike Hunter, and Brent Buchanan of Cornell Cooperative Extension, Bob Schindelbeck of the Cornell Section of Soil and Crop Sciences, Mike Davis at the Willsboro Research Farm, Dave DeGolyer, Dave Shearing and Jason Post at Western NY Crop Management Association, Eric Bever and Mike Contessa at Champlain Valley Agronomics, Eric Young at Miner Institute, and Peg Cook at Cook’s Consulting in New York, and from Shannon Gomes, Hal Tucker, Michael McNeil, and Frank Moore at MGT Envirotec. We also are thankful for the cooperation of the many farmers who implemented these trials on their farms.

References

Moebius-Clune, B.N., M. Ball, H. van Es, J. Melkonian. 2014. Adapt-N Responds to Weather, Increases Grower Profits in 2013 Strip Trials. What’s Cropping Up? 24:3.

Moebius-Clune, B., M. Carlson, H. van Es, and J. Melkonian. 2013. Adapt-N Increased Grower Profits and Decreased Nitrogen Inputs in 2012 Strip Trials. What’s Cropping Up?

Moebius-Clune, B., H. van Es, and J. Melkonian. 2012. Adapt-N Increased Grower Profits and Decreased Environmental N Losses in 2011 Strip Trials. What’s Cropping Up? 22.