Planting a Full-Season Hybrid at the ~1.5 to 2.0 Inch Depth from ~May 15 to ~May 20 Resulted in Maximum Yield (but Higher Grain Moisture) on a Silt Loam Soil in the Finger Lakes Region

Bill Cox, School of Integrative Plant Science, Soil and Crop Sciences Section and Phil Atkins, New York Seed Improvement Program, Cornell University

The average corn planting date is considerably earlier now compared to 25 years ago, especially in the Midwest USA. In NY, planting is earlier than ever but still lags behind most upper Midwest states. Certainly, the soils in the upper Midwest States are as cold as New York in late April or early May. Consequently, the slower planting pace in New York must be attributed to either wetter soils; lack of readiness, especially for dairy producers; previous negative experiences by growers with April planting dates; or lack of belief that the newer hybrids with seed treatments can be planted into somewhat cold April soils.

Most growers plant their corn at the “one size fits all” depth of 2-inches. Early-planted corn (~mid-April), however, can take 3 to 4 weeks to get out of the ground and a shallower planting depth may be beneficial for April planting dates. When planting is delayed until late May, as in 2011 and 2014, growers in NY wonder if they should switch to an earlier maturing hybrid. We conducted small-plot research at the Aurora Research Farm in 2013 and 2014 to answer three questions concerning corn planting: 1) Can corn be safely planted in early to late April on well-drained soils in NY without risk of poor stands and subsequent yield loss, 2) when should grain growers switch from a full-season to a shorter season hybrid, if planting is delayed, and 3) is the 2-inch seeding depth optimum from early April through late May planting dates?

We planted 103-day (203-44STXRIB from Channel) relative maturity (RM) and a 96-day  (DKC46-20VT3P RIB from DeKalb) RM hybrids on ~April 10, ~April 20, ~May 6, ~May 19, and ~May 30 at 1.0, 1.5, 2.0, 2.5, and 3.0 inch seeding depths at a rate of 31,800 seeds/acre in 2013 and 2014. We determined stand establishment at ~ the 4th leaf stage (V4), about 3-6 weeks after planting, depending upon planting date. We harvested all plots on October 27th in 2013 and on November 5th in 2014.

Plant populations had a significant year x planting date x seeding depth interaction (Table 1). On most planting dates in both years, seeding depth did not affect plant populations (Table 1). In 2013, however, plant populations at the early April planting date had a negative linear response to seeding depths (~27,000 plants/acre at the 1.0 and 1.5 inch planting depths, ~24,500 plants/acre at the 2.0 and 2.5 inch planting depths, and only 21,500 plants/acre at the 3.0 inch depth). Presumably, the deeper-planted corn struggled to emerge because of cool conditions, accompanied by some soil crusting. Plant populations at the late May planting date in 2013, however, had a quadratic response (fewer than 25,000 plants/acre at the 1.0 inch planting depth, ~28,000-29,000 plants/acre from the 1.5 to 2.5 inch depths, before decreasing to ~27,000 plants/acre at the 3.0 inch depth). Presumably, soil conditions dried out in the top 1-inch depth resulting in poor emergence. Likewise, in 2014, there was an extended dry period shortly before and after planting on May 19th resulting in fewer than 26,000 plants/acre at the 1.0 and 1.5 inch seeding depths. Nevertheless, the 1.5 and 2.0 inch planting depths resulted in the most consistent stand establishment across all planting dates in both years of this study.
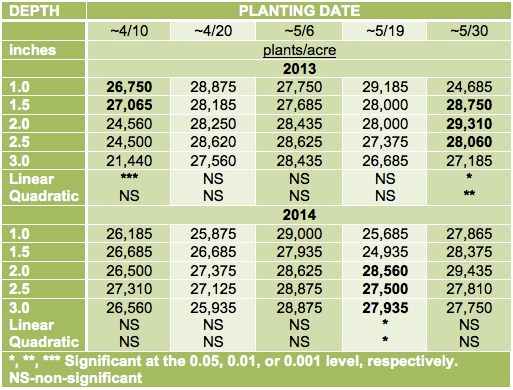
Table 1. Plant populations of corn at the 4th leaf stage (V4) at five planting dates and five seeding depths, when averaged across two hybrids, in 2013 and in 2014.

Although grain yield had no planting date x seeding depth interaction (P=0.06), the early April planting date did show a quadratic response to seeding depth with the 1.5 inch depth yielding 211 bushels/acre compared to only 189 bushels/acre for the 3.0 inch seeding depth (Table 2). On all the other planting dates, however, grain yield did not respond to seeding depth. Apparently, corn with its hygroscopic kernel can emerge adequately from a shallow depth in dry soil conditions, and with its coleoptile (seed leaf, first to emerge through the soil) can emerge adequately through crusted soils.

Table 2. Yield of corn at five planting dates and five seeding depths, when averaged across two years (2014 and 2014) and two hybrids (DKC46-20 VT3P-RIB and 203-44STXRIB).

Grain yield showed a quadratic response to planting dates with the regression equation indicating that maximum yield occurred sometime between May 15 and May 20 (Table 2). This was somewhat later than expected. We expected that maximum yields would occur sometime between April 20 and May 20, especially because plant populations showed a quadratic response to planting dates with the numerically highest populations at the May 6 planting date (~28,525 plants/acre compared with 27,450 plants/acre for April 20 and 27,385 plants/acre for the May 19 planting date, averaged across years, hybrids, and planting depths). Consequently, it is not clear why maximum yield occurred from ~ May 15-20 rather than the ~May 5- 20 planting date range.

The 103 day hybrid yielded ~5% higher (220 bushels/acre) than the 96-day hybrid (209 bushels/acre), when averaged across years, planting dates, and seeding depths. Surprisingly, there was no hybrid x planting date interaction, which indicates that the longer-season hybrid will yield more than the shorter-season hybrid when planted from early April through late May in the Finger Lakes Region of NY. On the May 19th planting date, however, grain yield averaged only 3% greater (228 bushels/acre for the 103-day compared to 221 bushels/acre for 96-day hybrid) with significantly higher grain moisture (23.5 vs.19.3%, respectively). On the May 30th planting date, grain yield averaged ~4% greater (218 bushels/acre for the 103-day compared with 210 bushels/acre for the 96 day hybrid) but with much higher grain moisture (29.8% vs. 23.5% moisture, respectively). Given the much greater drying costs or much greater delay in harvest for the 103 day hybrid to dry down when planted in late May, NY growers should probably consider switching from a full-season to a medium-season hybrid shortly after May 20.

CONCLUSION

The reluctance of many corn growers in NY to plant corn in April may serve them well as indicated by maximum yields occurring sometime between May 15 and May 20 in this study. Growers, however, cannot plant their corn crop between May 15 and May 20 each year so the question remains “how early should growers begin to plant corn NY”? Although yields were 5% lower at the April 20 planting date (213 bushels/acre) vs. the May 19 planting date (224 bushels/acre), plant populations were similar and grain moistures were lower (17.5% vs. 21.4%, respectively). Consequently, relative profit would be essentially the same (assuming $4.00/bushel corn and $0.04/point of moisture drying costs) between these two planting dates. If growers are reluctant to start as early as late April, certainly the first week of May is an excellent time given the higher plant populations (28,525 plants/acre) compared with the May 19 planting date (27,385 plants/acre), lower grain moisture (18.7% vs. 21.4%, respectively), albeit 3% lower yields (217 bushels/acre vs. 224 bushels/acre). Nevertheless, relative profit would be similar for the two planting dates, given the assumptions of $4.00 corn and $0.04/bushel/point drying costs.

Regardless, if growers begin planting in late April or early May, corn growers in NY should probably plant full-season hybrids until around May 20 because of the yield advantage (6.3% on April 20, 5.4% on May 6, and 3.0% on May 20). Grain moisture differences, however, widen at each successive planting date (17.9 vs. 17.1% for April 20, 19.8% vs. 17.7% for May 6, and 23.5% vs. 19.3% grain moisture for May 19, respectively) so beyond May 20 the higher grain drying costs would offset the yield advantage or require a delay in harvest, which could lead to more in-field losses of the full-season hybrid before harvest. Consequently, a switch to shorter-season hybrids after May 20 is probably the most economical and risk-averse management strategy.

Planting at the 1.5 inch to 2.0 inch depths consistently resulted in the highest plant populations and grain yields among seeding depths across all planting dates. The 2.0 inch planting depth had less than 80% emergence (~25,000 plants/acre) only on the April 10 planting date in 2013 and the 1.5 inch planting depth had less than 80% emergence only on the May 19 planting date in 2014. Planting depth did not affect yield, however, (except for the April 10 planting date) but the 1.5 to 2.0 inch depth looks optimum across most planting dates in this study. Keep in mind that this study was conducted on a well-drained silt loam soil in the Finger Lakes Region and does not apply to poorly drained clay soils or regions of the state where late spring frosts or early fall frosts occur.

Field-Scale Studies Show Significant Year X Location X Seeding Depth Interactions for Plant Populations and Corn Yields

Bill Cox, School of Integrative Plant Science, Soil and Crop Sciences Section, Cornell University

It is generally recognized that the 2.0 planting depth is optimum for corn stand establishment and yield. Too shallow a planting depth (<1.5 inches) may result in drying out of the seed, if extended dry conditions occur before and after planting (especially in tilled seed beds), and increased lodging because of poor brace root development. Too deep a planting depth may delay emergence under cool soil conditions (especially in heavy clay soils), leading to increased pest incidence, soil crusting, and potentially poor stands.

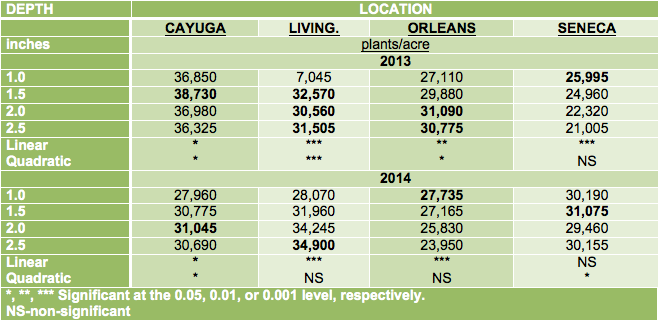
We conducted field-scale (10 to 20 acres) studies in 2013 and 2014 with growers in Cayuga, Livingston, Orleans, and Seneca County to evaluate early plant populations and yield of corn planted at 1.0, 1.5, 2.0, and 2.5 inch depths. Planting dates differed across locations and growing seasons (May 14 and June 1 at Cayuga Co.; May 6 and May 29 at Livingston Co.; May 14 in both years at Orleans Co.; and May 7 and June 2 at Seneca Co. in 2013 and 2014, respectively). Because wet conditions delayed corn planting in2014, growers at three locations had to shorten the maturity of their hybrids (P0533X at four sites in 2013; but P0216 at Orleans Co.; DKC50-84 at Seneca Co.; and P9690 at Cayuga Co. and Livingston Co. in 2014). Seeding rates also differed across locations (~38,000 kernels/acre in 2013 and 32,000 kernels/acre in 2014 at Cayuga Co.; ~37,000 kernels/acre at Livingston Co. in both years; ~34,000 kernels/acre at Orleans Co. in both years, and ~33,000 kernels/acre at Seneca Co.in both years). Silt loam soils predominated at the Cayuga Co. site, clay loam soils at the Livingston Co. and Orleans Co. sites, and silty clay loam soils at the Seneca Co. site. The Cayuga Co. site (20-inch rows) was chisel-tilled, the Livingston Co. site (30-inch rows) was moldboard- plowed, the Orleans Co, site (30-inch rows) was disk-tilled, and the Seneca Co. site (15-inch rows) was no-tilled. Soybean was the preceding crop at all locations in 2013 and at Cayuga and Seneca Co. sites in 2014, but corn was the preceding crop at Livingston (same field) and Orleans Co. in 2014.

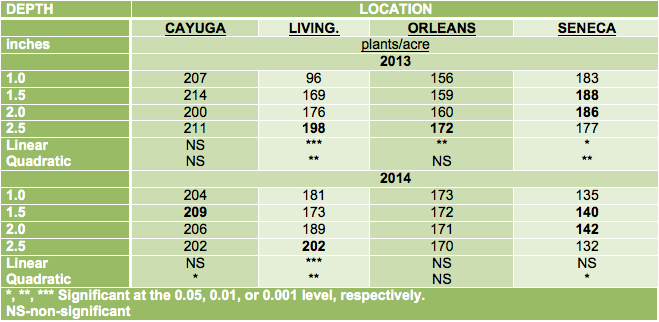
Corn plant populations responded to seeding depths at all locations in both years but the optimum depth varied across locations and years, including across years within locations (Table 1). Likewise, corn yields responded to seeding depths at all locations in both years (except for Cayuga Co. in 2013), but as with populations, the optimum depth varied across locations and years, including across years within locations (Table 2).

Table 1. Early plant populations (V3-V4 stage) at four locations in NY during the 2013 and 2014 growing seasons.
Table 2. Corn yields at four seeding depths at four locations in NY during the 2013 and 2014 growing seasons.

Plant populations did not have a year x seeding depth interaction at Cayuga County and showed quadratic responses to seeding depths in both years with maximum populations at the 1.5 to 2.0 inch seeding depths (Table 1). Yield, however, did show a year x seeding depth interaction. Yield did not show linear nor quadratic responses to seeding depth in 2013 at Cayuga Co. (although the 1.5 inch depth yielded significantly greater than the 2.0 inch depth), but did show a quadratic response in 2014 with maximum yield occurring at the 1.5 inch seeding depth. The 1.5 inch seeding depth resulted in close to maximum plant populations and yielded more than the 2.0 inch seeding depth (but similar to the 1.0 and 2.5 inch seeding depths) when planting in mid-May in 2013 or early June in 2014 on silt loam soils at this site.

Corn plant populations and grain yields had year x seeding depth interactions at Livingston Co. (mostly because of damage to corn at the 1.0 inch seeding depth in 2013). Corn plant populations showed a quadratic response to seeding depth in 2013 but a linear response in 2014. (Table 1). Plant populations and resulting yields were exceptionally low at the 1.0 inch seeding depth in 2013, presumably because heavy rains shortly after planting resulted in herbicide and/or fertilizer damage to corn planted at the 1.0 inch depth. Plant populations and grain yield showed linear responses to seeding depths in 2014 as the 2.5 inch depth had the greatest plant populations and grain yield. Extended dry conditions ensued shortly after planting at this site in 2014, which delayed and reduced emergence at the 1.0 inch and 1.5 inch depths. Clearly, the 2.5 inch seeding depth was optimum at this moldboard-plowed clay loam site when planting in early May of 2013 or late May of 2014.  

Corn plant populations and grain yield had strong year x seeding depth interactions at Orleans Co. (Table 1), presumably because of very different weather conditions after planting. In 2013, an extended dry period occurred for a few days before planting and for 15 days after planting. This probably contributed to the quadratic plant population response to seeding depths (higher populations at the 2.0 and 2.5 inch depths compared to the shallower depths, which apparently dried out). Yield, however, showed a linear response to seeding depth with maximum yield occurring at the 2.5 inch depth in 2013. In 2014, a severe thunderstorm dropped almost 2 inches of rain immediately after the grower finished planting the study. The clay loam soil crusted significantly before and during corn emergence. Consequently, a negative linear response of plant populations to seeding depth was observed with low plant populations at the 2.0 and 2.5 inch seeding depths. Despite, the negative linear response of plant populations to seeding depths in 2014, yields did not differ among seeding depths. It is hard to determine what the optimum seeding depth should be when planting on this disk-tilled clay-loam soil in mid-May because disk-tilling contributed to drying and reduced emergence at the 1.0 and1.5 inch planting depths in 2013, and heavy rains resulted in severe crusting and reduced emergence at the 2.0 and 2.5 inch seeding depths in 2014.

Corn plant populations had significant year x seeding depth interactions but grain yield did not have a year x seeding depth interaction at the Seneca Co. site (Table 1). Heavy rains shortly after planting resulted in soil crusting on this silty clay soil in 2013, which resulted in a negative linear response of plant populations to seeding depths in 2013. Grain yields, however, showed a quadratic response to seeding depth with maximum yield observed between the 1.5 and 2.0 inch depth. In 2014, an extended dry period was observed at this location after the late planting, but plant populations showed a quadratic response to seeding depth with maximum populations at the 1.5 inch depth. Regression equations indicated that maximum yield occurred between the 1.5 and 2.0 inch seeding depth in 2014. The 1.0 and 1.5 inch seeding depths on this no-tilled silty clay site resulted in maximum plant populations, but regression equations indicated that the 1.5 inch to 2.0 inch seeding depth resulted in maximum yield when planting in early May of 2013 or early June of 2014.

CONCLUSION

Corn plant populations and grain yields had strong year x location x seeding depth interactions indicating that the “one size fits all” 2.0 inch seeding depth was not optimum across all years and sites. When torrential rains occurred shortly after planting, the 1.0 inch seeding depth had maximum plant populations on a no-till silty clay soil planted in early May of 2013, and on disk-tilled clay loam soil planted in mid-May of 2014. The 1.0 inch seeding depth, however, did not have maximum yield at these sites nor any sites in the study. Consequently, the 1.0 inch seeding depth is probably too shallow a planting depth for corn in almost all situations.

The 2.5 inch seeding depth had the lowest plant populations at the two sites mentioned above but had among the highest plant populations and the highest grain yields at the moldboard-plowed clay loam site in both years and at the disk-tilled clay loam site in 2013. Clearly, there is a place for the 2.5 inch seeding depth on some soils in some years.

The 1.5 inch and 2.0 inch seeding depths resulted in maximum grain yields on the no-tilled silty clay site planted in early May of 2013 or early June of 2014. At the chisel-tilled silt loam soil, however, the 1.5 inch seeding depth yielded higher than the 2.0 inch seeding depth when planted in mid-May of 2013 and early June of 2014. Consequently, the 2.0 inch seeding depth never solely resulted in the highest yield in any of our 8 site/year comparisons.

Although yield differences among seeding depths were usually small, increasing the seeding depth from 2.0 to 2.5 inches at the no-tilled silty clay site decreased yield an average ~6%. In contrast, a decrease in the seeding depth from the 2.5 inch to 2.0 inch seeding depth at the moldboard-plowed clay loam site decreased yield an average ~9%. The significant year x location x seeding depth interaction for grain yield indicates that corn growers in NY should adjust seeding depth to soil conditions (although it is difficult to predict ensuing soil conditions after planting, which can greatly influence the optimum seeding depth for plant populations and yields).

Stalk Nitrate Test Results for New York Corn Fields from 2007 through 2014

Quirine Ketterings1, Karl Czymmek1,2, Sanjay Gami1, and Mike Reuter3, Cornell University Nutrient Management Spear Program1, PRODAIRY2, and Dairy One3

Since the introduction of the corn stalk nitrate test (CSNT) as an end-of-season evaluation tool for nitrogen (N) management in 2nd or higher year corn fields, the number of fields that have been tested for CSNT has been on the increase. The greatest benefit of this test is that it allows evaluation and fine-tuning of N management for each specific field. It does, however, require multiple years of testing to gain experience with on-farm interpretation. Corn stalk nitrate test results >2000 ppm indicate there was significantly more N available during the growing season than the crop needed.

The summary of CSNT results for the past eight years is shown in Table 1. In the 2013 and 2014 growing season, the CSNT testing results from the Nutrient Management Spear Program and Dairy One were summarized to obtain a distribution of CSNT categories in New York State. Quality control samples shared between the two laboratories in both years showed excellent consistency in reported data between the two laboratories. Data prior to 2013 reflect submissions to Cornell University only. For 2014, this summary shows that about 36% of all tested fields were over the 2000 ppm range, while 27% were over 3000 ppm and 14% exceeded 5000 ppm. In contrast, 29% of the 2014 samples tested low in CSNT. For 2nd or higher year corn fields, low test results (less than 250 ppm) are likely to reflect a true N deficiency. Weed pressure, disease pressure, lack of moisture, lack of oxygen and other stress factors can impact the N status of the crop, so in some circumstances, additional N might not have been able to overcome the real reason for the low CSNTs (e.g. no amount of N fertilizer can make up for a drought).

Ketterings Table 1 v2
As mentioned, the CSNT is most effective when used for multiple years on the same fields to determine how each responds to the way N is being managed. Crop history, manure history, other N inputs, soil type, and growing conditions all impact CSNT results, and crop management records that include these pieces of information can be used to evaluate CSNT results and determine where changes can be made.

What’s Cropping Up? Vol. 24, No. 6 – November/December – Full Version

WCUVol24No6The full version of What’s Cropping Up? Volume 24, No. 6 is available as a downloadable PDF.  Individual articles are available below:

Glyphosate-Resistant Weeds Likely in NY

Russell R. Hahn, School of Integrative Plant Science, Soil and Crop Sciences Section, Cornell University

The number of herbicide resistant weed biotypes has increased from 404 to 437 in the past 12 months.  A summary of resistant biotypes for various herbicide site-of-action groups is shown in Table 1.  There have been 13 new cases of ALS (acetolactate synthase) inhibitor resistance (Group 2 herbicides) and 7 new cases of glyphosate (EPSP inhibitor) resistance (Group 9 herbicides) around the World during the past year.  Along with these newly documented cases of herbicide resistance, there continues to be much media attention to this problem, especially related to glyphosate-resistant (GR) weeds.

Table 1.  A summary of resistant weeds by site-of-action herbicide group as of December 1, 2014 is shown below with information from http://www.weedscience.org
Table 1. A summary of resistant weeds by site-of-action herbicide group as of December 1, 2014 is shown below with information from http://www.weedscience.org

WSSA Takes Action
In response to the growing concern about herbicide resistance, the Weed Science Society of America (WSSA) sponsored a national scientific summit on this topic September 10, 2014 in Washington D.C.  This summit built on the insights and perspectives developed at a similar event in 2012.  Dr. David Shaw, a past president of WSSA and Chair of the WSSA Herbicide Resistance Education Committee said “We want everyone to walk away with a clear understanding of specific actions they can take to help minimize the devastating impact of herbicide resistance on agricultural productivity”.  In Addition, WSSA issued a new fact sheet to address the media attention/hysteria about herbicide resistance on October 8, 2014.  The fact sheet discusses the truth behind two common misconceptions about “superweeds”.  According to WSSA, the first misconception is that “superweeds” are the product of rampant gene transfer from genetically modified crops creating herbicide resistant weeds.  The second misconception is that “superweeds” have supercharged abilities to muscle out competing plants in new and more aggressive ways”.  The WSSA fact sheet is posted online at http://wssa.net/weed/wssa-fact-sheets.

Glyphosate-Resistant Weeds
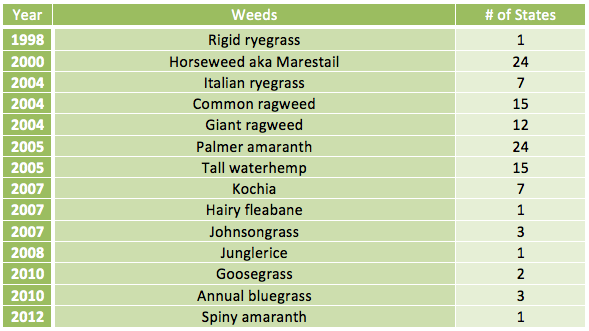
While ALS inhibitor-resistant weeds account for one-third of the documented cases, GR weeds get more attention because of the connection to the vast acreages of GR crops and because of the rapid spread of GR Palmer amaranth across the U.S.  A summary of GR weeds in the U.S. is shown in Table 2.

Table 2.  Documented cases of glyphosate resistance in the U.S. as of December 1, 2014.
Table 2. Documented cases of glyphosate resistance in the U.S. as of December 1, 2014.

Although there are no documented cases of GR weeds in NY, it’s likely that there are isolated GR weed populations in the state.  Several years ago, there was a situation in western NY where a grower noticed giant ragweed that had not been controlled with a normal glyphosate application in soybeans on newly purchased land.  The previous landowner had purchased a combine from Ohio where there have been documented cases of GR giant ragweed.  Seed from the surviving giant ragweed were grown in the greenhouse and treated at 3 or 6 inches in height with from 22 to 88 fl oz/A of Roundup PowerMax. Some of the 3- and 6-inch giant ragweed survived up to 88 fl oz/A of Roundup PowerMax. There are also reports of horseweed (marestail) that is not controlled with normal glyphosate applications, usually in zone/no-tillage fields.  See the accompanying photo of a no-tillage soybean field that shows surviving horseweed plants following burndown and postemergence applications of glyphosate.

Figure 1. Horseweed that survived burndown and postemergence applications of glyphosate in no-tillage soybeans.

Several Midwest states believe that GR Palmer amaranth was introduced on contaminated cotton seed imported for dairy rations.  This was cause for alarm last summer when an astute crop advisor noticed an unfamiliar pigweed that was not controlled with a normal glyphosate application in Wayne County.  According to Anna Stalter, Associate Curator and Extension Botanist of the L. H. Bailey Hortorium Herbarium, Palmer amaranth (Amaranthus palmeri) is not native in NY.  However, there are two Palmer amaranth specimens from NY in the herbarium collection.  One was from Corona on Long Island in 1936 and the other from Albany in 1949.  It is believed that the strange pigweed was tall waterhemp (Amaranthus tuberculatus).  Stalter says that tall waterhemp is considered native throughout NY, having spread from the Midwest.  There are 17 specimens of tall waterhemp from NY in the herbarium collection dating from 1891 near Fort Ann in Washington County to 2005 near DeKalb in St Lawrence County.  None are from west of Cayuga and Tompkins.  Ten of the Wayne County tall waterhemp plants were sprayed with a normal rate of glyphosate when they were 12 inches tall and actively growing.  Nine of these plants died, but one survived, making one believe there may be GR tall waterhemp plants in this population.

Herbicide Resistance Management
Effective herbicide resistance management, to avoid or control herbicide resistant weed populations, involves engagement of all involved in weed management decisions.  Primary responsibility falls on the grower or crop consultant who must scout fields to determine if weed control practices are working and to identify and determine the reason(s) for weed escapes.  Key elements of an effective grower/crop consultant weed management plan includes some, or all of the following practices;

1) Crop rotation and the use of hybrids/varieties with different genetic traits for herbicide resistance.
2) Cultivation of row crops to control escaped weeds.
3) Rotate or use herbicides with different sites-of-action over the course of the crop rotation.
4) Use tank mixes/premixes or sequential herbicide applications with different sites-of-action.
5) Scout fields to identify weeds that survive herbicide application and then determine why.

Chemical and seed companies, which are often one and the same, provide information and products that reinforce management practices for those who are on the front lines in this battle.  Among these are: 1) including site-of-action group numbers on all herbicide containers, 2) developing and marketing premixes of herbicides with different sites-of-action, and 3) developing and marketing crops with multiple types of herbicide resistance/tolerance.  It is this last item that is receiving much attention in this battle against herbicide resistant weeds.  There are examples of crops with multiple types of herbicide resistance in the marketplace. Most everyone is familiar with SmartStax corn hybrids with resistance to glyphosate (Roundup etc.) and glufosinate (Liberty 280 SL) as well genetic traits for resistance to insects.  In addition, there are recently deregulated herbicide resistant crops with new combinations of herbicide resistance/tolerance traits and others under development.

Does Soybean Planting Depth And Planting Date Matter That Much In New York?

Bill Cox, School of Integrative Plant Science, Soil and Crop Sciences Section and Phil Atkins, New York Seed Improvement Program, Cornell University

It is generally recognized that the optimum soybean planting date range in NY is from ~May 10-May 25 and the optimum seeding depth is ~1.5 inches on most planting dates. Some growers, however, have had success by planting soybeans in late April, before planting the corn crop. In addition, a late April or early May soybean planting date greatly improves the probability of timely wheat planting, if soybean growers are in a corn-soybean-wheat rotation. We conducted small-plot research at the Aurora Research Farm in 2013 and 2014 to answer three questions concerning soybean planting: 1) Can soybean be safely planted in late April in the Finger Lakes region and western NY (regions where there is typically no frost after May 15) without a yield penalty, 2) does the 1.5-inch seeding depth fit all planting dates, and 3) should a Group II or Group I variety be selected, if the planting date is delayed until mid-June.

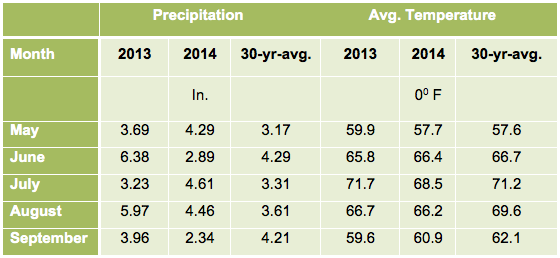
We planted a mid-Group II (AG2431) and a late Group I (AG1832) variety on April 19, May 6, May 17, June 1 and June 15 in 2013 and on April 21, May 7, May 20, May 29, and June 11 in 2014 at 1.0, 1.5, 2.0, and 2.5 inch seeding depths at the Aurora Research Farm in Cayuga County. Soybeans were planted in 15-inch rows with a White row crop planter at ~170,000 seeds/acre. We evaluated early plant establishment at ~1st -2nd trifoliate stage (~V2-V3) about 10 to 35 days after planting, depending upon planting date. Each planting date x variety x seeding depth plot was harvested when moistures were less than 16% (September 27, October 3, and October 15 in 2013; and September 29 and October 13 in 2014.). Growing conditions were mostly similar across years, with 2013 somewhat warmer and wetter, but drought stress did not occur in either year (Table 1).

Table 1.  Monthly precipitation and average monthly temperatures at the Aurora Research Farm in Cayuga Co., NY during the 2013 and 2014 growing seasons.
Table 1. Monthly precipitation and average monthly temperatures at the Aurora Research Farm in Cayuga Co., NY during the 2013 and 2014 growing seasons.

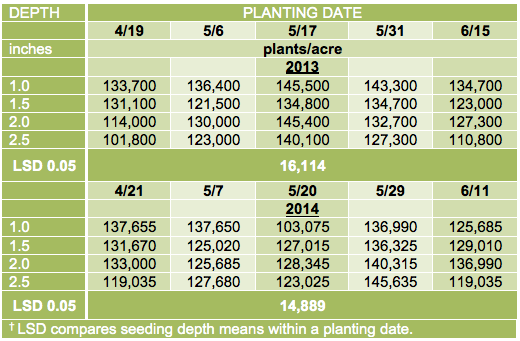
Early plant populations had a significant year x planting date x seeding depth interaction (P=0.09), indicating that the optimum seeding depth varied across planting dates within years (Table 2). In 2013, the 1-inch seeding depth consistently had the highest early plant populations at ~135,000-145,000 plants/acre (~80-85% early plant establishment) for all planting dates. In 2014, however, the 1.0 inch seeding depth had early plant populations of only ~103,000 plants/acre on the May 20 planting date (~60% establishment) because of an extended dry period after this planting date. Likewise, the 2.5 inch seeding depth at the late April planting date had the lowest early plant populations in 2013 (~102,000 plants/acre or ~60% establishment) and in 2014 (~119,000 plants/acre or ~75% establishment), associated with the cool conditions after planting, but mostly similar early plant populations on all May planting dates. The 2.5 inch depth also had the lowest early plant populations on the June planting dates (~111,000 plants/acre or ~65% establishment in 2013 and  ~119,000 plants/acre or ~70% establishment in 2014) probably because heavy rains after planting resulted in significant soil crusting before emergence on those dates.

Table 2. Plant populations of soybean at ~the 1st trifoliate leaf stage (~V2)) at five planting dates and four seeding depths, when averaged across two varieties (AG1832 and AG2431), in the 2013 and 2014 growing seasons.

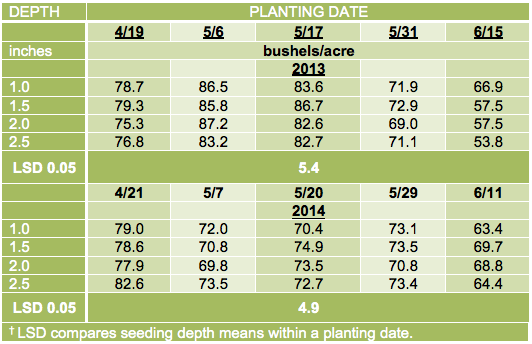
Seed yield did have a year x planting date x seeding depth interaction, but mostly because of the mid-June planting dates (Table 3). Seed yields did not vary with planting depth across the first four planting dates in either year, despite early plant populations of only 101,800 plants/acre at the 2.5 inch seeding depth on the April 19 planting date in 2013 and of only 103,075 plants/acre at the 1.0 inch seeding depth on May 20 in 2014. Seed yields, however, were lower on the June planting dates at the 2.5 inch depth in 2013 and 2014 (~20% in 2013 and ~8% in 2014) and at the 1.0 inch depth in 2014 (9% less), probably associated with low early plant populations.

Table 3. Seed yield of soybean at five planting dates and four seeding depths, when averaged across two varieties (AG1832 and AG2431) in the 2013 and 2014 growing seasons.

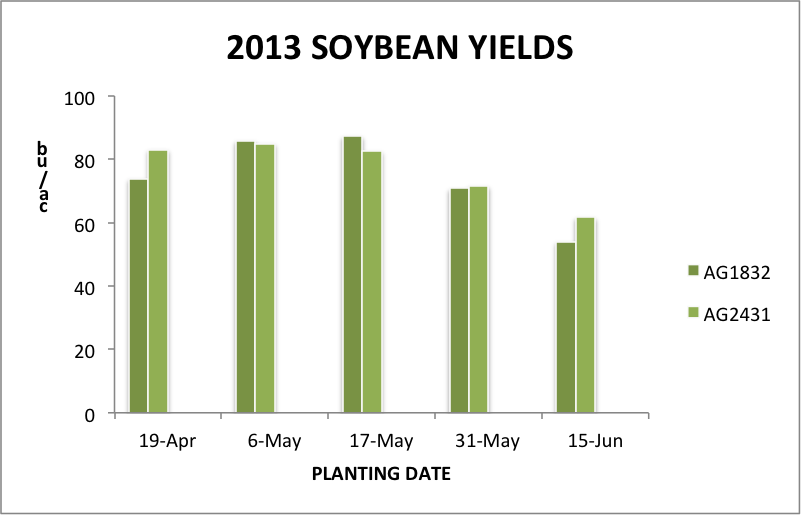
Seed yield also had a year x planting date x variety interaction (Fig. 1 and Fig.2). The Group II variety yielded the highest at the April planting date and June planting date in both years. The Group I and Group II varieties yielded the same on all three May planting dates. Yield showed a quadratic response to planting date in 2013 with lower yields at the April planting date, maximum yield observed between the May 6 and May 17 planting dates, and the lowest yield for the June 15 planting date (Table 3 and Fig.1). In 2014, yield showed a negative linear response to planting date with maximum yield observed at the April planting date, similar yields among the May planting dates, and the lowest yield for the June 11 planting date (Table 3 and Fig.2). Soybean yields planted in late April compared to mid- June averaged ~30% higher in 2013 and ~20% higher in 2014.

Fig. 1 Yield of a Group I (AG1832) and a Group II (AG2431) soybean variety, averaged across four seeding depths, at five planting dates in 2013.
Fig. 2 Yield of a Group I (AG1832) and a Group II (AG2431) soybean variety, averaged across four seeding depths, at five planting dates in 2014.

Conclusion

When averaged across years, varieties and planting dates, a negative linear relationship existed between early plant populations and seeding depth, indicating that the 1.0 inch seeding depth had the highest overall early plant populations (~133,000 plants/acre compared with ~123,750 plants/acre at the 2.5 inch depth). Nevertheless, the year x planting date x seeding depth interaction, in part because the 1.0 inch seeding depth had the lowest early plant populations compared to all seeding depths on the May 20 planting date in 2014, indicates that the 1.0 inch depth may result in poor early stand establishment when an extended dry period follows planting. Likewise, lower early plant populations at the 2.5 inch depth on the April and June planting dates, but similar early plant populations on the May planting dates, indicates that 2.5 inch depth is too deep under cool conditions, or if soil crusting occurs after planting before emergence. Consequently, the 1.5 to 2.0 inch depth range appears to be the optimum for early plant establishment for most planting dates.

Plant populations, however, do not correlate with yield in most situations, unless final stands are less than ~114,000 plants /acre under NY growing conditions (Cox and Atkins, What’s Cropping Up, Vol.21, No.2, p. 5-6). Consequently, the relationship between yield and seeding depth was neither linear nor quadratic when averaged across years, varieties, and planting dates. Soybeans have a tremendous ability to compensate or fill in when early plant populations are low, which is reflected in similar yields among seeding depths, despite low plant populations at the 2.5 inch depth for the April planting dates in both years and for the 1.0 inch depth for the mid-May planting date in 2014.. Soybeans, however, did not compensate for the low plant populations at the June planting dates, as evidenced by lower yield at the 2.5 inch depth in 2013 (~20% less than the highest yield on that date) and at the 1.0 inch and 2.5 inch seeding depths in 2014 (8-9% lower than the highest yield on that date). Perhaps, soybeans have less time to compensate for lower plant populations if planted in mid-June in NY.

When averaged across years, varieties, and seeding depths, yield showed a quadratic yield response to planting date with maximum yields occurring at the late April and early May planting dates. The year x variety by planting date interaction for yield indicated that a Group I or Group II variety planted in early or mid-May yielded highest in 2013 but a Group II variety planted in late April yielded highest in 2014. Yields decreased for both varieties at the late May planting date in 2013 but yields were the same across all May planting dates for both varieties in 2014. Yield of the Group II vs. Group I variety was higher for the June planting date in both years. The yield data indicate that a Group II variety planted sometime between April 25 and May 10 appears to be the optimum range compared to the general belief of the May 10 to May 25 range. Growers who have a corn-soybean-wheat rotation in some fields may wish to consider planting a Group II variety ahead of corn or simultaneously with corn in late April or early May in those fields, especially if timely planting of wheat is a concern. The 20-to 30% higher yields for late-April compared to mid-June planted soybeans may prompt growers who do not have wheat in their rotation to consider planting soybeans in late April or early May, simultaneous with corn planting. Keep in mind that this study was conducted on a well-drained soil in a region of the state where spring frosts do not typically occur after May 15. Late April-planted soybeans are not recommended for poorly drained soils or on farms where frost can occur after May 15.