S. Sunoja, Quirine M. Ketteringsa, Joe Lawrenceb, and Greg Godwina
a Nutrient Management Spear Program, Department of Animal Science, Cornell University, Ithaca, NY 14853, b PRODAIRY, Department of Animal Science, Cornell University, Ithaca, NY 14853
Introduction
Most land-grant university corn nitrogen (N) guidelines recommend the use of a small quantity of starter at planting followed by sidedressing when corn is at V6, when N requirements exceed appropriate starter rates. This approach aims to supply a small amount of N for the first weeks of growth after emergence when the plants need only a small amount of N, followed by application of a larger amount of readily available N at V6, prior to the start of the rapid growth curve of a corn plant. However, sometimes getting into the field in time for sidedressing at V6 can be challenge. Farmers and crop advisors have asked what to expect when sidedressing is delayed beyond V6. If equipment is available to apply N to already tall corn plants, would it still benefit the crop? The past four years, we conducted trials to determine what happens with corn yield and N use efficiency when sidedressing is delayed beyond V6.
Timing of N sidedress application and yield data
A sidedress experiment was conducted at the Musgrave Research Farm in Aurora, NY from 2017 through 2020. The soil type is classified as Lima silt loam with a pH of 7.8. Corn was planted on May 20 (2017), May 14 (2018), May 27 (2019), and May 21 (2020) at a rate of 31,000 to 35,000 seeds per acre. The seed varieties were Pioneer P0157 in 2017 and 2018, P9188AMXT in 2019, and P8989AM in 2020. Each year, starter N was applied at a rate of 30 lbs N per acre. The six treatments included zero N (NoN), N rich (NRich; 300 lbs N/acre at planting), and sidedress applications (180 lbs N per acre applied) at V4, V6, V8, and V10. Corn was harvest for grain each year.
Results
Effect of timing of N sidedress application on yield
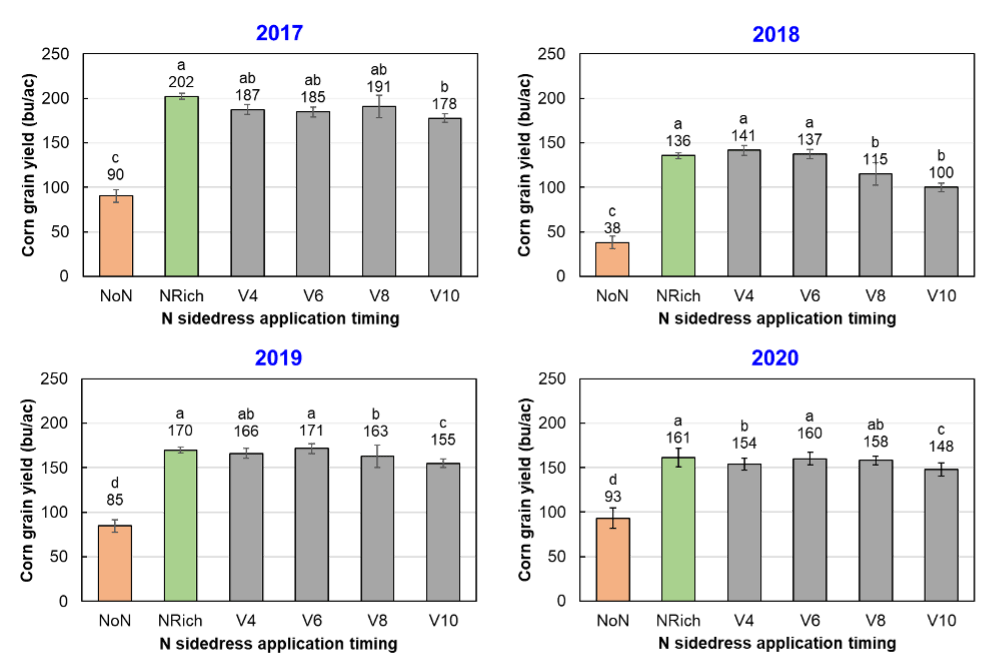
The NRich treatments yielded 202, 136, 170 and 161 bu per acre in 2017, 2018, 2019, and 2020, respectively, averaging 168 bu per acre across the four years. The large year to year differences reflected, among others, weather patterns; 2017 and 2019 received 10.4 and 9.9 inches of rainfall in May-June, while in 2018 and 2020 rainfall amounted to 6.0 and 5.5 inches, respectively.
Independent of the year of the experiment, the NoN treatment consistently produced the lowest yield. On average, across years, the NoN treatment averaged 45% of the yield obtained in the NRich treatments (Fig. 1). Not sidedressing reduced yield by, on average, 90 bu per acre, clearly indicating the need for additional N for this location.
Sidedressing at 180 lbs of N per acre at V4 and V6 resulted in yields that averaged 97% of the yield of the NRich treatment (Fig 1). Delaying sidedressing to V8 and V10 significantly reduced the yield (Fig. 1) to 95% (V8) and 87% (V10) of the yield that was obtained with the Nrich treatment and 96% (V8) and 89% (V10) of what was obtained with N application at V6. In general, yield declined the longer sidedressing was delayed beyond V6.
Figure 1. Corn grain yield as impacted by timing of sidedressing (NoN = starter only; Nrich = 300 lbs N per acre at planting; V4, V6, V8, and V10 = sidedressing of 180 lbs N per acre at the designated growth stage). The trials were conducted on continuous corn fields without a recent manure history at the Musgrave Research Farm in Aurora, NY). The values above each bar indicate the mean yield. Yield are not statistically different if followed by the same letter (a, b, etc.).
Nitrogen Uptake Efficiency
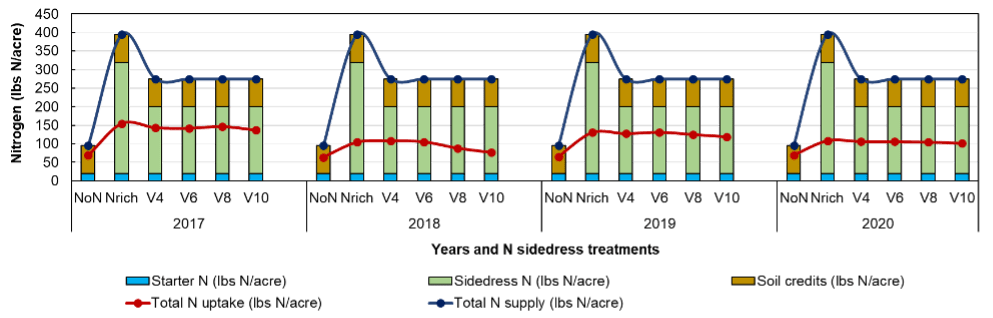
Sidedressing at 60% of the NRich rate can lead to the question: “Could yields have been higher for the sidedress treatments if more N had been applied?” The lack of a yield hit with early sidedress application compared to the Nrich treatment suggests the answer is no but we can also look at N balances for each of the treatments to investigate this. The ratio of N uptake to N supply (fertilizer N and soil N) shows that the crop took up about 70% of N supply when no N was applied beyond the starter (NoN treatment) and 44, 44, 42, and 39% for sidedressing at V4, V6, V8, and V10, respectively. The lowest uptake efficiency was for the NRich treatment (only 31%), signaling that (1) there was a considerably over-application of N in the NRich treatments each year, and (2) it was very unlikely that N supply limited yield at the various sidedress rates.
Figure 2. Nitrogen supply and uptake as impacted by timing of sidedressing (NoN = starter only; Nrich = 300 lbs N per acre at planting; V4, V6, V8, and V10 = sidedressing of 180 lbs N per acre at the designated growth stage). The trials were conducted on continuous corn fields without a recent manure history at the Musgrave Research Farm in Aurora, NY).
Conclusions and Implications
Sidedressing at V4 and V6 growth stages produced the same yield as obtained in the NRich treatment. Delaying the sidedress application to V8 and V10 resulted in reduced yield compared to what was obtained with sidedressing the same amount of N at V4 and V6. However, yields with sidedressing at V8 and V10 still produced significantly higher yields than obtained in the NoN treatment. The N balance evaluations showed that N use efficiency declined with sidedressing beyond V6, primarily due to the yield hit taken when sidedressing was delayed (and sidedress N was needed in the first place). Based on these results, we conclude that if additional N beyond a small starter is needed for optimal yield, it is recommended to sidedress earlier rather than later in the season.
Acknowledgements
This research was funded with federal formula funds. We thank the Paul Stachowski, farm manager of the Musgrave Research Farm at Aurora, NY, for help with field management. We also thank the many NMSP team members for help with harvest and sample processing over the years. For questions about these results, contact Quirine M. Ketterings at 607-255-3061 or qmk2@cornell.edu, and/or visit the Cornell Nutrient Management Spear Program website at: http://nmsp.cals.cornell.edu/.
Deborah Aller1, Kaitlin Shahinian2, Joseph Amsili3, Harold van Es3 1Cornell Cooperative Extension of Suffolk County, 2Suffolk County Soil and Water Conservation District, 3Soil and Crop Sciences Section, Cornell University
Interest in soil health concepts, practices, and testing has grown rapidly across the United States as farmers, researchers, and the general public increasingly recognize the central role of soils in food production, water quality, environmental sustainability, and climate adaptation and mitigation. Further, it is well known that land managers have a tremendous capacity to either degrade or improve the health of the soil through their management decisions.
Acknowledging the importance of healthy soil for the long-term productivity and sustainability of agriculture on Long Island specifically, the CCE Agricultural Stewardship Program partnered with the Suffolk County-Soil and Water Conservation District to offer soil health testing free of charge to all farmers in the County. This program began in spring 2018 and in just three years over 60 farms have participated, and more than 200 soil samples have been collected. In 2020, the New York Soil Health Initiative (https://newyorksoilhealth.org/) published a report (https://newyorksoilhealth.org/soil-health-characterization/) characterizing soil health across New York State (NYS), which quantified the effects of different cropping systems on soil health. We additionally characterized soil health at a smaller regional scale within the state so that farmers can compare their soil health to similar production environments nearby.
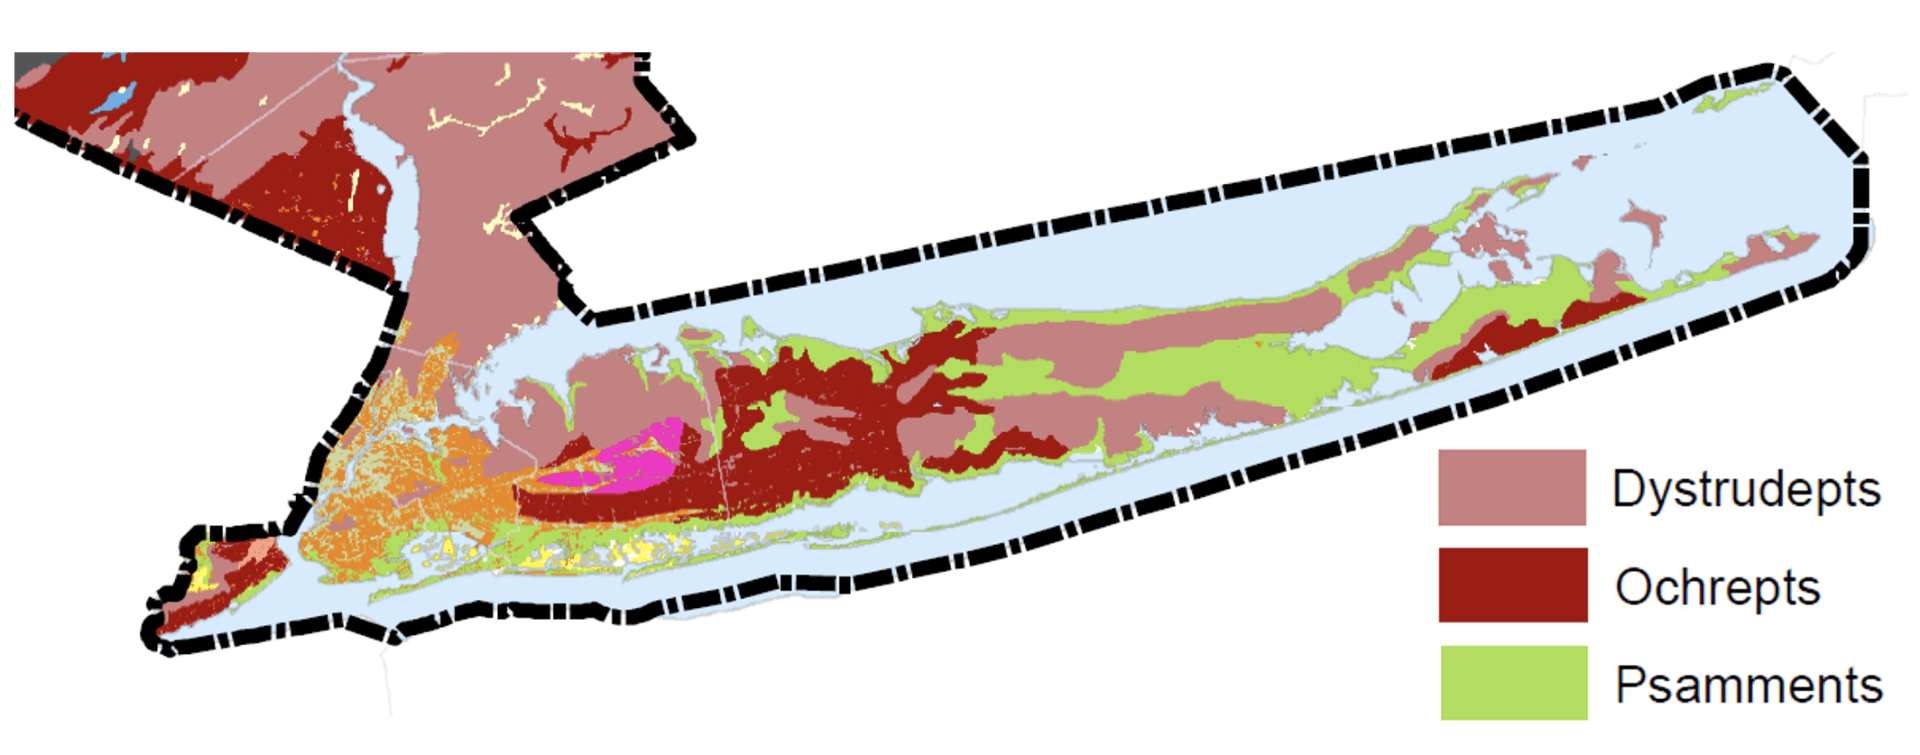
We have summarized results from 231 soil samples collected from across Suffolk County that encompass a variety of soil types and cropping systems. The samples were approximately evenly split among sandy loam, loam, and silt loam texture classes. The County has a higher proportion of coarse-textured soils (higher percentage of sand) than much of the rest of the state. These coarser soils are indicated by the Psamment soil suborder (Figure 1). All soil samples were analyzed using the Standard Comprehensive Assessment of Soil Health (CASH) package at the Cornell Soil Health Laboratory.
Figure 1. Map of soil suborders in Suffolk County.
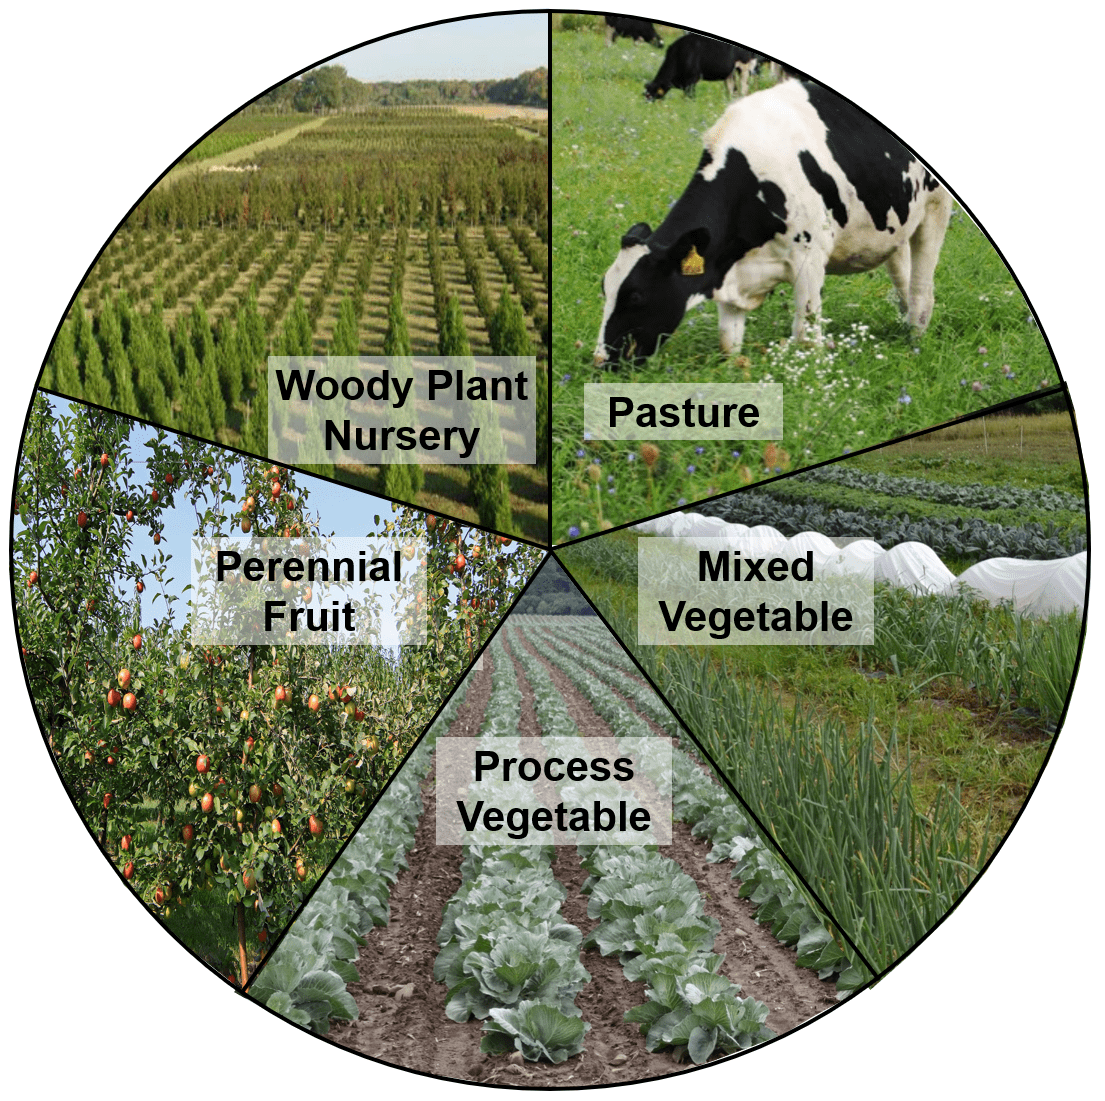
Suffolk County hosts a great diversity of agriculture and remains the top producer of nursery crops, certain vegetable crops (pumpkins and tomatoes), and perennial fruits (grapes and peaches). There are also many small-scale diversified vegetable farms that largely grow fresh market vegetables and several pastured livestock operations. Additionally, the high value of land and the maritime climate creates much different conditions for agricultural production than the rest of NYS. Five cropping system categories were constructed by grouping similar crops (Figure 2). The Processing Vegetable category grouped fields where winter squash, potatoes, pumpkins, and tomatoes were grown. The Mixed Vegetable category grouped fields where several different vegetable crops were grown in the same field in a single season and sold as fresh market produce (and also tend to be smaller farms than with processing vegetables). The Perennial Fruit category grouped all small fruit (blueberries and brambles), tree fruit orchards (apples, peaches, cherries, etc.), and vineyards. Woody Plant Nurseries included all operations producing field-grown ornamental horticulture crops (oak trees, California privet, boxwood, holly, etc.), and Pastures included the livestock operations with perennial forage crops.
Figure 2. Cropping systems analyzed in Suffolk County.
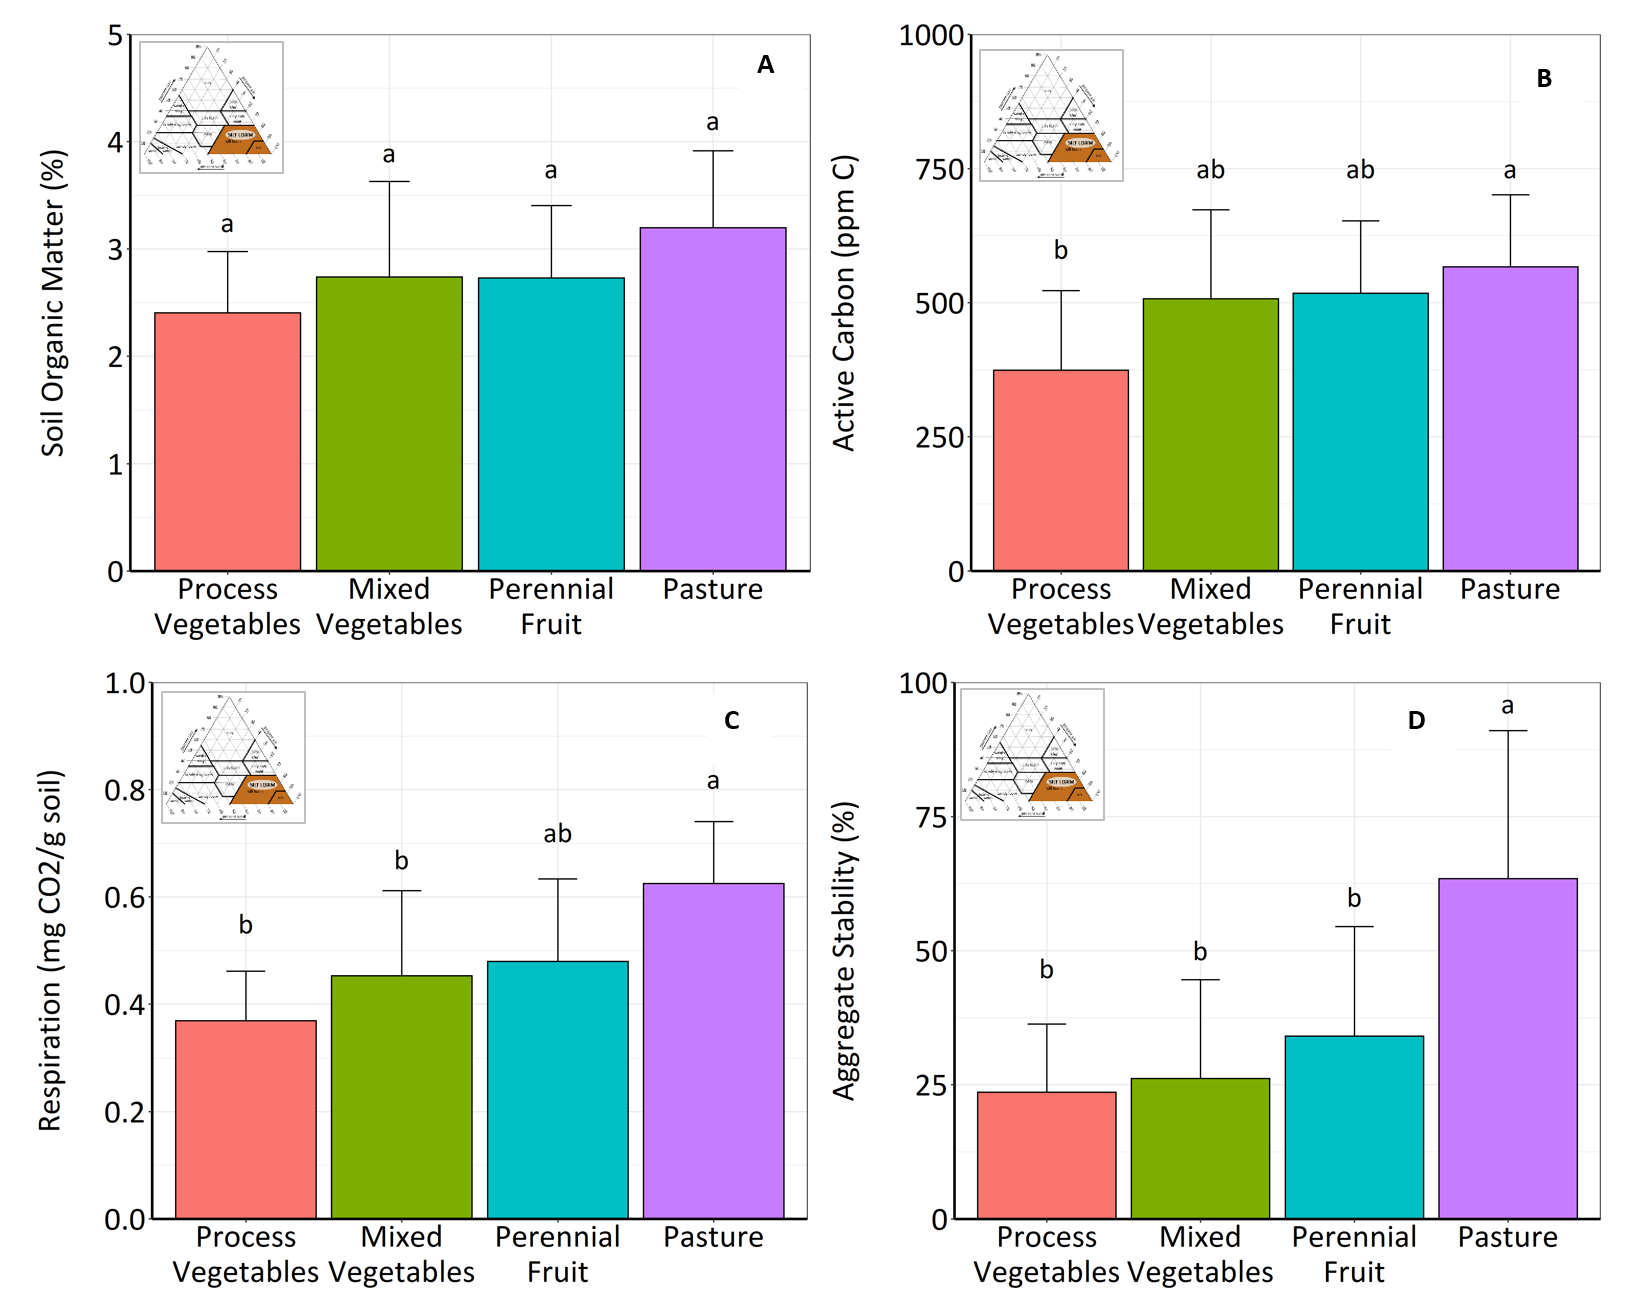
The initial analysis focused on differences among cropping systems on silt loam soils, although it reinforced the concepts that soil texture and cropping system are dominant factors contributing to the overall soil health on farms (Figure 3).
Figure 3. Mean soil organic matter (A), active carbon (B), respiration (C), and aggregate stability (D) across cropping systems on silt loam textured soils.
For silt loams, the soil health indicators of active carbon, respiration, and aggregate stability showed differences across cropping system, whereas soil organic matter (OM) did not. This indicates that some of these more labile OM indicators (more directly related to biological activity in the soil) can better and earlier detect changes in soil health than the total soil OM level which generally changes slowly over time. Pastures had greater active carbon levels than Processing Vegetable systems. Respiration and aggregate stability were slightly more sensitive to cropping system than active carbon. Pastures had higher soil respiration than both Processing Vegetable and Mixed Vegetable systems. Furthermore, Pastures had more than twice the aggregate stability compared to all other systems, which highlights the importance of living roots year-round to build and stabilize soil aggregates (Figure 3).
Overall, different agricultural management practices associated with various cropping systems had a big impact on soil health status. They often reflect important differences in total carbon and nutrient balances and degrees of disturbance from tillage. Pasture and Perennial Fruit maintained the best overall soil health because these systems are largely undisturbed and have perennial vegetation (Figure 3). Pasture systems receive continuous root and shoot inputs year-round and some Perennial Fruit systems may receive woodchip mulch. This permanent cover further protects the soil from losses due to wind and water erosion. The Mixed Vegetable farms typically have diverse rotations, practice cover cropping, and utilize various soil amendments such as compost to supplement fertility and build OM. In contrast, Processing Vegetable systems are more intensively managed, and although they often practice cover cropping, typically don’t receive sufficient organic inputs to replace the OM that is lost annually from tillage and other management activities. Typically, 40-80% of the carbon and nutrients in the aboveground biomass are exported off the farm in the form of crop harvests, which needs be counterbalanced with soil management practices like cover cropping and organic amendment application to maintain and build soil health.
Stay tuned for the complete report that characterizes soil health across Suffolk County, which will examine the effects of soil texture, soil taxonomic unit, and cropping system on the suite of biological, physical, and chemical soil parameters included in the CASH test. Refer to the full Characterization of Soil Health in New York State (https://newyorksoilhealth.org/soil-health-characterization/) report as an example of what will be produced for Suffolk County.
References and further reading:
Amsili, J.P., H.M. van Es, R.R. Schindelbeck, K.S.M. Kurtz, D.W. Wolfe, and G. Barshad. 2020. Characterization of Soil Health in New York State: Technical Report. New York Soil Health Initiative. Cornell University, Ithaca, NY
Magdoff, F.R. and H.M. van Es. 2009. Building Soils for Better Crops: Sustainable Soil Management. Sustainable Agriculture Research and Extension, College Park, MD. (The fourth edition will be out in 2021).
Moebius-Clune, B.N., D.J. Moebius-Clune, B.K. Gugino, O.J. Idowu, R.R. Schindelbeck, A.J. Ristow, H.M. van Es, J.E. Thies, H.A. Shayler, M.B. McBride, K.S.M Kurtz, D.W. Wolfe, and G.S. Abawi, 2016. Comprehensive Assessment of Soil Health – The Cornell Framework. Ed. 3.2. Cornell University, Geneva, NY
Forage quality is important, it is hard to attend a meeting or read an agricultural publication without hearing this point and while there is a risk of becoming numb to the message, this spring presents yet another reminder of how critical this can be to controlling production cost on a dairy.
In a recent article (Higher Grain Prices and Lower Starch Diets) Rick Grant revisited the results of a past study at Miner Institute comparing diets with varying forage and fiber byproduct levels, the article can be found in the March 2021 Farm Report. Dr. Grant concluded the article by stating “This study showed us that we can feed higher forage diets when the forage contains highly digestible NDF. As we enter a period of higher grain and feed prices, we need to re-focus on the fact that cows can do very well on higher forage diets if the forage quality is high. And if fibrous byproducts happen to be priced competitively, we should be prepared to take advantage of their high fiber degradability.”
While striving for forage quality should always be the goal, the current price dynamics do offer an added incentive to optimize forage quality and specifically fiber digestibility entering 2021.
Hay Crops
Key factors in hay field management remain constant. As always it really boils down to optimizing yield and quality while securing the needed quantity of forage for different groups of animals on the farm. As each season presents ample chances to make low quality hay, the emphasis should be put on securing needed inventories of lactating quality feed before shifting the focus to obtaining lower quality inventory. Dynamic Harvest Schedules discusses ways to adjust management to achieve these goals.
The next step to assuring access to the right quality forage, at the right time, for the right group of animals is planning out forage storage as discussed in Strategic Forage Storage Planning.
Alfalfa and grass, or a mixture, are still the most common sources of hay crop on dairy farms and both have the potential to offer a very highly digestible feed source but understanding their differences is important to successful management.
There remains a tendency to focus in on Crude Protein (CP) when evaluating hay quality and while CP should not be completely ignored, there are better metrics for analysis. Fiber digestibility is a key area of focus and is certainly relevant in the context of higher commodity prices.
In a recent Hoards Dairyman article Dr. Dave Combs wrote, “Good forage is the combination of the right amount of fiber at the right amount of digestibility.” This is relevant to the grass and alfalfa discussion and research from Dr. Jerry Cherney at Cornell helps explain this.
In a study comparing the first cutting growth of grass and alfalfa in New York (NY), the Neutral Detergent Fiber (NDF) level of grass was found to be approximately 20 percent higher than alfalfa. However, when the NDF digestibility (NDFd) (on a percent of NDF basis) was measured, the grass NDFd levels averaged approximately 20 percent higher than alfalfa. In other words, grass has more total NDF but it is also more digestible. If this is understood it can be accounted for in proper ration development.
What the two crops did have in common was the rate of increase in NDF and corresponding rate of decline in NDFd as the crop matured. The levels of both were relatively constant until around May 10th (Ithaca, NY) at which time NDF levels began a linear increase while NDFd began a linear decrease. Between May 10th and May 30th NDF increased by 20 to 25 percent while NDFd declined by 15 to 20 percent for both crops.
An article from the University of Wisconsin, Understanding NDF Digestibility of Forages, provides a good comparison of the NDFd potential of Alfalfa, Grass and Corn Silage. Relative to the other two, grass has the highest potential, however, it can also measure the lowest levels if mis-managed, a higher risk, higher potential reward scenario. In contrast, alfalfa has the lowest potential of the three at the high-end but does not drop as low as grass on the low-end. Carrying this idea into mixed stands, Dr. Cherney has found that as little as 5% grass in a mixture can result in increases in NDFd that are meaningful to the cow and stands with approximately 30% grass optimize yield and quality.
The Cornell study exploring the springtime changes in fiber referenced above also helps shed light on why using CP as a quality indicator can be misleading with these crops. Crude Protein was tracked in the alfalfa and grass throughout the month and CP in both crops declined at a similar rate from May 10th to May 18th, from a starting point of 23 percent CP down to approximately 18 percent. At this point the lines diverged with the alfalfa CP value flattening out at approximately 18 percent and staying at this level through the end of May. In contrast, the CP content of grass continued a linear decline at a rate of 0.45 percent per day which resulted in a final measurement of approximately 14 percent at the end of May.
If comparing CP alone, the late cut alfalfa (at 18 percent CP) would be considered superior to the late cut grass (at 14 percent CP); however, from a fiber standpoint they would both be problematic by this time. Understanding this relationship and adjusting harvest decisions accordingly can be especially impactful when trying to maximize forage utilization in the diet during times of high commodity prices.
Optimizing the harvest timing of first cutting can be managed by understand the stand composition (alfalfa vs. grass) and progress of the crop. This differs by year as spring conditions can vary significantly. More information can be found in the following article, Time To Check The Progress Of Your First Cutting. Several CCE Ag Teams around NY offer first cutting monitoring programs and send out weekly updates during the month of May, contact your local CCE Ag Team for more information.
Corn Silage
The 2020 growing season can be generalized by below average rainfall which challenged the corn crop in many areas; however, one benefit realized was the positive impact the drier weather had of corn silage fiber digestibility. When considering a number of potential influences on corn silage fiber, aside from unique traits like BMR, we know that rainfall tend to have one of the most significant impacts on digestibility. More information can be found in Corn silage forage quality: Hybrid genetics versus growing conditions.
With 2021 growing conditions still an unknown, it is difficult to know what the 2021 crop has in store for fiber digestibility or overall yield and quality performance. Although it is difficult to predict the growing season, our understanding of fiber digestibility can help us plan ahead and manage for the best outcomes when feeding the 2021 crop.
As discussed, in general higher levels of rainfall leads to lower levels of digestible fiber with perhaps the largest impact related to rainfall just before corn tasseling. With this information, by August we should have a relatively good idea as to whether fiber digestibility is going to trend higher (like 2020) or lower (like 2017) as demonstrated in the data from the NY VT Corn Silage Hybrid Evaluation Program annual overview.
This could help planning in two ways. First, it may influence harvest decisions, specifically chop height. Penn State summarized a number of chopping height studies and found that on-average NDFd increases by 2.5 percent for each six inches the cutting height is increased. In a situation where the 2021 growing season results in a high yielding crop but there are concerns of below average fiber digestibility, increasing corn silage cutting height may be a worthwhile consideration. Conversely, if 2021 is similar to 2020, with limited rainfall, securing adequate forage inventory may be of more concern. Understanding that this will likely be offset by higher overall digestibility in the crop suggest a lower harvest height could be worth considering.
Second, having some level of confidence in whether fiber digestibility will be above or below average prior to harvest will provide a glimpse into what diet adjustments may be needed when switching to the new corn silage crop.
An inherent challenge of a dry year is that while digestibility is often higher, overall yield is often lower. This creates a scenario where cows are likely to consume more of the forage, particularly if striving for a high forage diet to combat high commodity prices, while inventories may be stressed. Planning ahead and using this information may aid in decision making regarding how many acres on the farm are harvested for silage versus grain or if purchasing additional corn silage (standing in the field or post-harvest) is warranted.
Although this article has focused on high forage diets to combat higher commodity cost, this information can also help in planning for what commodities may be needed in the new diet. Regardless of price trends this opens the door to watch markets for relative deals on these inputs throughout the late summer and early fall to lock in favorable prices for the period this silage will need to be fed.
References
Considerations in Managing Cutting Height of Corn Silage, Penn State
Corn silage forage quality: Hybrid genetics versus growing conditions, Cornell University
Dynamic Harvest Schedules, Cornell PRO-DAIRY
Higher Grain Prices and Lower Starch Diets, Miner Institute Farm Report, March 2021
NY VT Corn Silage Hybrid Evaluation Program annual overview, Cornell University
Bryan Brown, NYS IPM Program
Venancio Fernandez, Bayer Crop Sciences
Mike Hunter, Cornell Cooperative Extension
Jeff Miller, Oneida County Cooperative Extension
Mike Stanyard, Cornell Cooperative Extension
Cooperators
Derek Conway, Conway Farms
Jaime Cummings, formerly NYS IPM Program
Quentin Good, Quentin Good Farms
Antonio DiTommaso, Cornell University
Michael Durant, Lewis County Soil and Water Conservation District
Scott Morris, Cornell University
Ali Nafchi, Cornell Cooperative Extension
Ryan Parker, NYS IPM Program
Jodi Putman, Cornell Cooperative Extension
Joshua Putman, Cornell Cooperative Extension
Matthew Ryan, Cornell University
Lynn Sosnoskie, Cornell University
Ken Wise, NYS IPM Program
Funding Sources
New York Farm Viability Institute
Project Location
Trial locations in Seneca County but results are likely applicable statewide.
Abstract
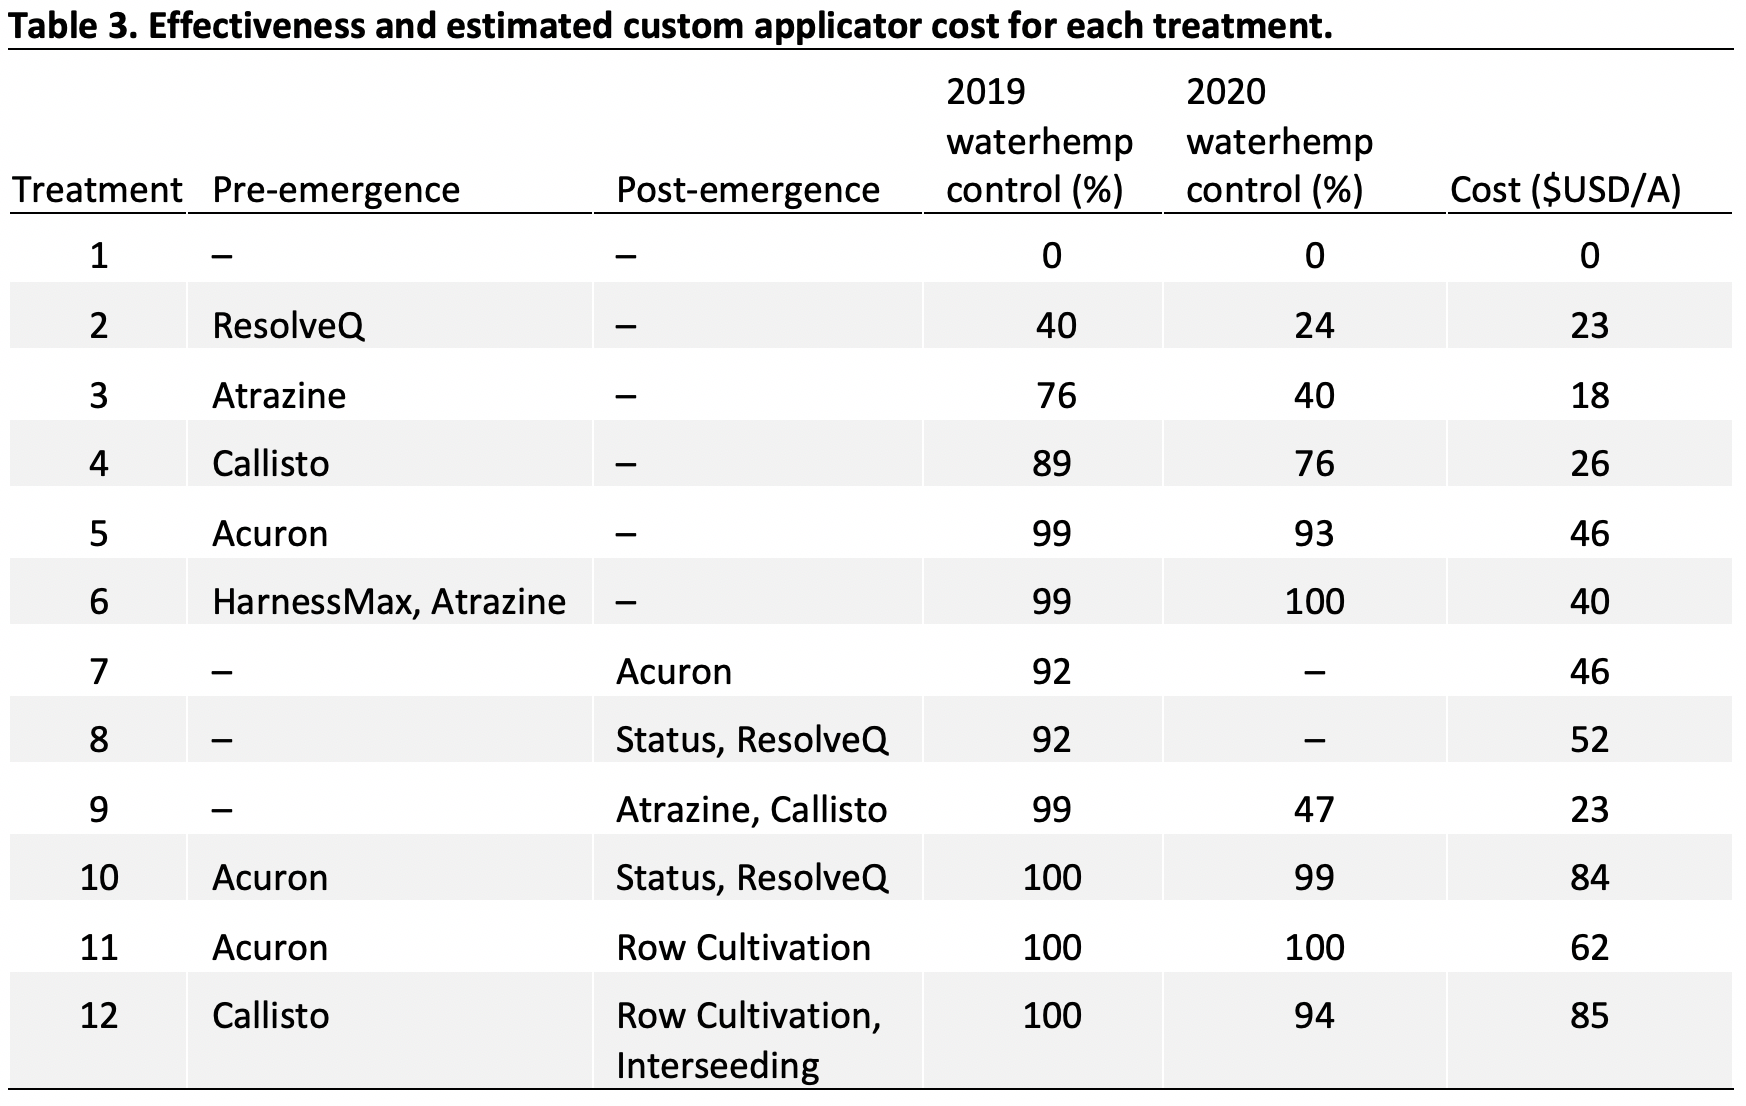
Herbicide resistant tall waterhemp (Amaranthus tuberculatus) continues to be one of the most problematic weeds in US field crops. Thus far, it has primarily established in western and central New York. Our second year of trial results generally followed our first-year results. Herbicides in WSSA groups 2, 5, and 9 should not be relied on for waterhemp control. However, programs that included at least two non-chemical tactics or herbicides from groups 4, 14, or 15 were very effective. Seedbank modelling showed that control at 95%, 98%, or 100% would cause waterhemp emergence to increase, maintain, or decrease over time, respectively. Our partial budget analysis showed that profitability generally reflected yields. We also found that cereal rye (Secale cereale) residue can provide up to 87% control of waterhemp, which, if used in conjunction with a moderately effective herbicide program, could provide excellent control.
Background and Justification
Herbicide resistant waterhemp has been reported in many western and central NY counties. Soybean farmers have reported yield losses of 50% due to this weed, even after herbicide applications. Our greenhouse spray chamber tests and field trials from 2019 suggest resistance to WSSA herbicide groups 2, 5, and 9 (ALS inhibitors, photosystem II inhibitors, and EPSPS inhibitors, respectively). Our most effective control programs in 2019 relied on herbicides from other groups as well as additional physical or cultural tactics.
Waterhemp in other states has also developed resistance to different herbicide classes, including WSSA groups 4 and 14 (http://www.weedscience.org/Pages/Species.aspx). These groups include dicamba, 2,4-D, Valor, and Cobra. Resistance to these additional herbicides would make successful waterhemp control even more challenging.
Overwintering cover crops such as cereal rye can be sprayed or rolled-down to provide a weed suppressive mulch prior to soybean planting. In NY, Pethybridge et al (2019) showed that rolled rye achieved very effective suppression not only for weeds, but also for white mold. Furthermore, waterhemp and another problematic herbicide resistant weed in NY, called horseweed or marestail (Conyza canadensis), both have very small seeds that lack the stored energy to emerge through deep soil or mulch.
Objectives
Objective 1. Continue to evaluate the effectiveness of several different programs in controlling waterhemp in soybeans.
Objective 2. Assess the potential for rye cover crop mulch to suppress waterhemp emergence.
Procedures
Objective 1.
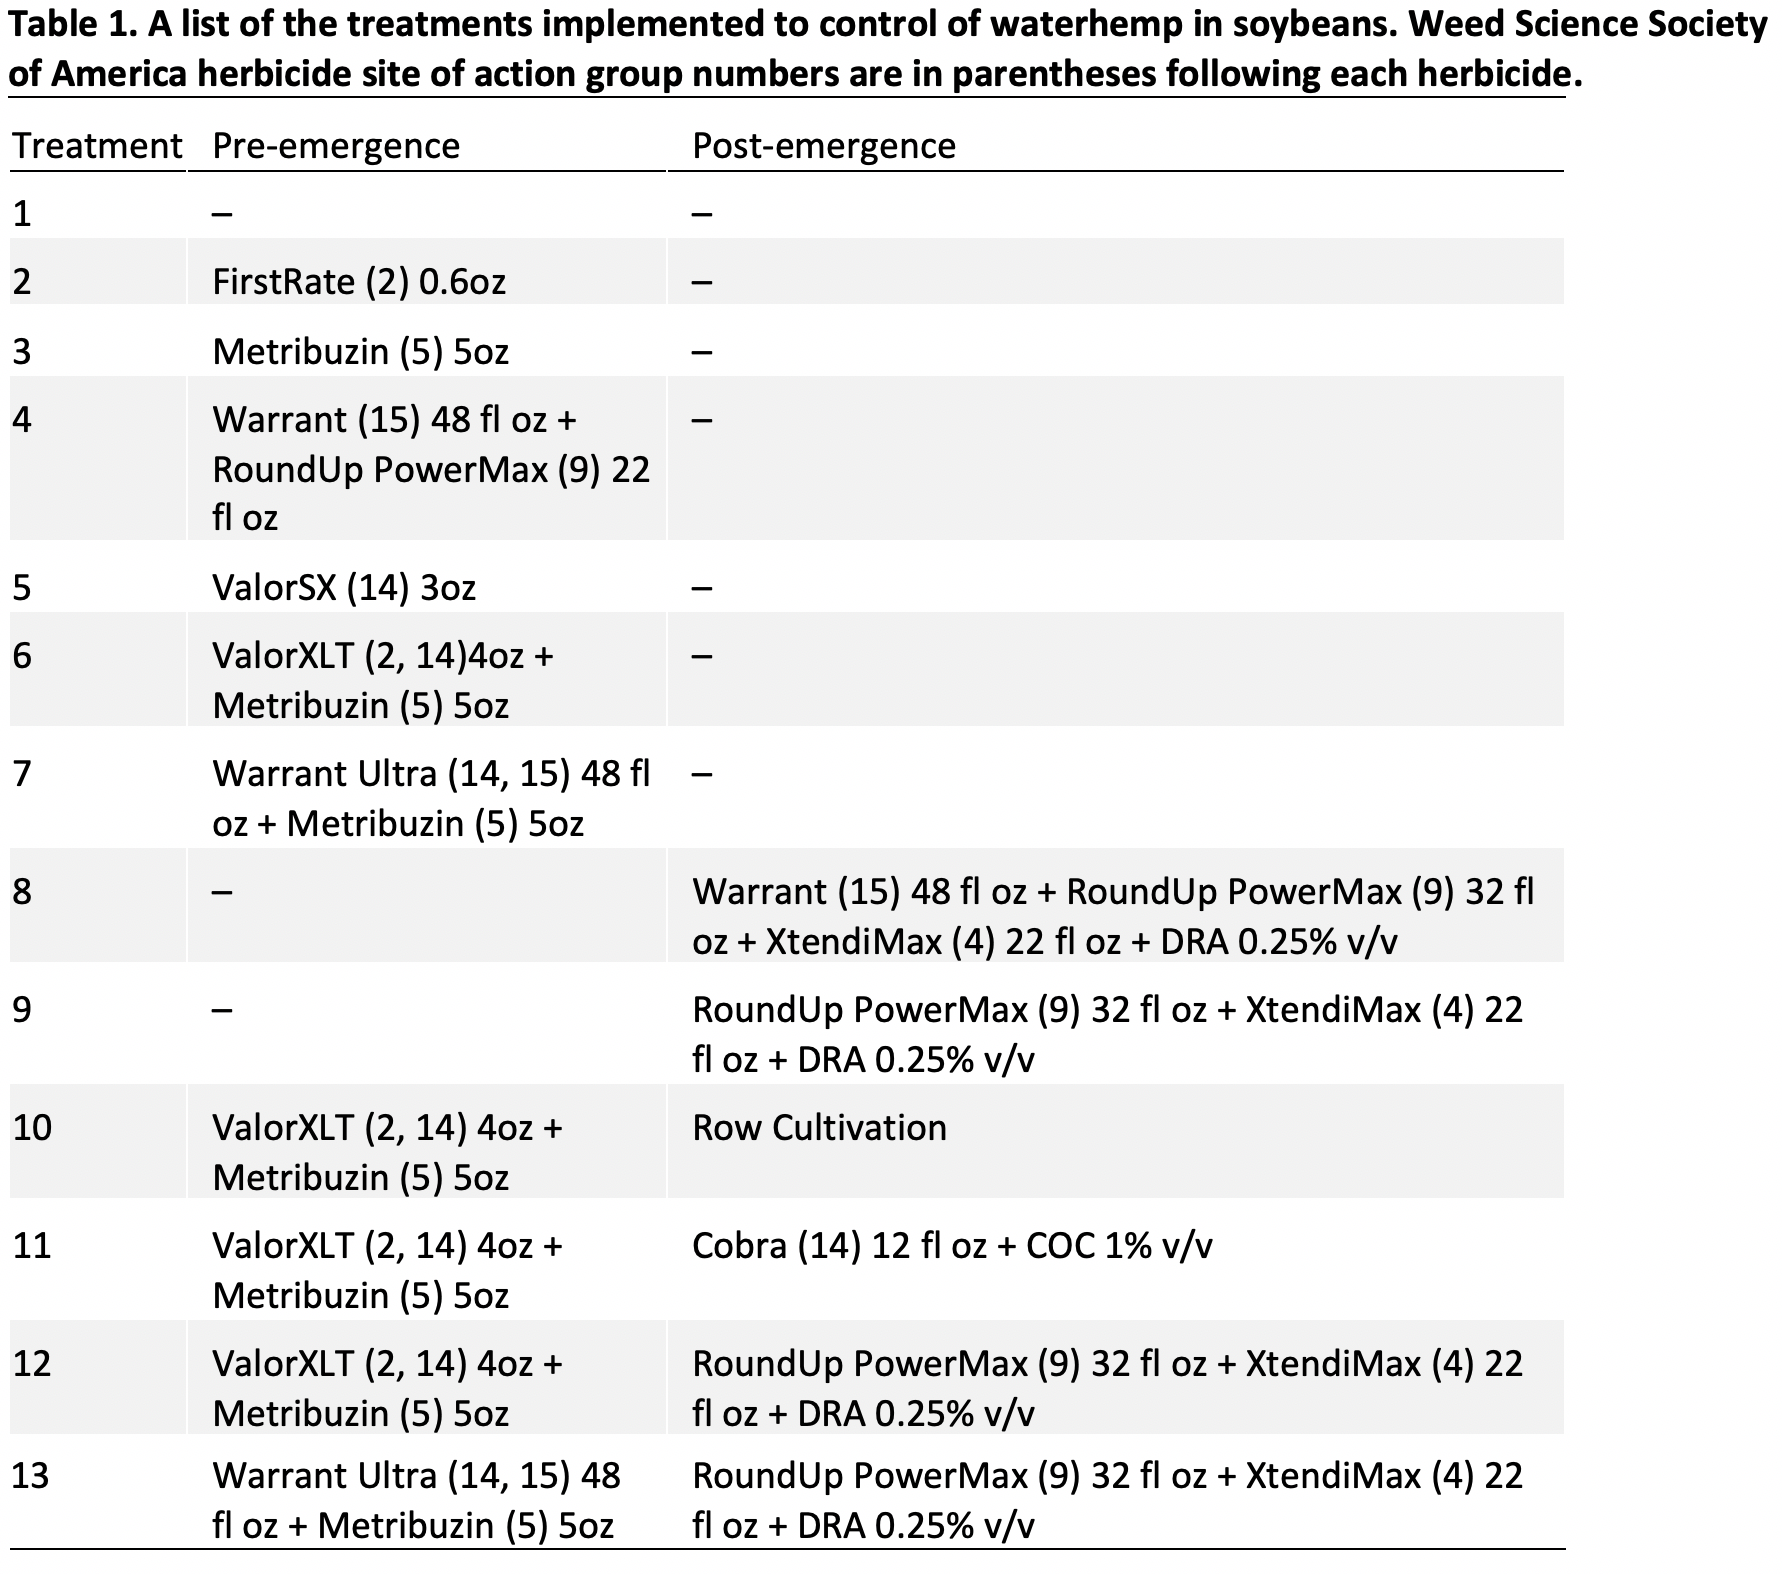
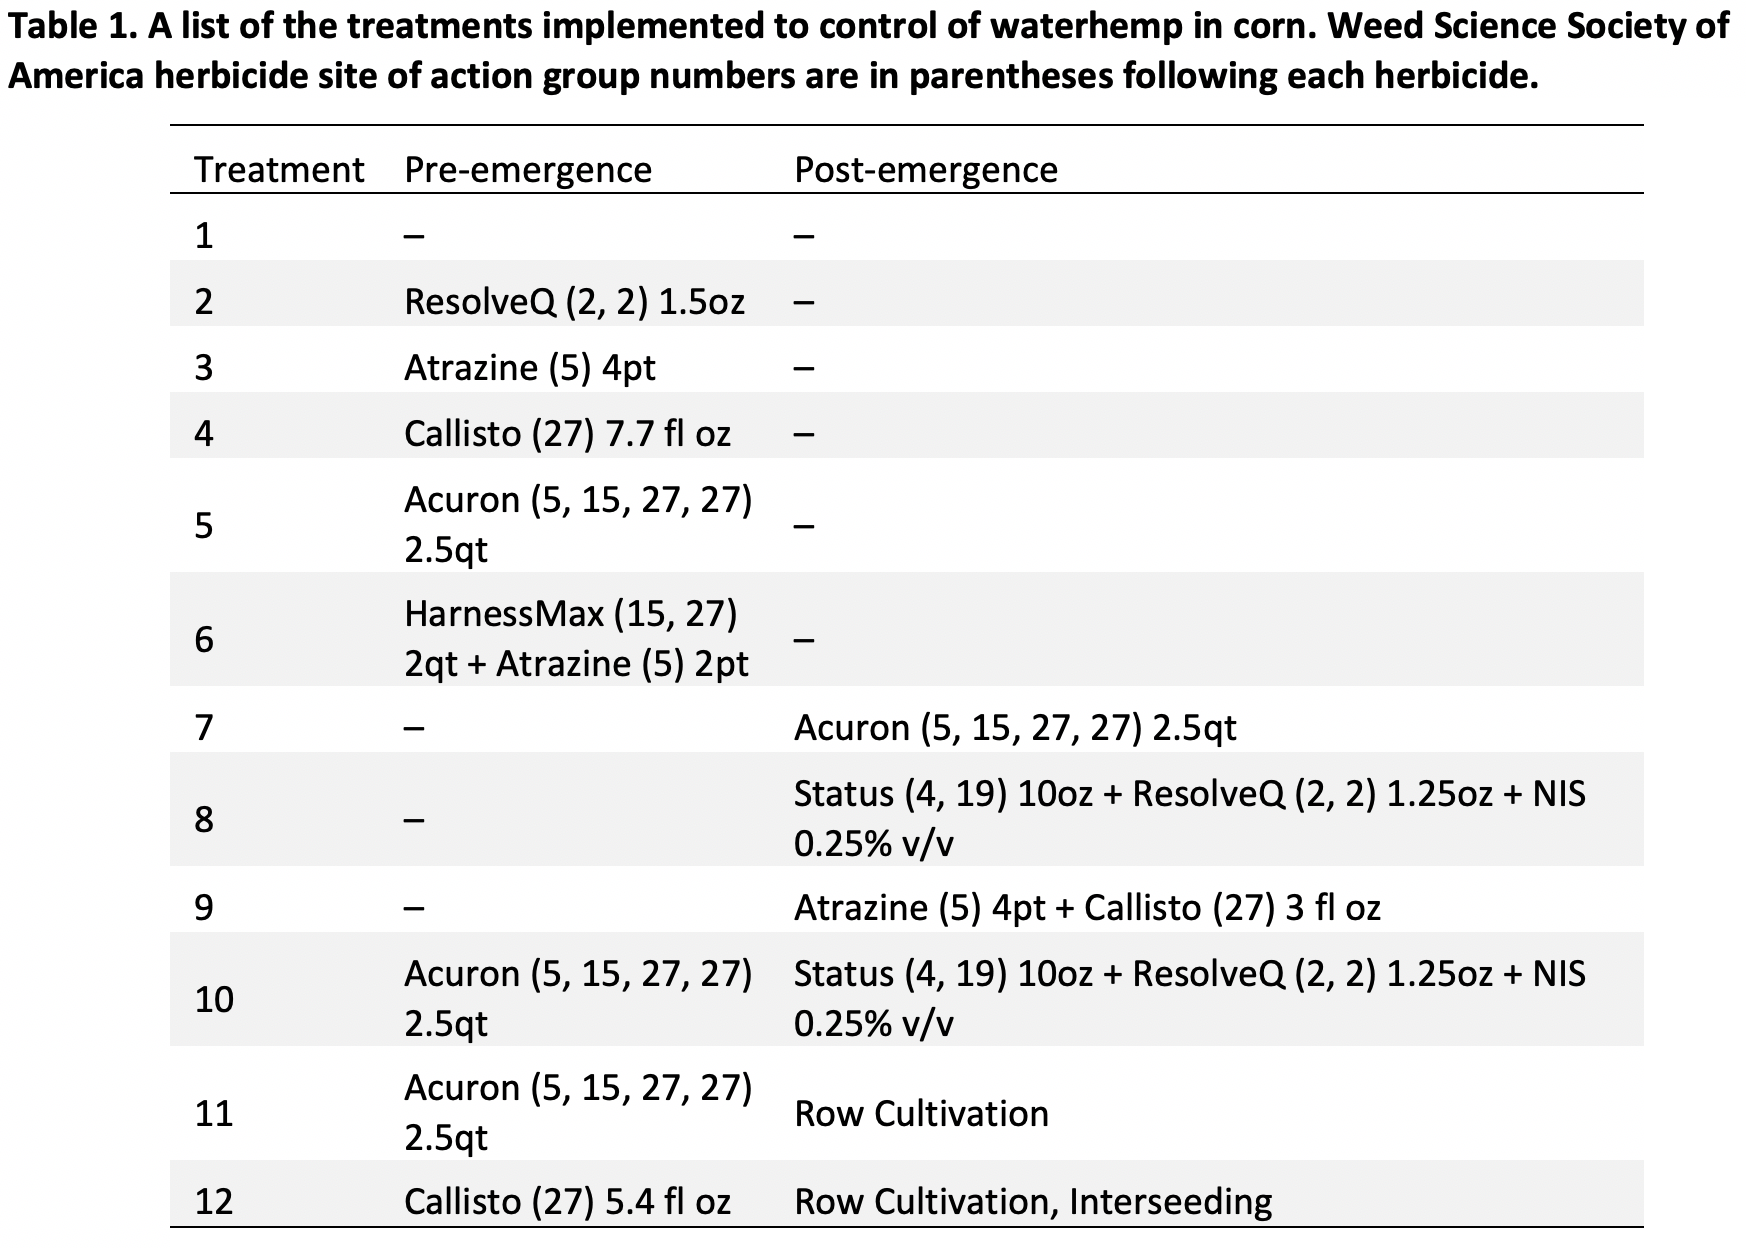
The trial site was in Seneca County, NY on a field of Odessa silt loam soil where waterhemp had survived various herbicide applications and produced seed in 2018 and was moderately controlled in 2019 in corn. In 2020, the ground was prepared for planting with a field cultivator on May 5 and planted on May 6. Pre-emergence applications were made after planting on May 8. Cultivation occurred on June 16 while the other post-emergence treatments were applied on June 18. All treatments are listed in Table 1. For fertilizer, DAP (10-46-0, 20 lbs N/A, 92 lbs P2O2/A) and muriate of potash (0-0-60, 125 lbs K2O/A) were applied prior to tillage and UAN (32-0-0, 30 lbs N/A) was applied at planting.
Plots were 25’ long and 10’ wide. Each treatment was replicated four times in a randomized complete block design. Spraying was conducted using a backpack CO2 sprayer with a 10’ boom. Spray volume was 20 gal/A applied at 40 psi. Row cultivation was achieved using a Double Wheel Hoe (Hoss Tools) with two staggered 6” sweeps (12” effective width). Two passes were made per row so that 24” of the 30” rows were cultivated.
Weed control was assessed August 15-22 by collecting all aboveground weed biomass within a 2 ft2 quadrat. The quadrat was used four times per plot, placed randomly in the two middle rows of each plot. Weeds were placed in paper bags and dried at 113 degrees F for 7 days, then weighed. Control was calculated by subtracting the biomass of each treated plot from biomass of the untreated plots, dividing by the biomass of the untreated plots, and multiplying by 100. Waterhemp was the dominant species present in this trial. Other species did not provide enough data for comparison. All waterhemp was manually removed immediately after the weed control assessments in order to prevent seed production.
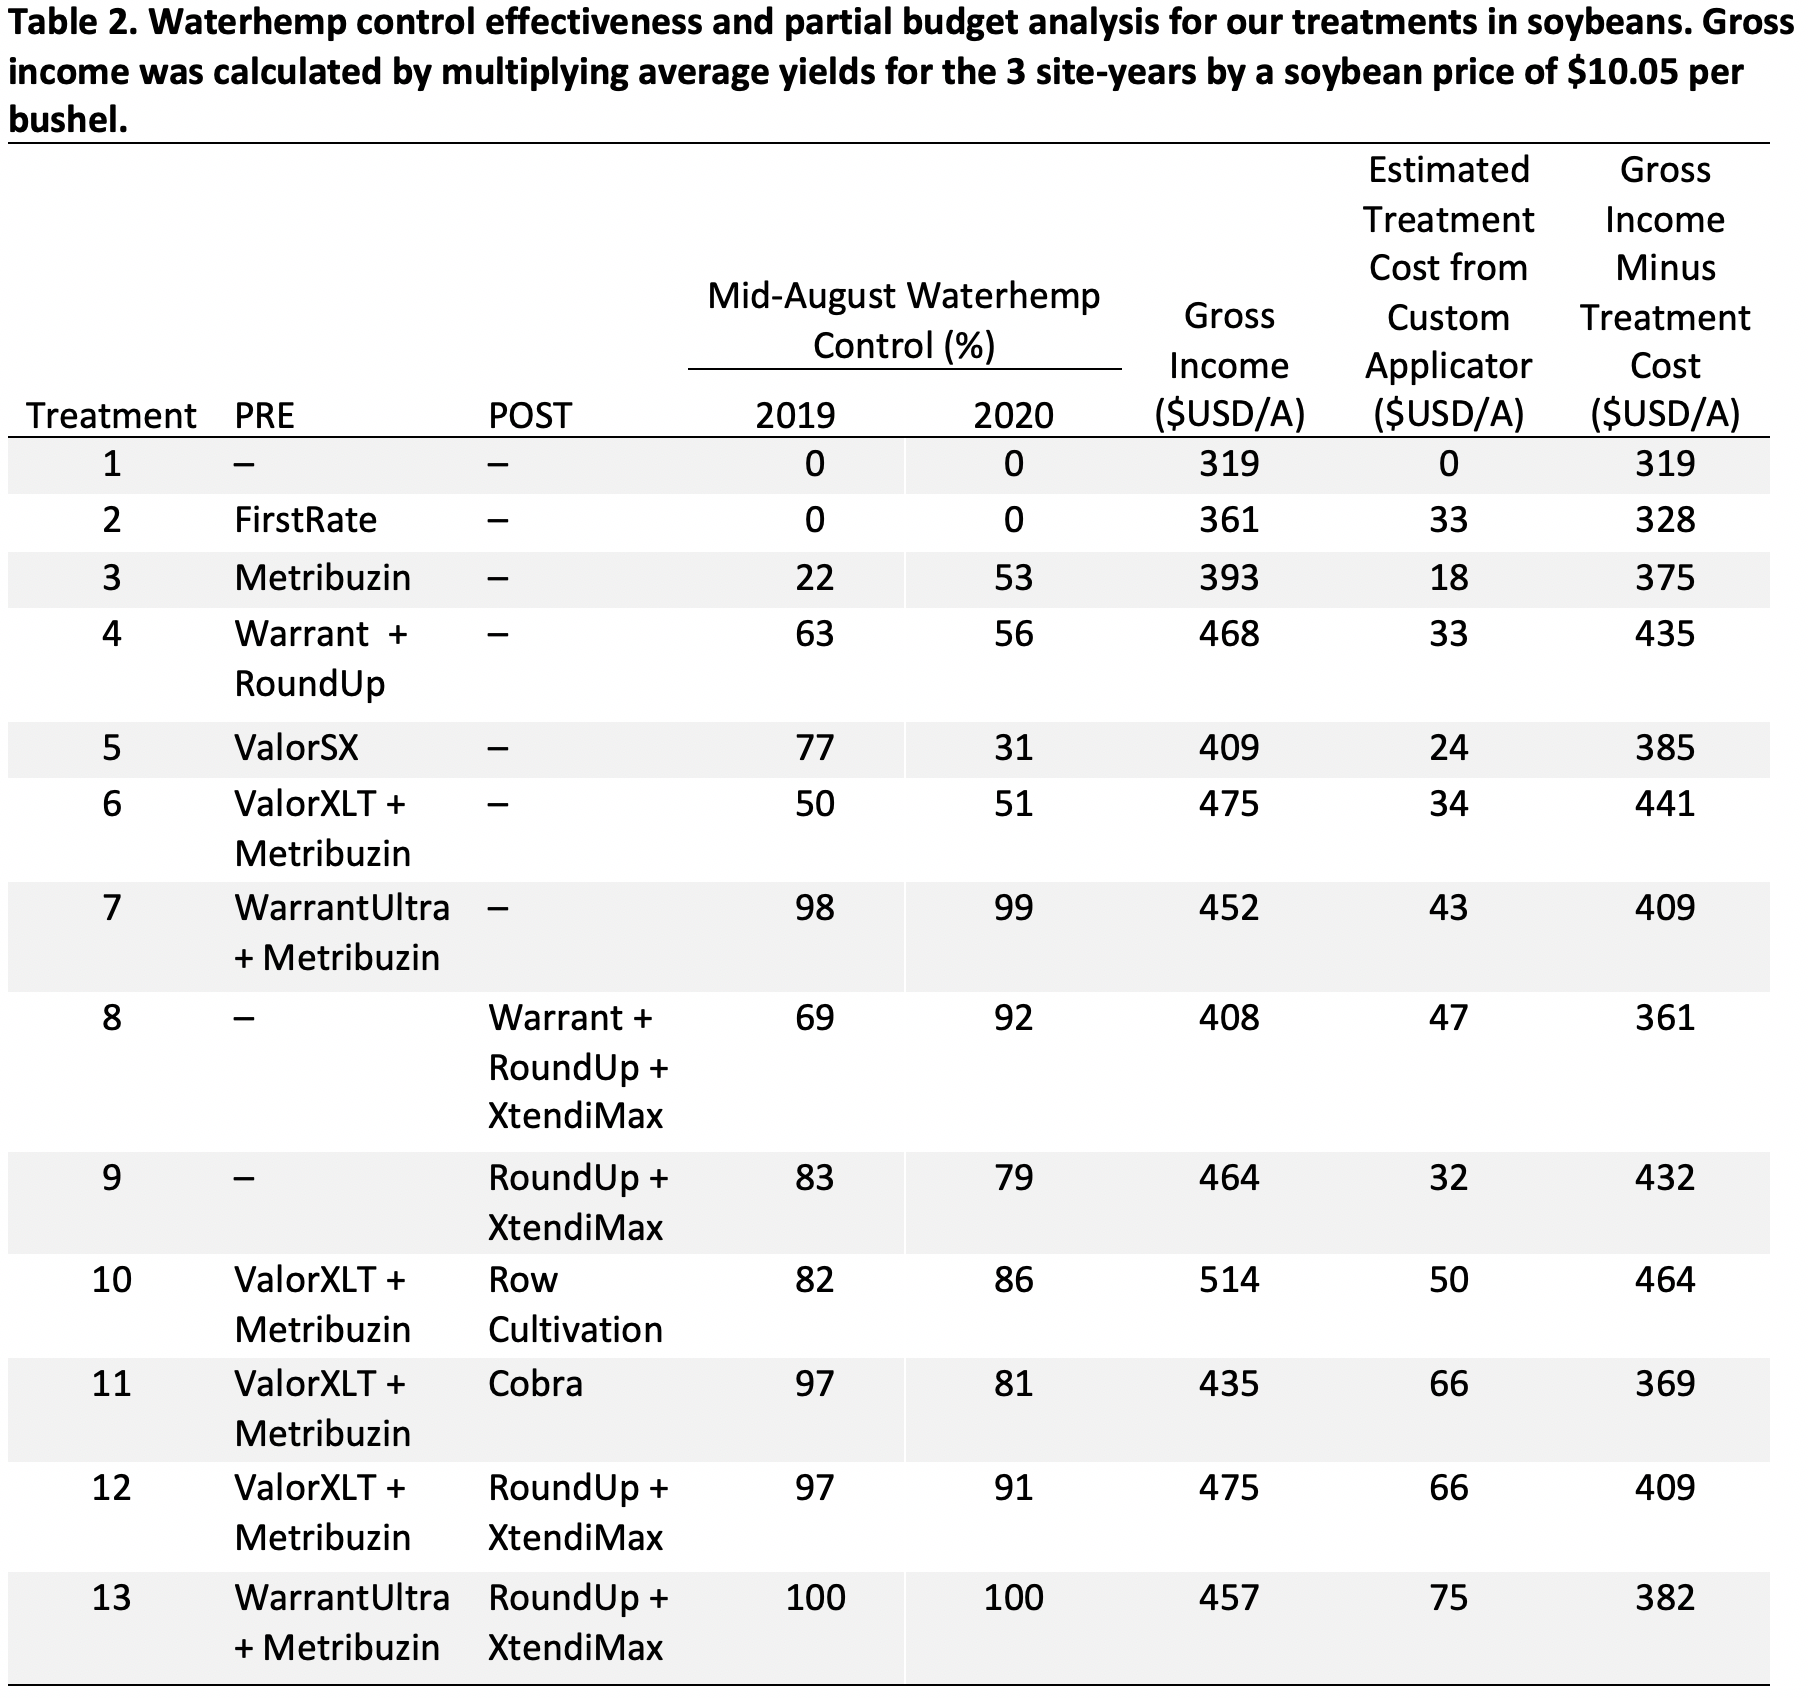
Soybean yield was measured in mid-October by hand harvesting 20-row-feet from the two middle rows of each plot. In our partial budget analysis, gross income was calculated by multiplying the average yield per treatment across all sites for 2019 and 2020 by a soybean price of $10.05 per bushel (Langemeier 2018). Weed treatment costs were estimated based on personal communications with several local custom applicators.
To illustrate the effects of allowing waterhemp to produce seed, we produced a 10-year model of waterhemp emergence based on the number of seeds in the soil. The model was created based on observed waterhemp emergence and biomass production in 2019 and assumed a preceding three-year period of uncontrolled growth. We also assumed that 8% of the seedbank would emerge each year (Davis et al. 2016) and that for a given cohort, viability was reduced by 81% after one year, reduced by an additional 50% after years two and three (Heneghan and Johnson 2017), and reduced by 32% each subsequent year (Davis et al. 2016). We also assumed waterhemp would produce 441 seeds per gram of biomass (Heneghan and Johnson 2017) with a maximum waterhemp biomass of 386 g/m2 based on our results.
Objective 2.
On separate regions of the field near the plots described in Objective 1, we set up two trials investigating the use of cereal rye residue as a waterhemp suppressive mulch. While a cereal rye cover crop was not available for these trials, we transported rye residue from a nearby field and applied it immediately following planting. We used rates of 0, 3570, and 7140 lbs/A. The high- and mid-rates represent attainable rye biomass production in NY with- and without fertilizer, respectively (Mirsky et al 2013; Pethybridge et al 2019). Plots were 5’ by 10’ and each treatment was replicated four times per trial in a randomized compete block design. Waterhemp control was measured in the same manner as Objective 1.
Results and Discussion
Objective 1.
In 2020, waterhemp control was generally similar as 2019 (Table 2). Soil was dry at the time of pre-emergence application but we received 0.9” rain in the first 10 days after application, which was likely sufficient for activation. ValorSX did not perform as well as in the previous year, possibly related to weeds that had germinated prior to activation. WarrantUltra plus metribuzin remained very effective, providing further evidence that at least two effective modes of action – WSSA groups 14 and 15 in this treatment – are necessary for successful control.
In the post-emergence-only treatments, this year the Warrant improved the effectiveness of the Roundup and Xtendimax, probably due to our earlier planting and spray dates in 2020 that likely allowed more waterhemp to germinate after the post-emergence application, making use of the residual activity of the Warrant.
Similar to the previous year, the two-pass programs were generally more effective than the pre- or post-emergence-only programs. Having two passes reduces the burden on each pass. So if conditions are not optimal in one of the passes, the other pass can help ensure successful control is still achieved. They are also generally more expensive, but inclusion of more diverse chemistries and/or non-chemical tactics can reduce the risk of worsening the resistance problem.
In our partial budget analysis, the highest grossing (highest yielding) treatments were generally the most profitable (Table 2). The high yields of the row cultivation treatment may reflect the increase in soil aeration and nutrient release associated with soil disturbance. But also, due to small plot size there was some variability in yield results due to random chance.
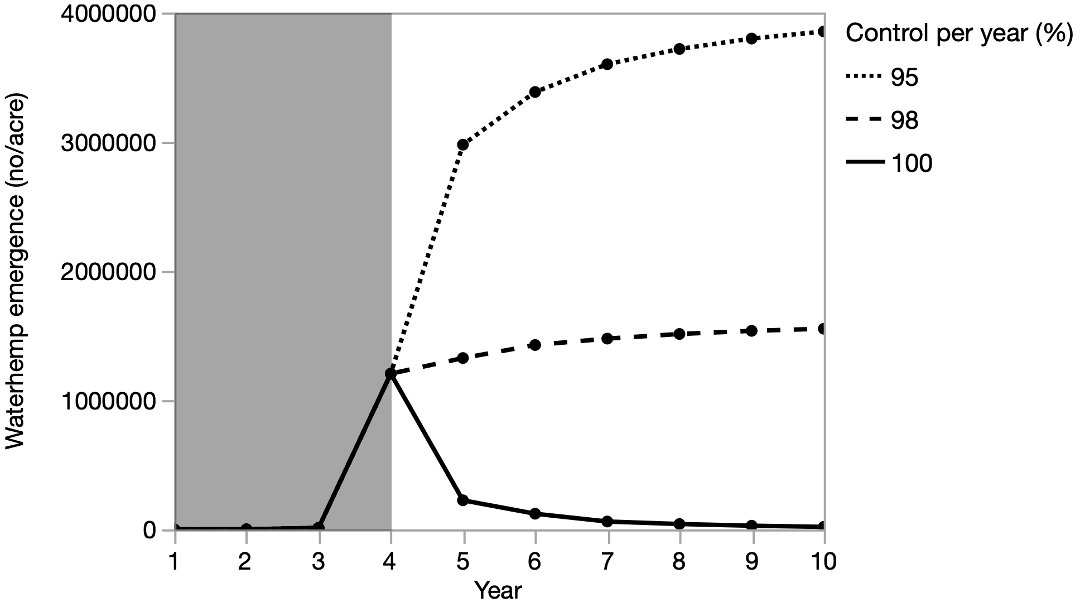
Our waterhemp production and emergence model demonstrates that programs that control 100% of the waterhemp can result in greatly reduced emergence in subsequent years, whereas programs achieving 98% control or less will perpetuate the problem (Figure 1). Although 95% control would likely allow farmers to avoid a crop yield loss, the resulting waterhemp seed production and increase in emergence in subsequent years would likely make successful control more difficult over time.
Figure 1. A model of waterhemp emergence for 95%, 98%, and 100% control (dotted, dashed, and solid lines respectively) over time. In this scenario, the newly established waterhemp population grows uncontrolled (shaded region) until year 4. The model shows that greater than 98% control is required to reduce populations over time.
Objective 2.
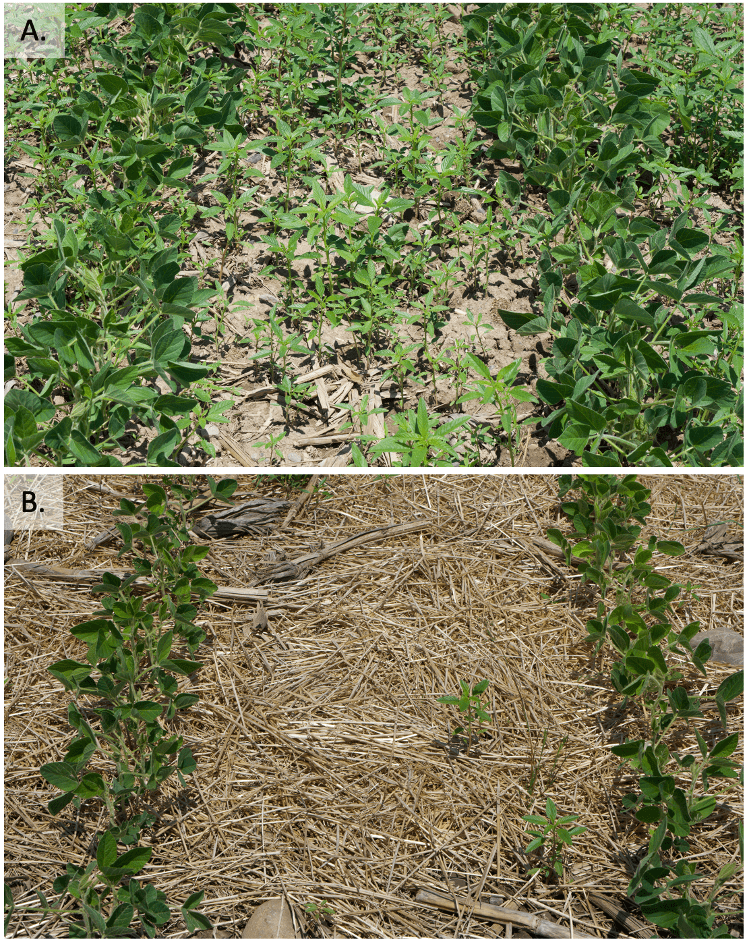
Across the two trials, cereal rye cover crop residue at high (7140 lbs/A) and medium rates (3570 lbs/A), representing biomass NY farmers could attain with- or without-fertilizer, provided an average of 87% and 73% waterhemp control compared to the untreated check, respectively. Used alone, these levels of control may be sufficient to avoid soybean yield loss. But this tactic could also be used in conjunction with a herbicide program. In such a system, 99% waterhemp control could be achieved with the high level of rye residue plus a herbicide program that only provides 92% control when used alone.
Figure 2. Suppression of waterhemp by cereal rye residue applied at 0 lbs/A (photo A) and 7140 lbs/A (photo B).
References
Davis AS, Fu X, Schutte BJ, Berhow MA, Dalling JW (2016) Interspecific variation in persistence of buried weed seeds follows trade-offs among physiological, chemical, and physical seed defenses. Ecology and Evolution. 6:6836–6845
Heneghan JM, Johnson WG (2017) The Growth and Development of Five Waterhemp (Amaranthus tuberculatus) Populations in a Common Garden. Weed Science. 65:247–255
Langemeier M (2018) Projected Corn and Soybean Breakeven Prices. Department of Agricultural and Consumer Economics, University of Illinois at Urbana-Champaign. Farmdoc Daily 8:66
Mirsky S, Ryan M, Teasdale J, Curran W, Reberg-Horton C, Spargo J, Wells S, Keene C, Moyer J (2013) Overcoming Weed Management Challenges in Cover Crop–Based Organic Rotational No-Till Soybean Production in the Eastern United States. Weed Technology, 27(1), 193-203. doi:10.1614/WT-D-12-00078.1
Pethybridge S, Brown B, Kikkert J, Ryan MR (2019) Rolled-crimped cereal rye mulch suppresses white mold in no-till soybean and dry bean. Renewable Agriculture and Food Systems. doi:10.1017/S174217051900022X
Acknowledgements
Thank you to the New York Farm Viability Institute for supporting this project.
Disclaimer: Read pesticide labels prior to use. The information contained here is not a substitute for a pesticide label. Trade names used herein are for convenience only; no endorsement of products is intended, nor is criticism of unnamed products implied. Laws and labels change. It is your responsibility to use pesticides legally. Always consult with your local Cooperative Extension office for legal and recommended practices and products. cce.cornell.edu/localoffices
Bryan Brown, NYS IPM Program
Venancio Fernandez, Bayer Crop Sciences
Mike Hunter, Cornell Cooperative Extension
Jeff Miller, Oneida County Cooperative Extension
Mike Stanyard, Cornell Cooperative Extension
Cooperators
Derek Conway, Conway Farms
Jaime Cummings, formerly NYS IPM Program
Quentin Good, Quentin Good Farms
Antonio DiTommaso, Cornell University
Michael Durant, Lewis County Soil and Water Conservation District
Scott Morris, Cornell University
Ali Nafchi, Cornell Cooperative Extension
Ryan Parker, NYS IPM Program
Jodi Putman, Cornell Cooperative Extension
Joshua Putman, Cornell Cooperative Extension
Matthew Ryan, Cornell University
Lynn Sosnoskie, Cornell University
Ken Wise, NYS IPM Program
Funding Sources
New York Farm Viability Institute
Project Location
Trial locations in Seneca and Oneida Counties but results are likely applicable statewide.
Abstract
Herbicide resistant tall waterhemp (Amaranthus tuberculatus) continues to be one of the most problematic weeds in US field crops. Thus far, it has primarily established in western and central New York. Our second year of trial results generally followed our first-year results. Herbicides in WSSA groups 2, 5, and 9 should not be relied on for waterhemp control. However, programs that included at least two non-chemical tactics or herbicides from groups 4, 14, 15, 19, or 27 were very effective. Seedbank modelling showed that control at 95%, 98%, or 100% would cause waterhemp emergence to increase, maintain, or decrease over time, respectively. Interseeding annual ryegrass in fields where waterhemp has established is not recommended, but Callisto provided acceptable control of waterhemp while not injuring the annual ryegrass.
Background and Justification
Herbicide resistant waterhemp has been reported in many western and central NY counties. Corn farmers have reported yield losses of 20% due to this weed, even after herbicide applications. Our greenhouse spray chamber tests and field trials from 2019 suggest resistance to WSSA herbicide groups 2, 5, and 9 (ALS inhibitors, photosystem II inhibitors, and EPSPS inhibitors, respectively). Our most effective control programs in 2019 relied on herbicides from other groups as well as additional physical or cultural tactics. Generally, two-pass programs with residual activity were best. But residual herbicides can injure interseeded cover crops, which have grown in popularity in NY, reflecting the work of the Western NY Soil Health Alliance and the Genesee River Coalition of Conservation Districts.
Objectives
Objective 1. Continue to evaluate the effectiveness of several different programs in controlling waterhemp in corn.
Objective 2. Continue to assess the compatibility of residual herbicides with an interseeded cover crop.
Procedures
Objective 1.
The trial site was in Seneca County, NY on a field of Odessa silt loam soil where waterhemp had survived various herbicide applications and produced seed in 2018 and was moderately controlled in 2019 in corn. In 2020, the ground was prepared for planting with a field cultivator on May 5 and planted on May 13. Pre-emergence applications were made after planting on May 20. Cultivation and interseeding occurred on June 16, while the other post-emergence treatments were applied on June 18. All treatments are listed in Table 1. For fertilizer, DAP (10-46-0, 20 lbs N/A, 92 lbs P2O2/A) and muriate of potash (0-0-60, 125 lbs K2O/A) were applied prior to tillage, UAN (32-0-0, 30 lbs N/A) was applied at planting, and ESN nitrogen (44-0-0, 150 lbs N/A) was broadcast on June 19.
Plots were 25’ long and 10’ wide. Each treatment was replicated four times in a randomized complete block design. Spraying was conducted using a backpack CO2 sprayer with a 10’ boom. Spray volume was 20 gal/A applied at 40 psi. Row cultivation was achieved using a Double Wheel Hoe (Hoss Tools) with two staggered 6” sweeps (12” effective width). Two passes were made per row so that 24” of the 30” rows were cultivated. For Objective 1, interseeding was established by hand broadcasting annual ryegrass (Mercury Brand, “Ribeye”) at 20 lb/A.
Weed control was assessed on August 16 by collecting all aboveground weed biomass within a 2 ft2 quadrat. The quadrat was used four times per plot, placed randomly in the two middle rows of each plot. Weeds were placed in paper bags and dried at 113 degrees F for 7 days, then weighed. Control was calculated by subtracting the biomass of each treated plot from biomass of the untreated plots, dividing by the biomass of the untreated plots, and multiplying by 100. Waterhemp was the dominant species present in this trial. Other species did not provide enough data for comparison. All waterhemp was manually removed immediately after the weed control assessments in order to prevent seed production.
Treatment costs were estimated based on personal communications with several local custom applicators. Yield was unable to be accurately measured this year due to variability in the field.
To illustrate the effects of allowing waterhemp to produce seed, we produced a model of annual waterhemp emergence based on the number of seeds in the soil. The model was created based on observed waterhemp emergence and biomass production in 2019 and assumed a preceding three-year period of uncontrolled growth. We also assumed that 8% of the seedbank would emerge each year (Davis et al. 2016) and that for a given cohort, viability was reduced by 81% after one year, reduced by an additional 50% after years two and three (Heneghan and Johnson 2017), and reduced by 32% each subsequent year (Davis et al. 2016). We also assumed waterhemp would produce 441 seeds per gram of biomass (Heneghan and Johnson 2017) with a maximum waterhemp biomass of 386 g/m2 based on our results.
Objective 2.
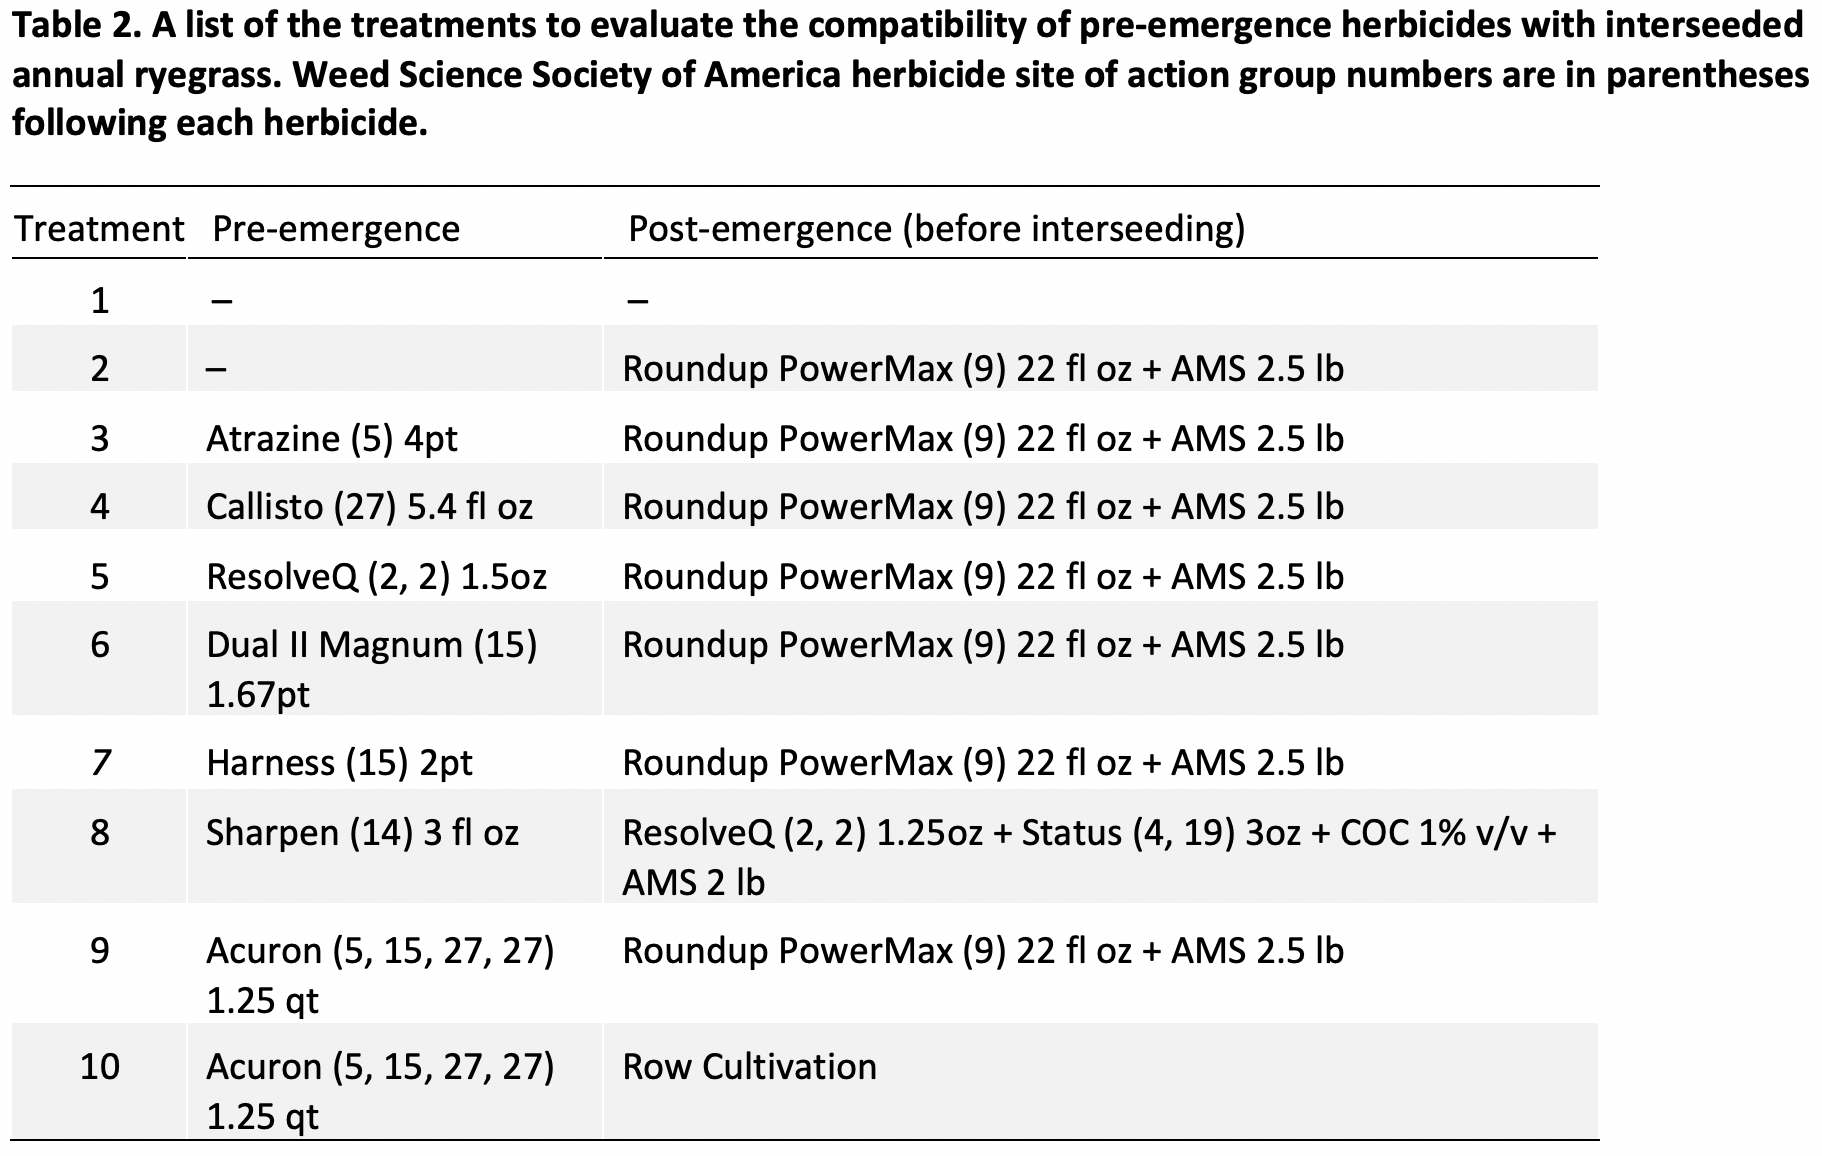
This objective was conducted in Lewis County, NY on a corn field that does not contain any waterhemp. The field (Homer silt loam soil) was tilled June 9 and planted with silage corn (Pioneer, 95 day) on June 1 with 3 gal/A starter fertilizer (7-21-7). Pre-emergence herbicides were applied on June 2, row cultivation June 30, and post-emergence herbicides on July 1. All treatments are listed in Table 2. Interseeding was conducted by the Lewis County Soil and Water Conservation District on July 6 using a 15’ interseeder (Interseeder Technologies) with three drills between each corn row operating at 0.5” depth. Annual ryegrass (Mercury Brand, “Ribeye”) was used at 20 lb/A.
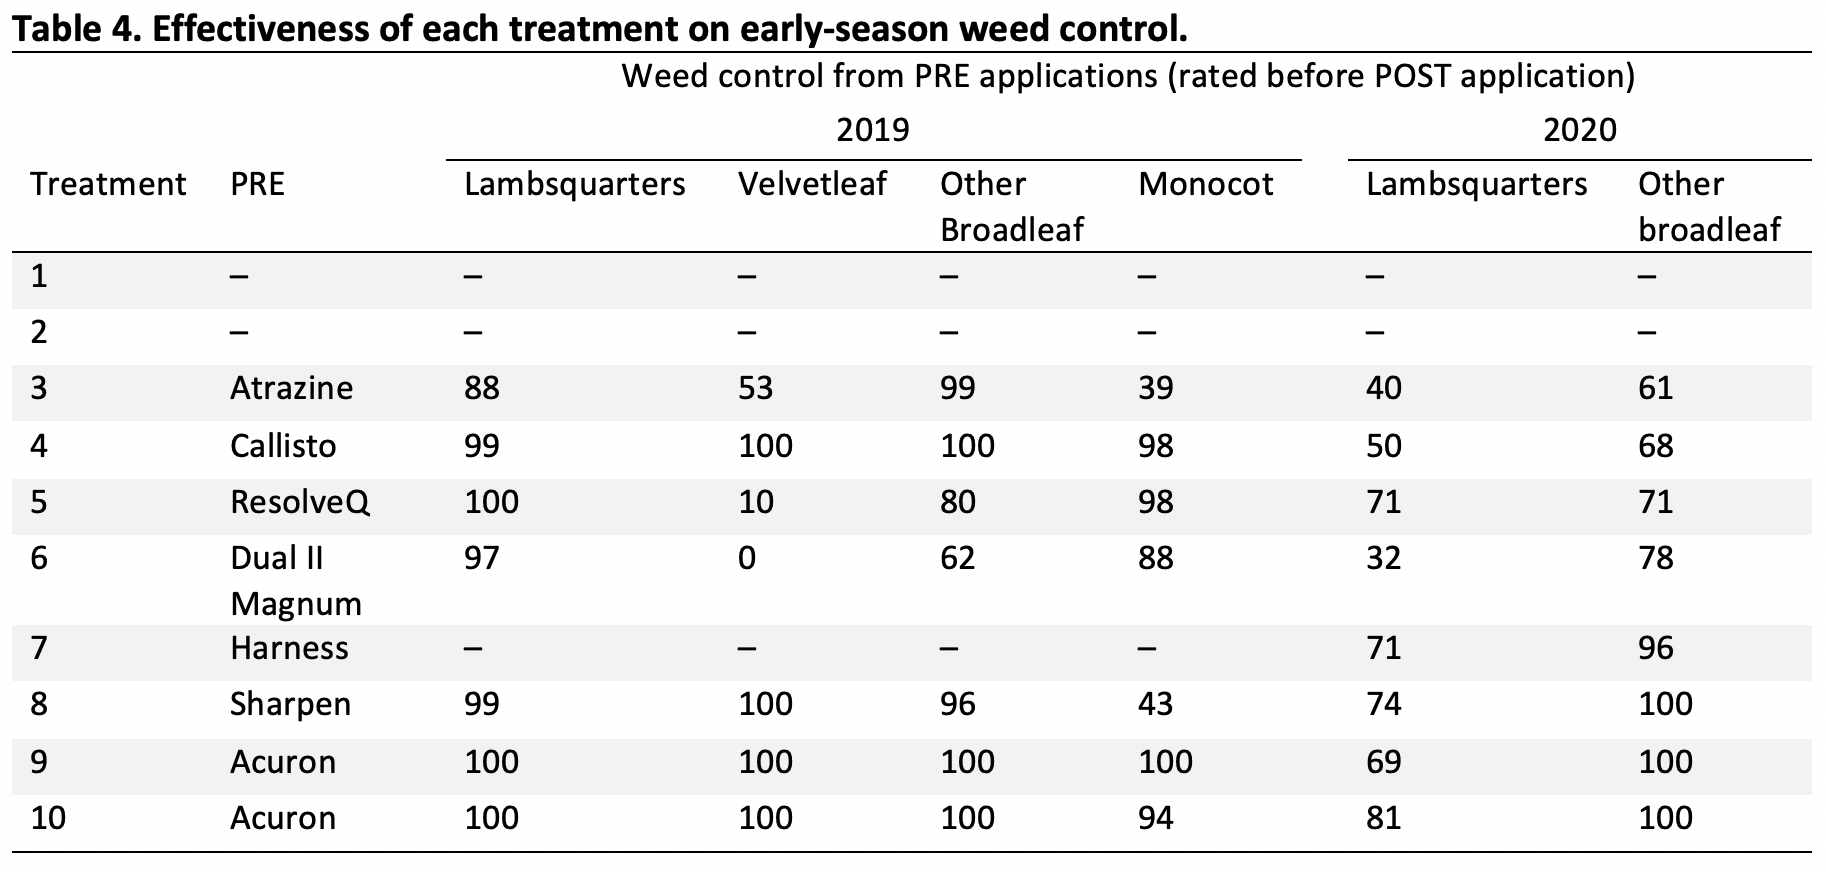
Weed control of the pre-emergence herbicides was evaluated on June 30 by visually estimating the percentage of the ground covered by the most prevalent species or categories – this year only common lambsquarters and “other broadleaf species” were present in sufficient quantity to rate. This was done using the same quadrat system described above and control was calculated in a similar manner.
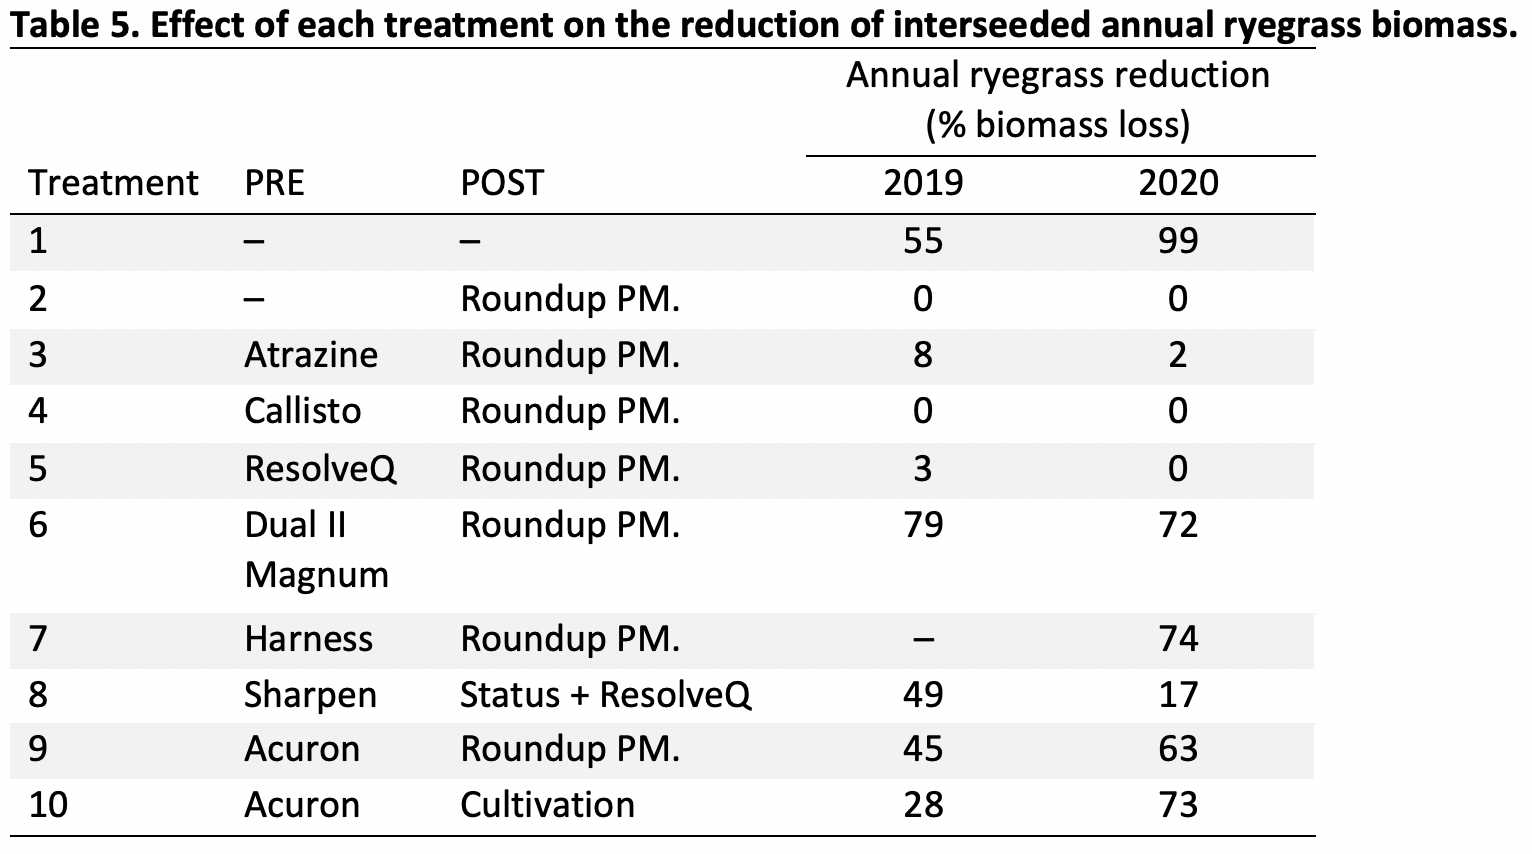
Performance of the annual ryegrass was assessed on September 17 by collecting the aboveground biomass using the quadrat system and drying samples at 113 degrees F for 7 days before weighing. Although there would have been more cover crop biomass later in the fall, silage harvest would likely have altered the results.
Results and Discussion
Objective 1.
Most of the treatments performed similarly to 2019, but some were clearly affected by insufficient rainfall (Table 3). In the first 10 days after preemergence application, we had 0.5” rain, so some of those residual products were not optimally activated. We continued to see evidence of waterhemp resistance to WSSA groups 2 and 5, as represented by ResolveQ and atrazine, respectively.
We were able to apply only one post-emergence-only application in 2020 and it did not perform well, reflecting the drought conditions. In the 19 days prior to post application, we had 0.1” rain and there was no significant rain until nine days after the post-emergence application. In drought conditions, weeds become stressed and systemic herbicides do not translocate as they should.
The two-pass programs were generally more effective than pre- or post-only programs. They are also generally more expensive, but inclusion of more diverse chemistries and/or non-chemical tactics can reduce the risk of worsening the resistance problem. Furthermore, our waterhemp production and emergence model demonstrates that programs that control 100% of the waterhemp can result in greatly reduced emergence in subsequent years, whereas programs achieving 98% control or less will perpetuate the problem (Figure 1). Although 95% control would likely allow farmers to avoid a crop yield loss, the resulting waterhemp seed production and increase in emergence in subsequent years would likely make successful control more difficult over time.
Figure 1. A model of waterhemp emergence for 95%, 98%, and 100% control (dotted, dashed, and solid lines respectively) over time. In this scenario, the newly established waterhemp population grows uncontrolled (shaded region) until year 4. The model shows that greater than 98% control is required to reduce populations over time.
Objective 2.
This objective was primarily focused on the effects of residual herbicides on interseeded annual ryegrass, but we also rated weed control prior to post-emergence applications (Table 4). Lambsquarters control was not as effective as in 2019, possibly related to decreased rainfall, but 0.9” rain was recorded in the first ten days following application, so activation should have been achieved. Other broadleaf control was also not as effective for certain treatments, but this may reflect the inclusion of velvetleaf in this category in 2020.
Injury to the interseeded annual ryegrass was similar to the results of the previous year (Table 5). Unfortunately, the 2019 effect of cultivation seemingly reducing the injury caused by Acuron was not observed in 2020. We were surprised in both years that atrazine did not cause more injury, but it may relate to the high organic matter of the field. Overall, Callisto again offered the most effective waterhemp control in Objective 1 trials, while causing minimal injury to the interseeded annual ryegrass. However, overlapping chloroacetamides (like Dual or Harness) is a key aspect of controlling resistant waterhemp and this tactic would not be compatible with interseeding.
Immediately prior to corn silage harvest, we had nearly 90% less annual ryegrass biomass in 2020 compared to 2019. The primary difference was that in 2020 the corn was larger at interseeding and likely outcompeted the annual ryegrass. In 2020, the corn had accumulated 655 growing degree days at interseeding compared to 550 in 2019. To access growing degree day information from a weather station near you visit http://newa.cornell.edu/ .
References
Davis AS, Fu X, Schutte BJ, Berhow MA, Dalling JW (2016) Interspecific variation in persistence of buried weed seeds follows trade-offs among physiological, chemical, and physical seed defenses. Ecology and Evolution. 6:6836–6845
Heneghan JM, Johnson WG (2017) The Growth and Development of Five Waterhemp (Amaranthus tuberculatus) Populations in a Common Garden. Weed Science. 65:247–255
Acknowledgements
Thank you to the New York Farm Viability Institute for supporting this project.
Disclaimer: Read pesticide labels prior to use. The information contained here is not a substitute for a pesticide label. Trade names used herein are for convenience only; no endorsement of products is intended, nor is criticism of unnamed products implied. Laws and labels change. It is your responsibility to use pesticides legally. Always consult with your local Cooperative Extension office for legal and recommended practices and products. cce.cornell.edu/localoffices
Quirine Ketterings1, Sanjay Gami1, Greg Godwin1, Karl Czymmek1,2, and Mike Reuter3 Cornell University Nutrient Management Spear Program1, PRO-DAIRY2, and Dairy One3
Introduction
The corn stalk nitrate test (CSNT) is an end-of-season evaluation tool for N management for corn fields in the 2nd year or more that allows for identification of situations where more N was available during the growing season than the crop needed. Research shows that the crop had more N than needed when CSNT results exceed 2000 pm. Results can vary from year to year but where CSNT values exceed 3000 ppm for two or more years, it is highly likely that N management changes can be made without impacting yield.
Findings 2010-2020
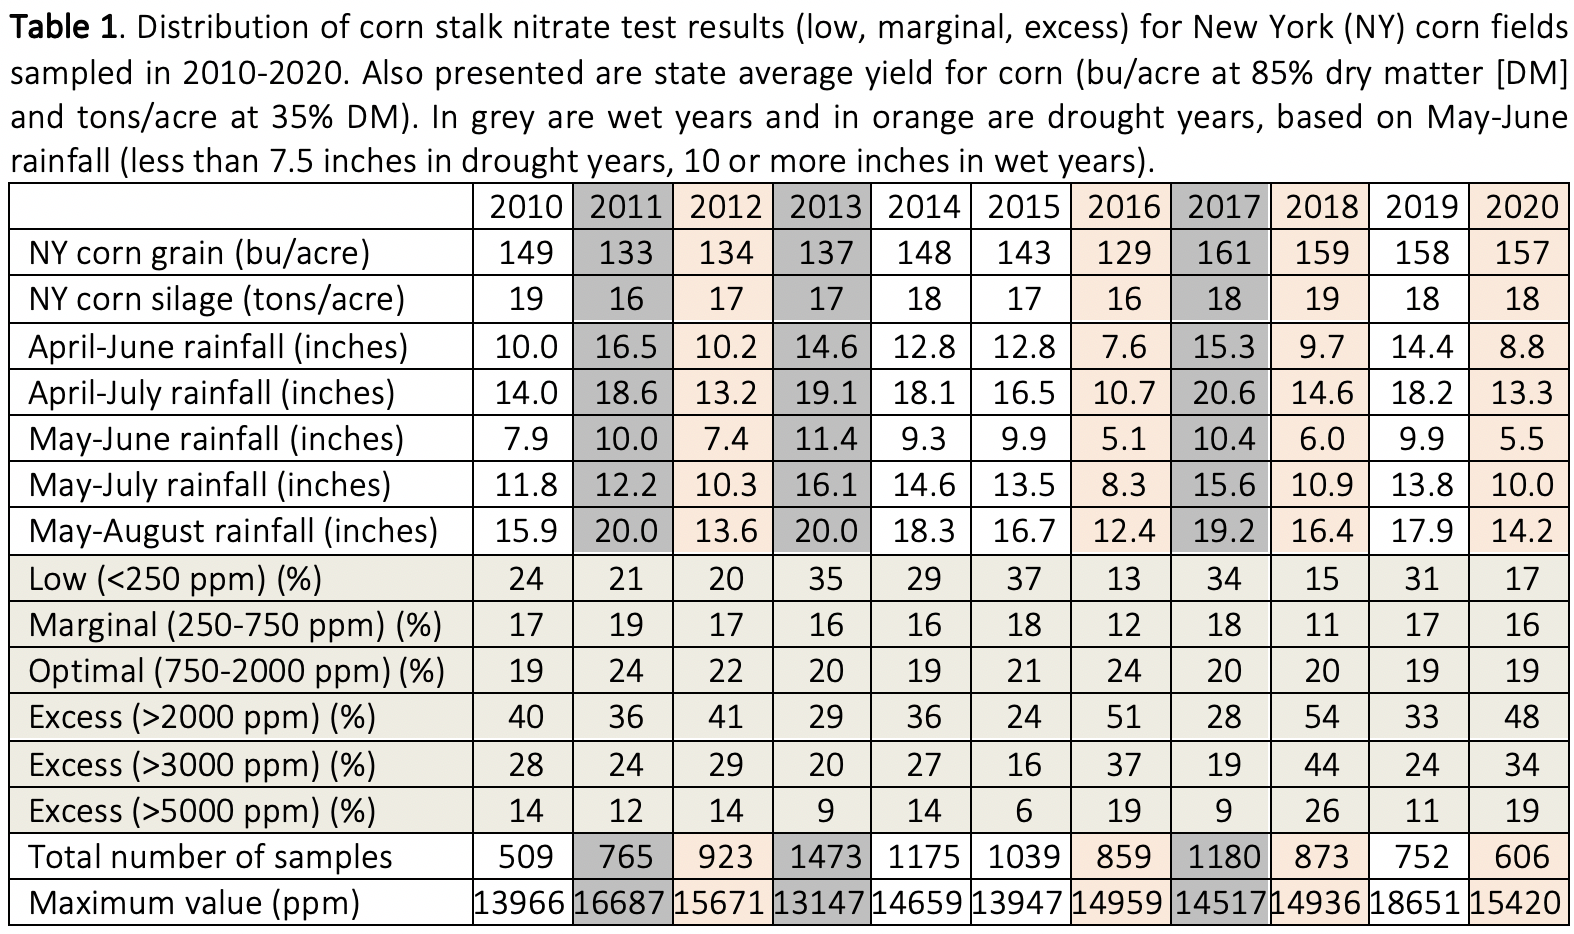
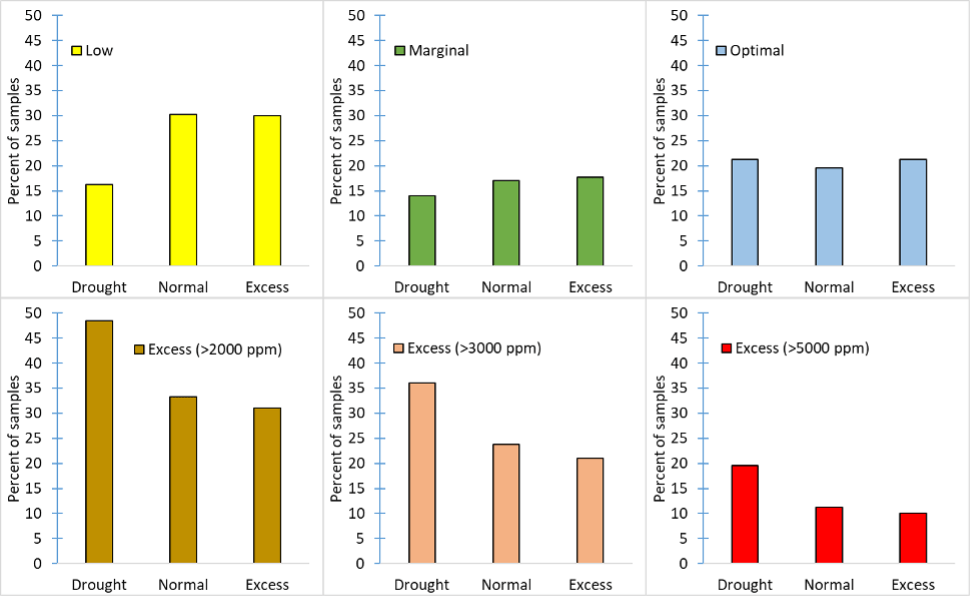
In 2020, 48% of all tested fields had CSNT-N greater than 2000 ppm, while 34% were over 3000 ppm and 19% exceeded 5000 ppm (Table 1). In contrast, 17% of the 2020 samples were low in CSNT-N. The percentage of samples testing excessive in CSNT-N was most correlated with the precipitation in May-June with droughts in those months translating to a greater percentage of fields testing excessive. Because crop and manure management history, soil type and growing conditions all impact CSNT results, conclusions about future N management should take into account the events of the growing season. This includes weed and disease pressure, lack of moisture in the root zone in drought years, lack of oxygen in the root zone due to excessive rain in wet years, and any other stress factor that can impact crop growth and N status.
Note: Data prior to 2013 reflect corn stalk nitrate test submissions to NMSP only; 2013, 2014, and 2017-2020 data include results from NMSP and Dairy One; 2015-2016 includes samples from NMSP, Dairy One, and CNAL. Yield data are from the USDA – National Agricultural Statistics Service. Rainfall data were from CLIMOD 2 obtained from the Northeast Regional Climate Center.
Within-field spatial variability can be considerable in New York, requiring (1) high density sampling (equivalent of 1 stalk per acre at a minimum) for accurate assessment of whole fields, or (2) targeted sampling based on yield zones, elevations, or soil management units. The 2018 expansion of adaptive management options for nutrient management now includes targeted CSNT sampling as a result of findings that targeted sampling generates more meaningful information while reducing the time and labor investment into sampling. Two years of CSNT data are recommended before making any management changes unless CSNT’s exceed 5000 ppm, in which case one year of data is sufficient.
Figure 1: In drought years more samples test excessive in CSNT-N while fewer test low or marginal. The last 11 years include four drought years (2012, 2016, 2018, and 2020), three wet years (2011, 2013, and 2017), and four years labelled normal (2010, 2014, 2015, 2019) determined by May-June rainfall (less than 7.5 inches in drought years, 10 or more inches in wet years).
Agronomy Factsheets #31: Corn Stalk Nitrate Test (CSNT); #63: Fine-Tuning Nitrogen Management for Corn; and #72: Taking a Corn Stalk Nitrate Test Sample after Corn Silage Harvest. http://nmsp.cals.cornell.edu/guidelines/factsheets.html.
Acknowledgments
We thank the many farmers and farm consultants that sampled their fields for CSNT. For questions about these results contact Quirine M. Ketterings at 607-255-3061 or qmk2@cornell.edu, and/or visit the Cornell Nutrient Management Spear Program website at: http://nmsp.cals.cornell.edu/.

 This research was funded with federal formula funds. We thank the Paul Stachowski, farm manager of the Musgrave Research Farm at Aurora, NY, for help with field management. We also thank the many NMSP team members for help with harvest and sample processing over the years. For questions about these results, contact Quirine M. Ketterings at 607-255-3061 or qmk2@cornell.edu, and/or visit the Cornell Nutrient Management Spear Program website at: http://nmsp.cals.cornell.edu/.