
Quirine Ketterings, Sebastian Cela, Karl Czymmek and Steve Crittenden
Nutrient Management Spear Program, Department of Animal Science, Cornell University
Nutrient balance is short for “whole farm nutrient mass balance”. While this is a mouthful to say, knowing a whole farm nutrient mass balance for a farm can help managers identify opportunities for improvements that impact farm profitability and the environment. A whole farm nutrient mass balance or NMB is a way to track the difference between nutrients coming to the farm (mainly in feed and fertilizer) and nutrients leaving the farm (mainly in milk). Dairy farm NMBs range widely in the Northeast. Farms with a high balance often have opportunities to save money and reduce potential losses to the environment. Other farms may be mining soil nutrients (farms with negative balances) and need to import more nutrients to sustain productivity in the long term. Knowing the NMB status of your farm can tell you if there is too much, not enough, or about the right amount of nutrients in your farm’s cycle.
When a milk truck pulls out of the driveway, nutrients are being exported off the farm. The same holds if the farm exports crops or animals. Each animal, bushel or ton of crop, or gallon of milk contains nitrogen, phosphorus and potassium. No animal is able to extract 100% of the nutrients consumed in its feed. A crop cannot capture all the nutrients used to fertilize it either. As a result, a farm cannot remain productive in the long run without importing more nutrients than it exports. Knowing what balance to strive for and what areas to look at more closely can help you improve or maintain sustainability at your farm.
For the last 10 years, we have worked with many New York dairy farmers and their advisors to better understand what real farms in New York can achieve without giving up on milk production. First, let’s look more closely at what a whole farm nutrient mass balance is.
Whole Farm Nutrient Mass Balance

A whole farm nutrient mass balance is the difference in nitrogen (N), phosphorus (P), and potassium (K) imported onto the farm in the form of feed, fertilizer, animals, and bedding, and nutrient exported off the farm in milk, crops, animals and manure. The difference between nutrients imported and nutrients exported can be expressed as N, P and K balance per acre of cropland, and per unit (cwt or hundred weight) of milk produced (Fig. 1). An NMB summary simply draws a boundary around the farm and accounts for only those nutrients being imported across the farm boundary and those exported off the farm. A whole farm nutrient mass balance calculator was first developed by Stuart Klausner at Cornell University about 20 years ago and has been updated several times since.  This calculator is targeted foruse by dairy farms, though NMBs can be determined for any type of agricultural operation. We have a questionnaire available to help gather the data. Briefly, these inputs are listed in Table 1.
Where Should Your Whole Farm Balance Be?
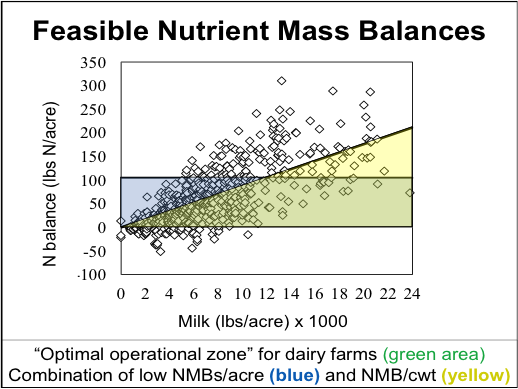
A sustainable nutrient mass balance should allow dairy farms to be economically profitable, environmentally sustainable, and flexible enough to allow for the many variations among farms. We defined “feasible” nutrient mass balances per acre and per cwt of milk produced as shown in Table 2, based on our work with a set of 102 New York dairy farms. Combining both balances (per acre and per cwt), the most efficient farms have balances in the green area (the “Optimum Operational Zone” or “Green Box”) in Figure 2.  This example in Figure 2 is for nitrogen. Evaluations so far have shown that farms operating outside of the green box have opportunities for improvements in nutrient use.
Farmer Feedback
Farms that complete the assessment for at least four years have shown great improvements over time without giving up on milk production. A number of farms have reduced balances while increasing milk production due to more precise feeding. We don’t have farm financial records, but the fact that balances were improved without giving up on milk production strongly suggests that the farms gained by keeping track of their mass balances. Each farm is unique so management practices that allow a farm to become more efficient with nutrients were also farm specific. Some common themes for review are careful evaluation of cow feeding programs, change of feed imports where possible, focus on increasing homegrown forage production through better crop and pasture management and better allocation of fertilizers to fields to support the crops. some farmers made crop rotation changes, while others decided to increase acreage, or export more crops and/or manure.
Farmers can do the assessment themselves by using the tool on our website and generate a report once all data are entered. The farmers that share their data with us or submit their completed input sheets to us receive a comprehensive report that includes a comparison of their farm data with the data of all other farms in the database (all farm names are kept confidential). Farmers can learn from each other by comparing their operations and by discussing the results in their own management team. Here is some feedback from participating farmers about the benefit of doing the balance and sharing results:
“With enough farms in the database that are similar in size and cropping program to ours, we can make valid comparisons. It helps us to see what can be achieved and gives us a good sense of where we stand in our goal to be as nutrient efficient as is possible.”
“Immediately it makes you think of things in a different light or from a different perspective, than we normally look at things in either dollars and cents or feed pounds or feed pounds wasted or what we are feeding the cows it steps back one step further and makes you look at the big picture.”
“When we share the information with the whole farm team it sparks useful and important conversations about our farm’s philosophy and practical applications to concrete practices such as manure application, crop sales and purchases.”
Join Us!
Don’t hesitate, join us and let’s learn together. The software and supporting information (manual, input sheets, etc.) are freely downloadable from the whole farm nutrient mass balance project page of the Cornell Nutrient Management Spear Program (NMSP) website: http://nmsp.cals.cornell.edu/NYOnFarmResearchPartnership/MassBalances.html. Download the input sheets and derive the balance yourself or let us join your evaluation! The software works on IBM computers and is currently not available for Macs.
Acknowledgments
 This work was supported by grants from the Northern New York Agricultural Development Program (NNYADP), Northeast Sustainable Agriculture Research and Extension (NESARE), Federal-Formula Funds, and a USDA-NRCS Conservation Innovation Grant. For questions feel free to contact Quirine M. Ketterings at qmk2@cornell.edu.
