Author Archives: Dan Olmstead

About Dan Olmstead

I'm the NEWA Coordinator here at the New York State IPM Program. I work to provide online decision support to growers in NY and across the country for IPM and agricultural best practices.

How backup weather data are used on NEWA

Weather stations occasionally use substituted data for quality control purposes. This article describes why and how.

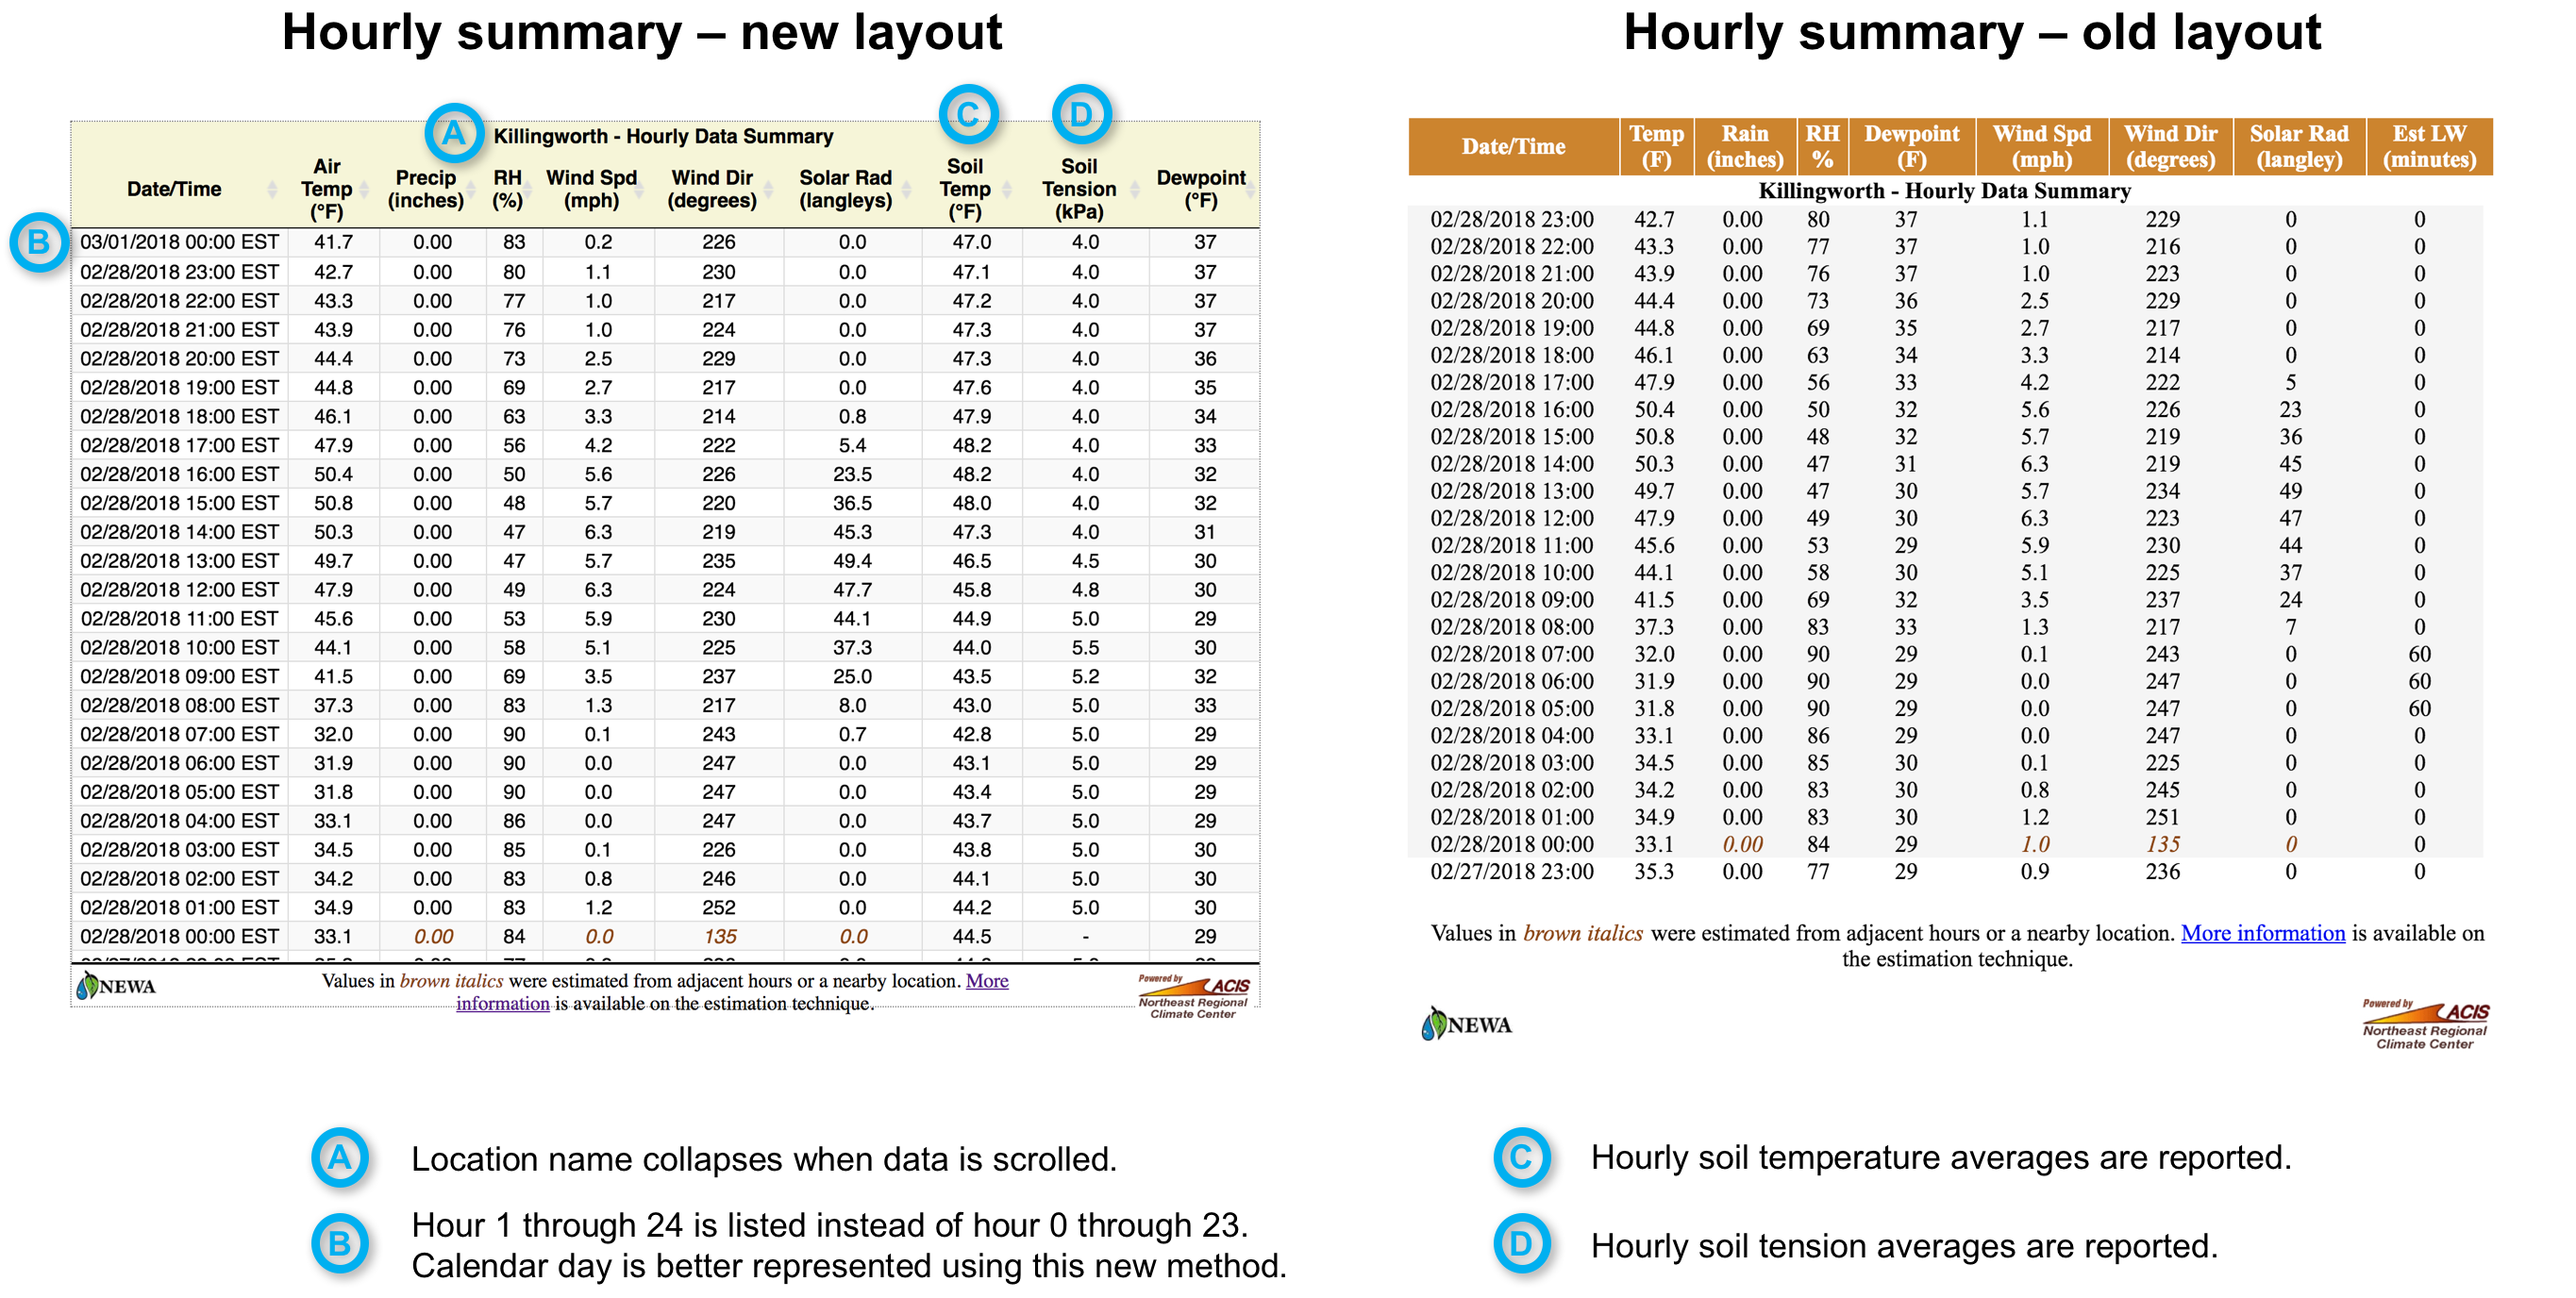
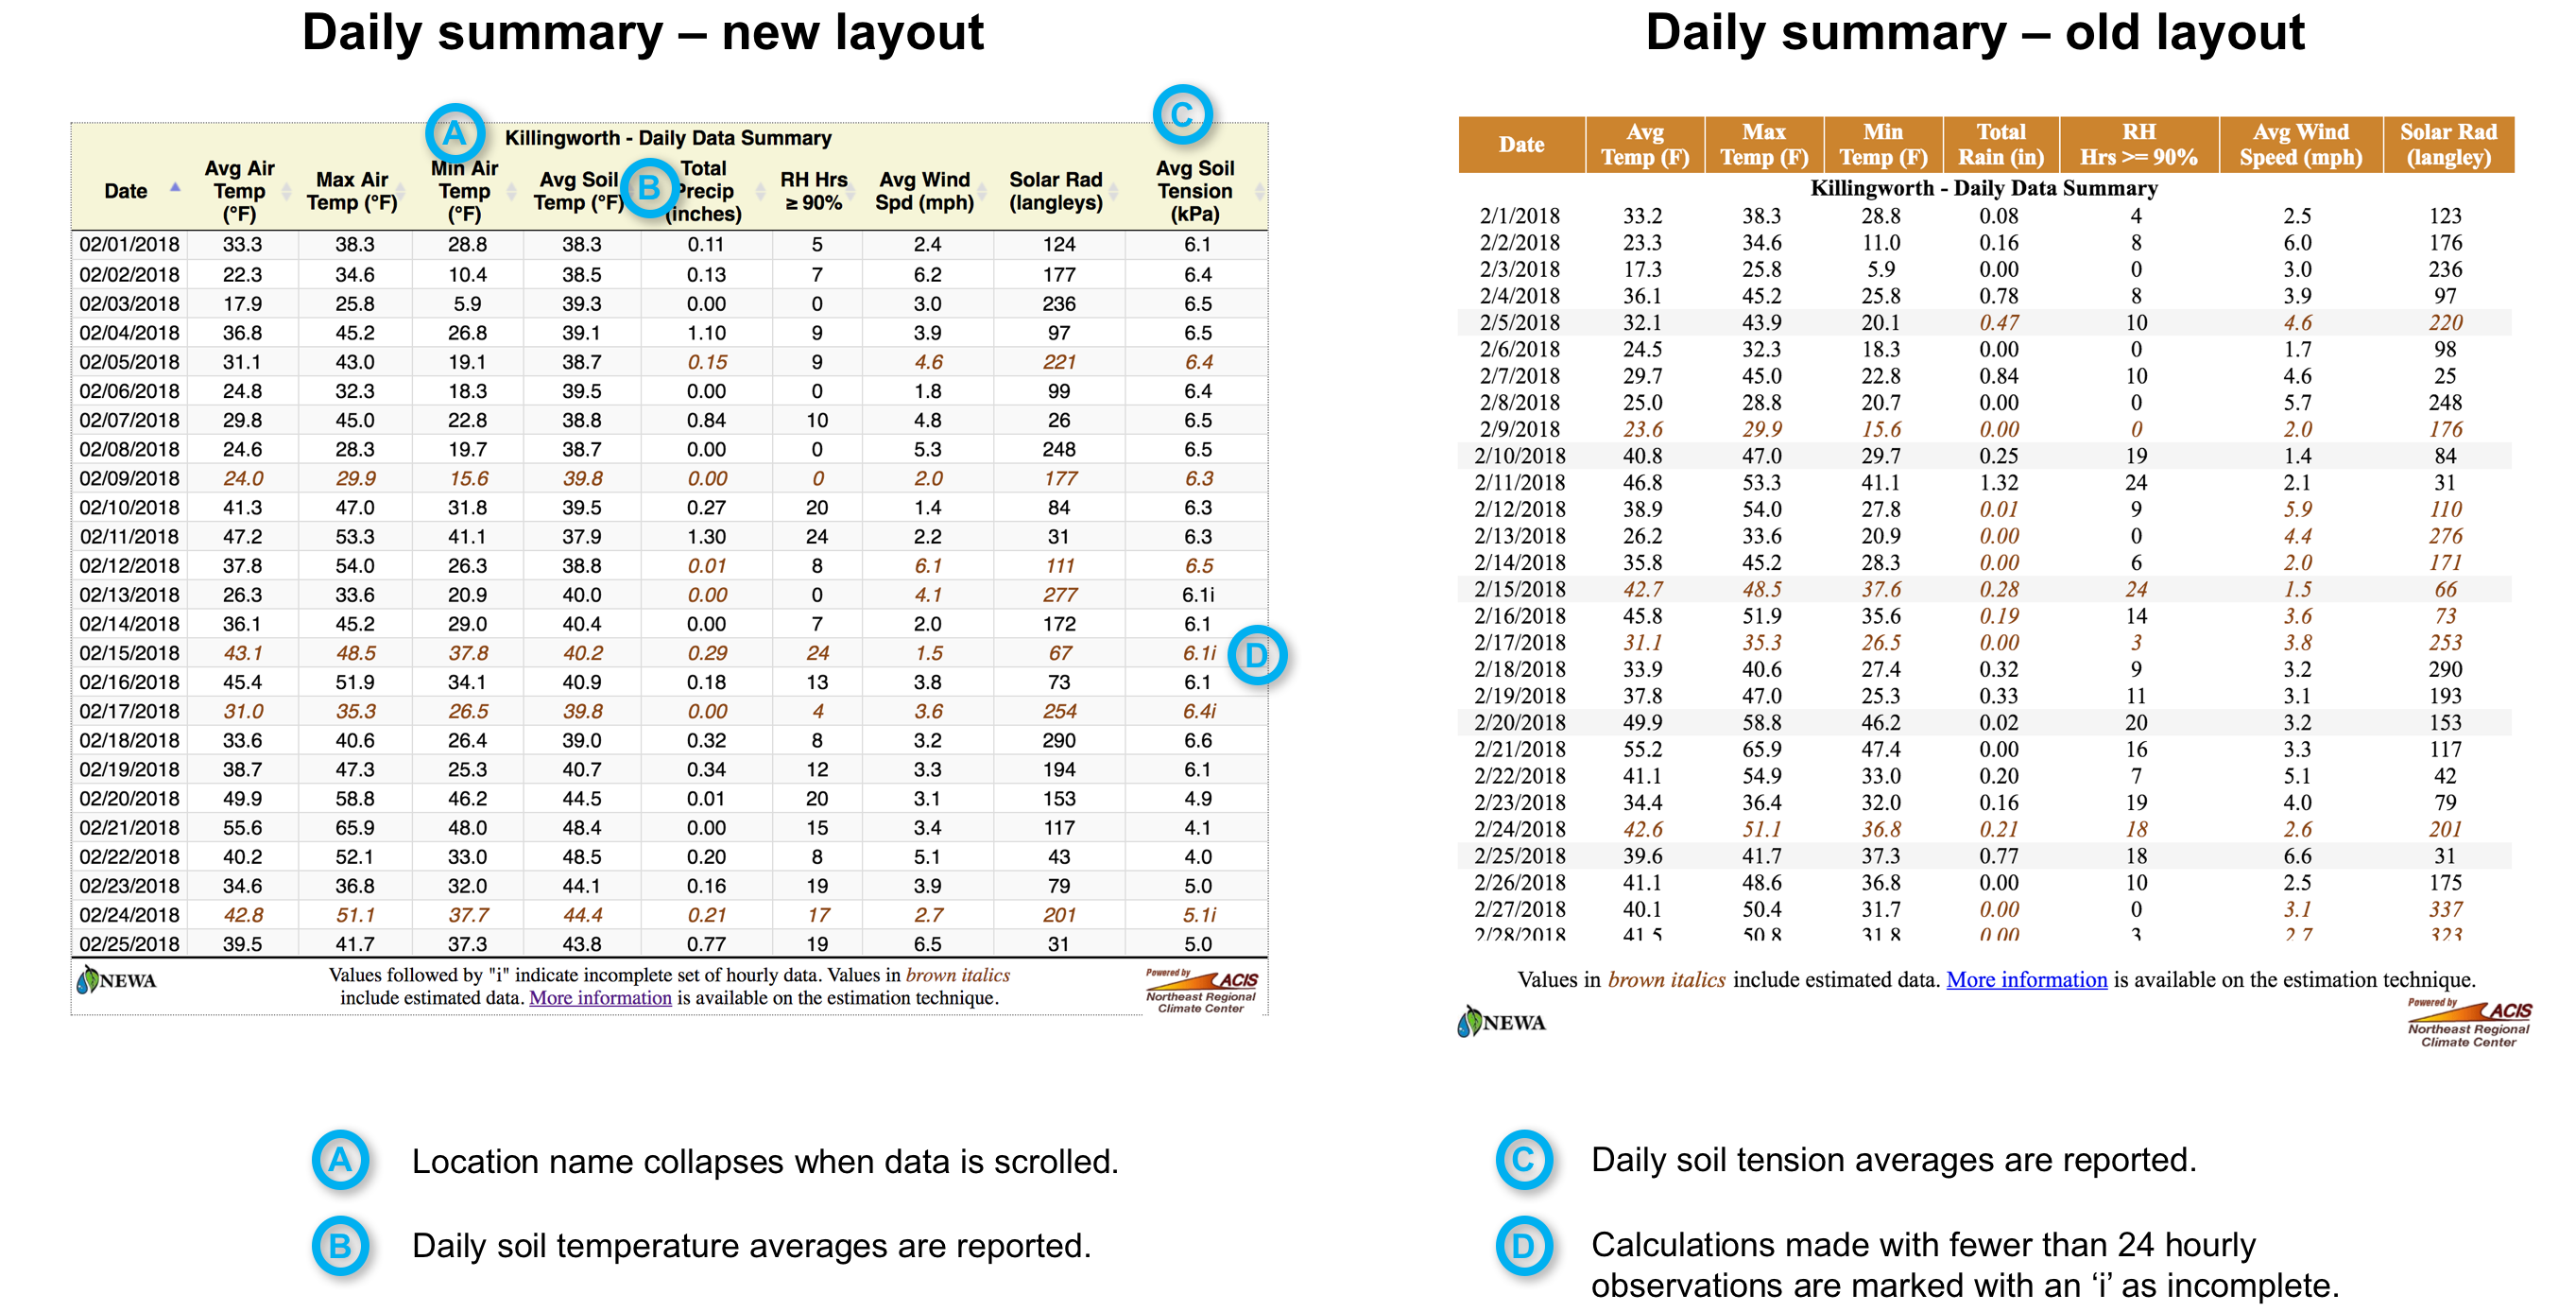
NEWA models need continuous data to provide accurate insect and plant disease risk forecasts. To ensure this continuity, an existing weather station is paired with each new location as a backup data source. Paired data sources are useful when a station is out for extended periods of time for maintenance or calibration. When an instrument is out, onsite conditions are lost unless information from a similar paired location is substituted. Once online, the dataset is ‘patched.’ connecting old information with new. Brown, italicized text is used to indicate substituted data.

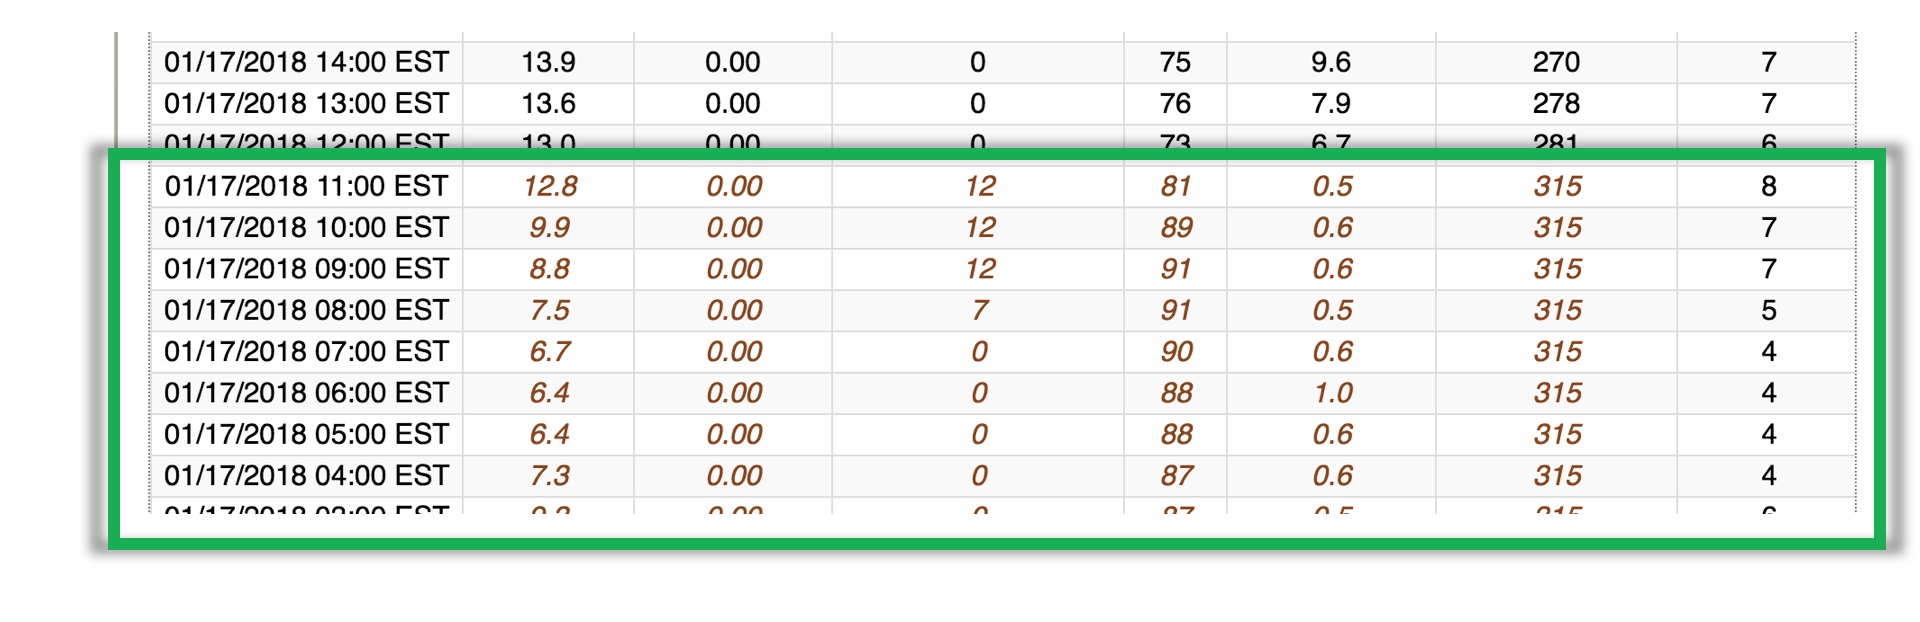
NEWA also uses paired station data when sensors on the primary station fail to report. Sometimes a weather unit is functional but something important like solar radiation malfunctions. Paired station data is substituted for only that sensor while all other data come from the primary instrument.

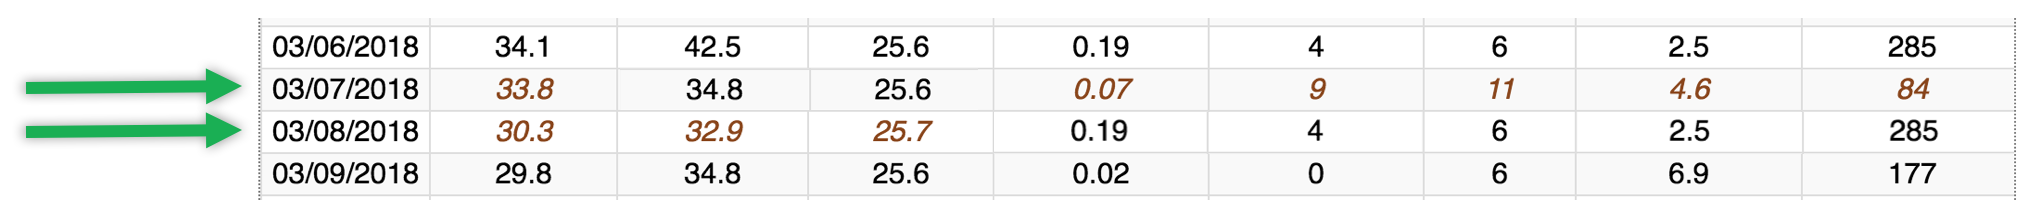
To view paired station information, scroll to the bottom of any hourly or daily data summary and click more information.

New features added to daily and hourly summaries

Hourly and daily data summaries are a popular feature of NEWA. Several updates have been made to improve user experience and deliver enhanced data sets.

Soil data

Certain Rainwise stations collect soil temperature data, soil tension (moisture), or both. NEWA locations linked to instrument panels with these optional sensor add-ons now report calculated hourly and daily values in weather station summary pages. Temperature values are reported in degrees Fahrenheit.  Soil tension is reported in centibars or kilopascals (what is this?).

Calculated soil temperature and tension values are an average of all reported data points within a given period of time. For example, a station set to a 1-minute data collection interval gathers 60 soil temperature readings in 1 hour. The calculated value reported for that time period will be an average of the 60 soil temperature readings.

User interface

Data presented in hourly and daily weather summaries are now presented through an improved user interface (Figure 1, Figure 2). Key features include:

  • Soil temperature and tension reporting (when applicable).
  • Collapsing location name.
  • Sort by column functionality.

Figure 1. New features in hourly weather summaries.

Figure 2. New features in daily weather summaries.

Data quality control

Calculated daily values made using fewer than 24 hourly observations are now marked with an “i” to notify users of an incomplete data set (Figure 2).

Who is using NEWA?

The NEWA online survey closed January 31. So what did we learn? I’m taking a closer look at all 397 responses over the next few weeks to better understand user needs and preferences for the NEWA website. Here is a first-look at survey results.

Participants

We asked for feedback about website functionality, features and impact to evaluate and improve the usability and functionality for growers, NEWA’s the primary users. Sixty-seven% of all respondents self-identified in this category.

Farm size

Eighty percent of grower participants reported average farm area of less than 100 acres. Seventeen percent of growers indicated a farm size of great than 100 acres.

Diversification

Fruit was the most commonly reported commodity among growers, followed by vegetables. A majority of growers focus on single commodity production (55%) but a strong minority (45% have diversified operations, working in two or more commodity categories.

What does this mean for NEWA?

NEWA needs to provide flexibility in the way tools are accessed by growers at newa.cornell.edu. Smaller diversified operations need easy access to fruit and vegetable tools at the same time with minimal time investment. Both small and large single commodity operations need targeted access to specific tools without having to sort through other unrelated models or resources.