Tag Archives: weather

NEWA annual reports are available to the public

NEWA publishes a yearly report for stakeholders. These summaries document NEWA IPM extension to New York State growers along with other users served by NEWA partners. NEWA is a program of the New York State IPM Program which is part of Cornell Cooperative Extension.

A complete listing of annual reports is available here:

Click here for a list of NEWA annual reports

Each NEWA report includes an annual summary of the following:

  • operation and maintenance
  • geographic expansion
  • web use statistics
  • outreach
  • existing model upgrades
  • new model development
  • grants, projects, and initiatives
  • publications

Twenty-one NEWA annual reports are available for download, beginning in 1996 when NEWA was established by NYSIPM. Reports are published in January of each year.

Join our email list to be notified when the 2018 report is released.

Stay informed about NEWA. Click here to get regular updates.
New features added to daily and hourly summaries

Hourly and daily data summaries are a popular feature of NEWA. Several updates have been made to improve user experience and deliver enhanced data sets.

Soil data

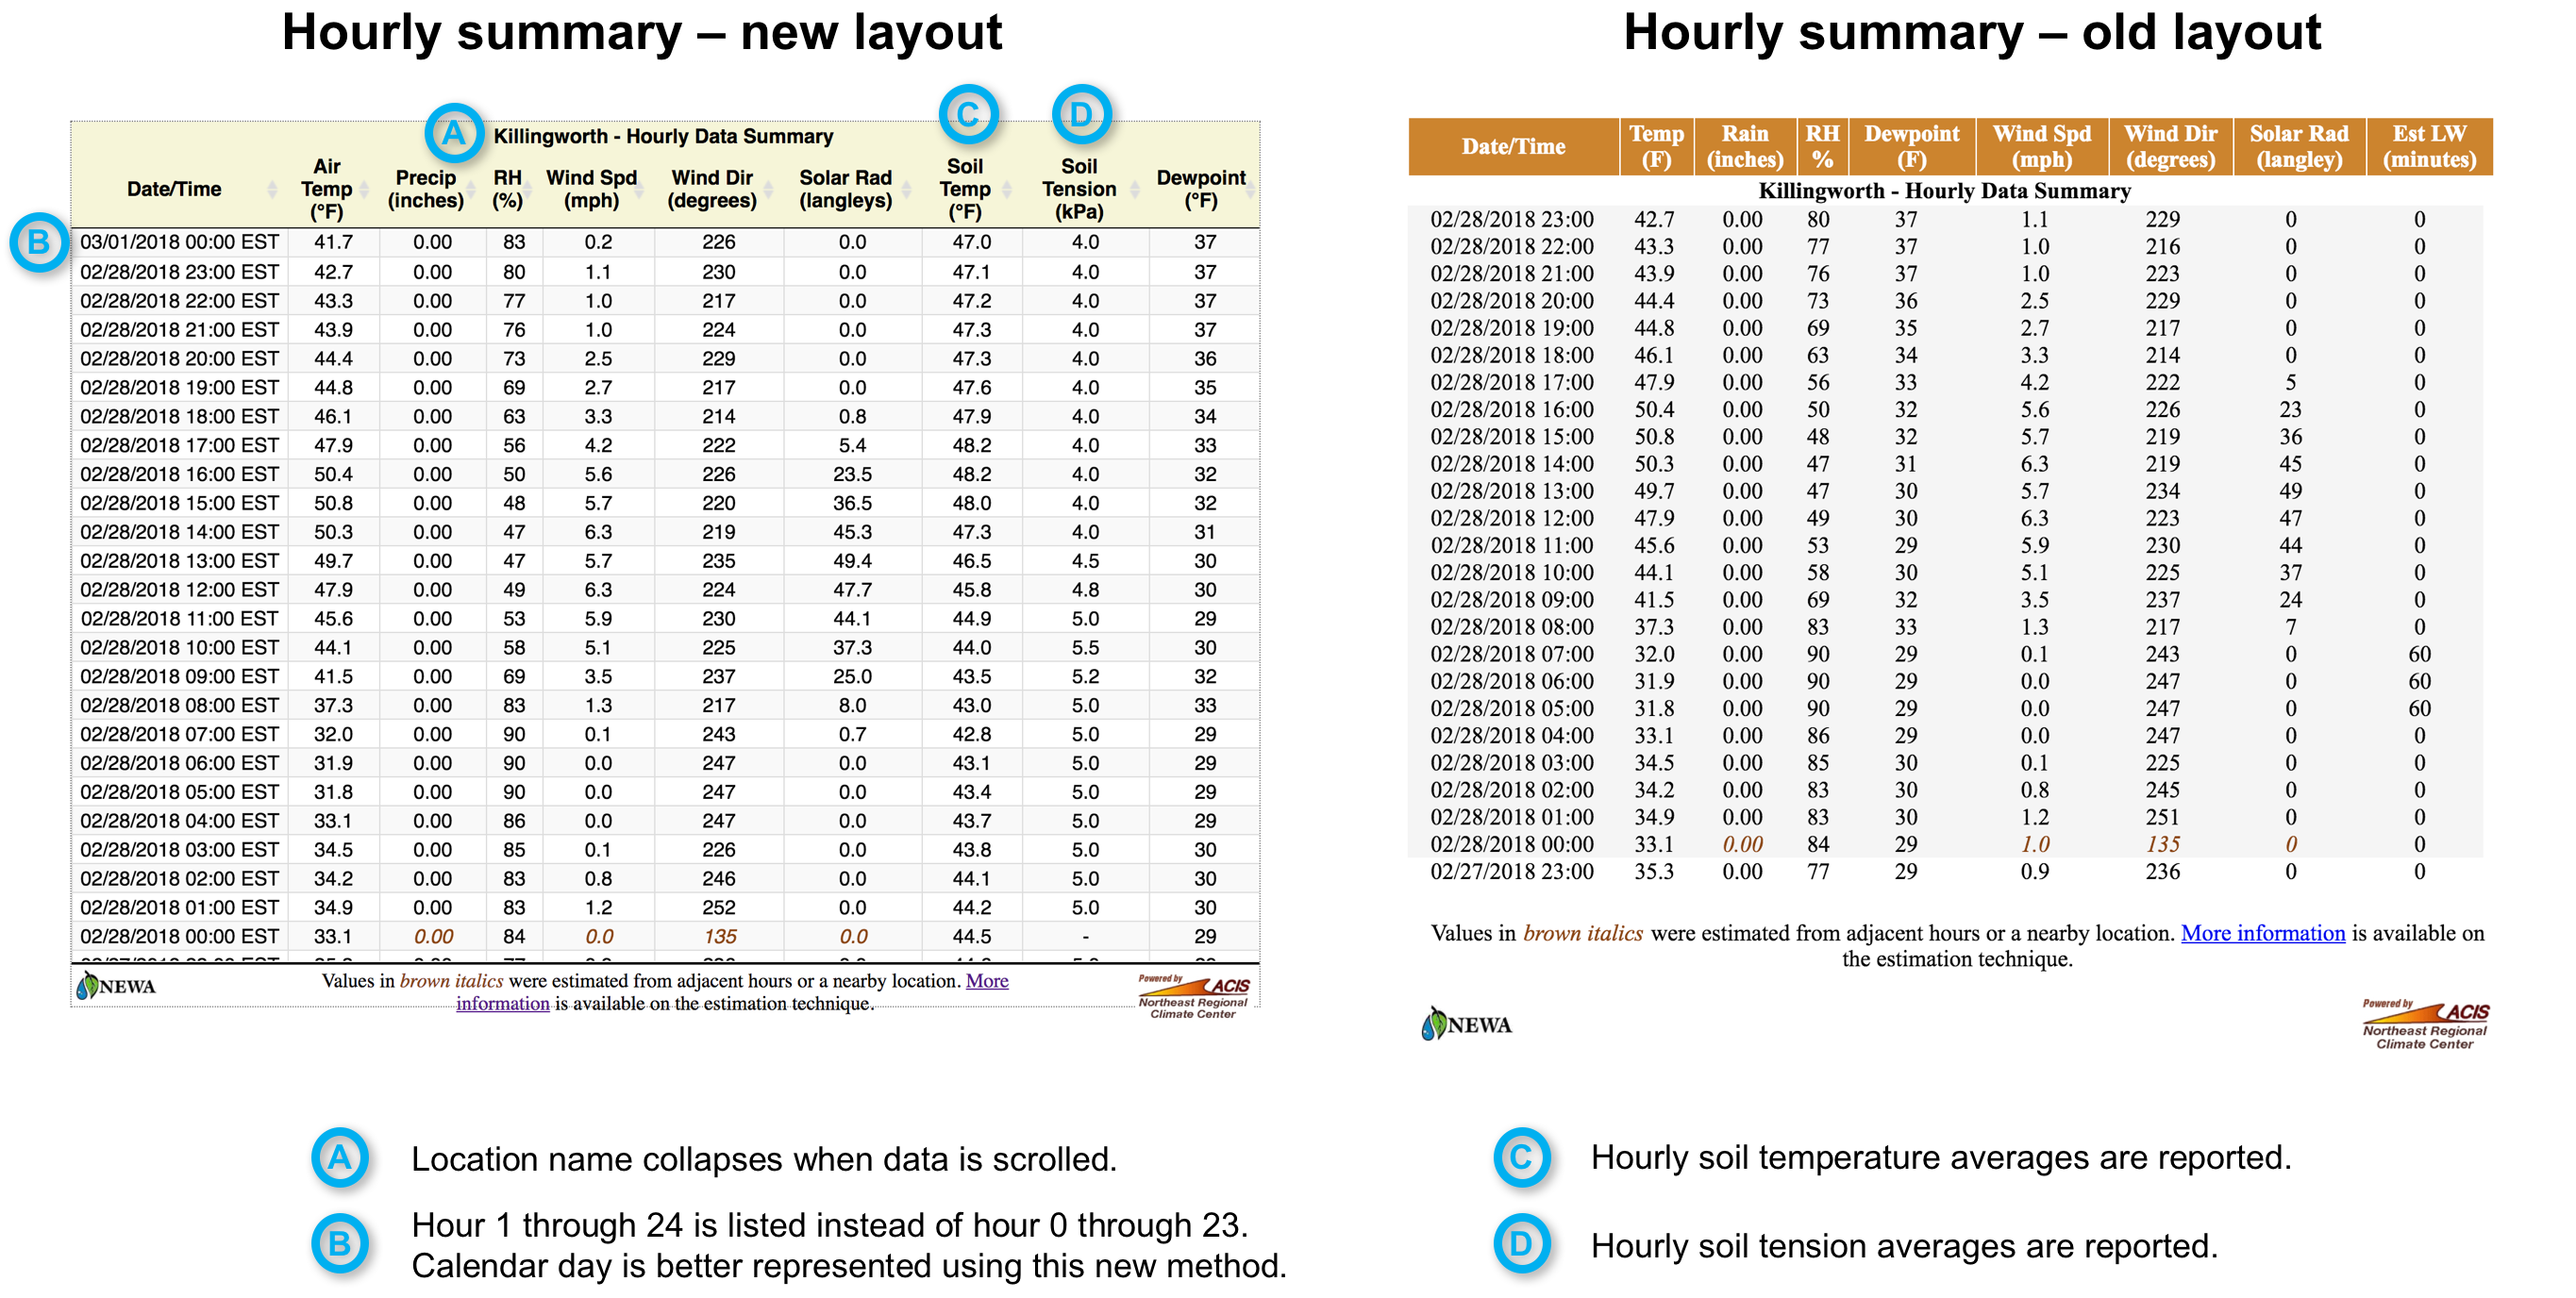
Certain Rainwise stations collect soil temperature data, soil tension (moisture), or both. NEWA locations linked to instrument panels with these optional sensor add-ons now report calculated hourly and daily values in weather station summary pages. Temperature values are reported in degrees Fahrenheit.  Soil tension is reported in centibars or kilopascals (what is this?).

Calculated soil temperature and tension values are an average of all reported data points within a given period of time. For example, a station set to a 1-minute data collection interval gathers 60 soil temperature readings in 1 hour. The calculated value reported for that time period will be an average of the 60 soil temperature readings.

User interface

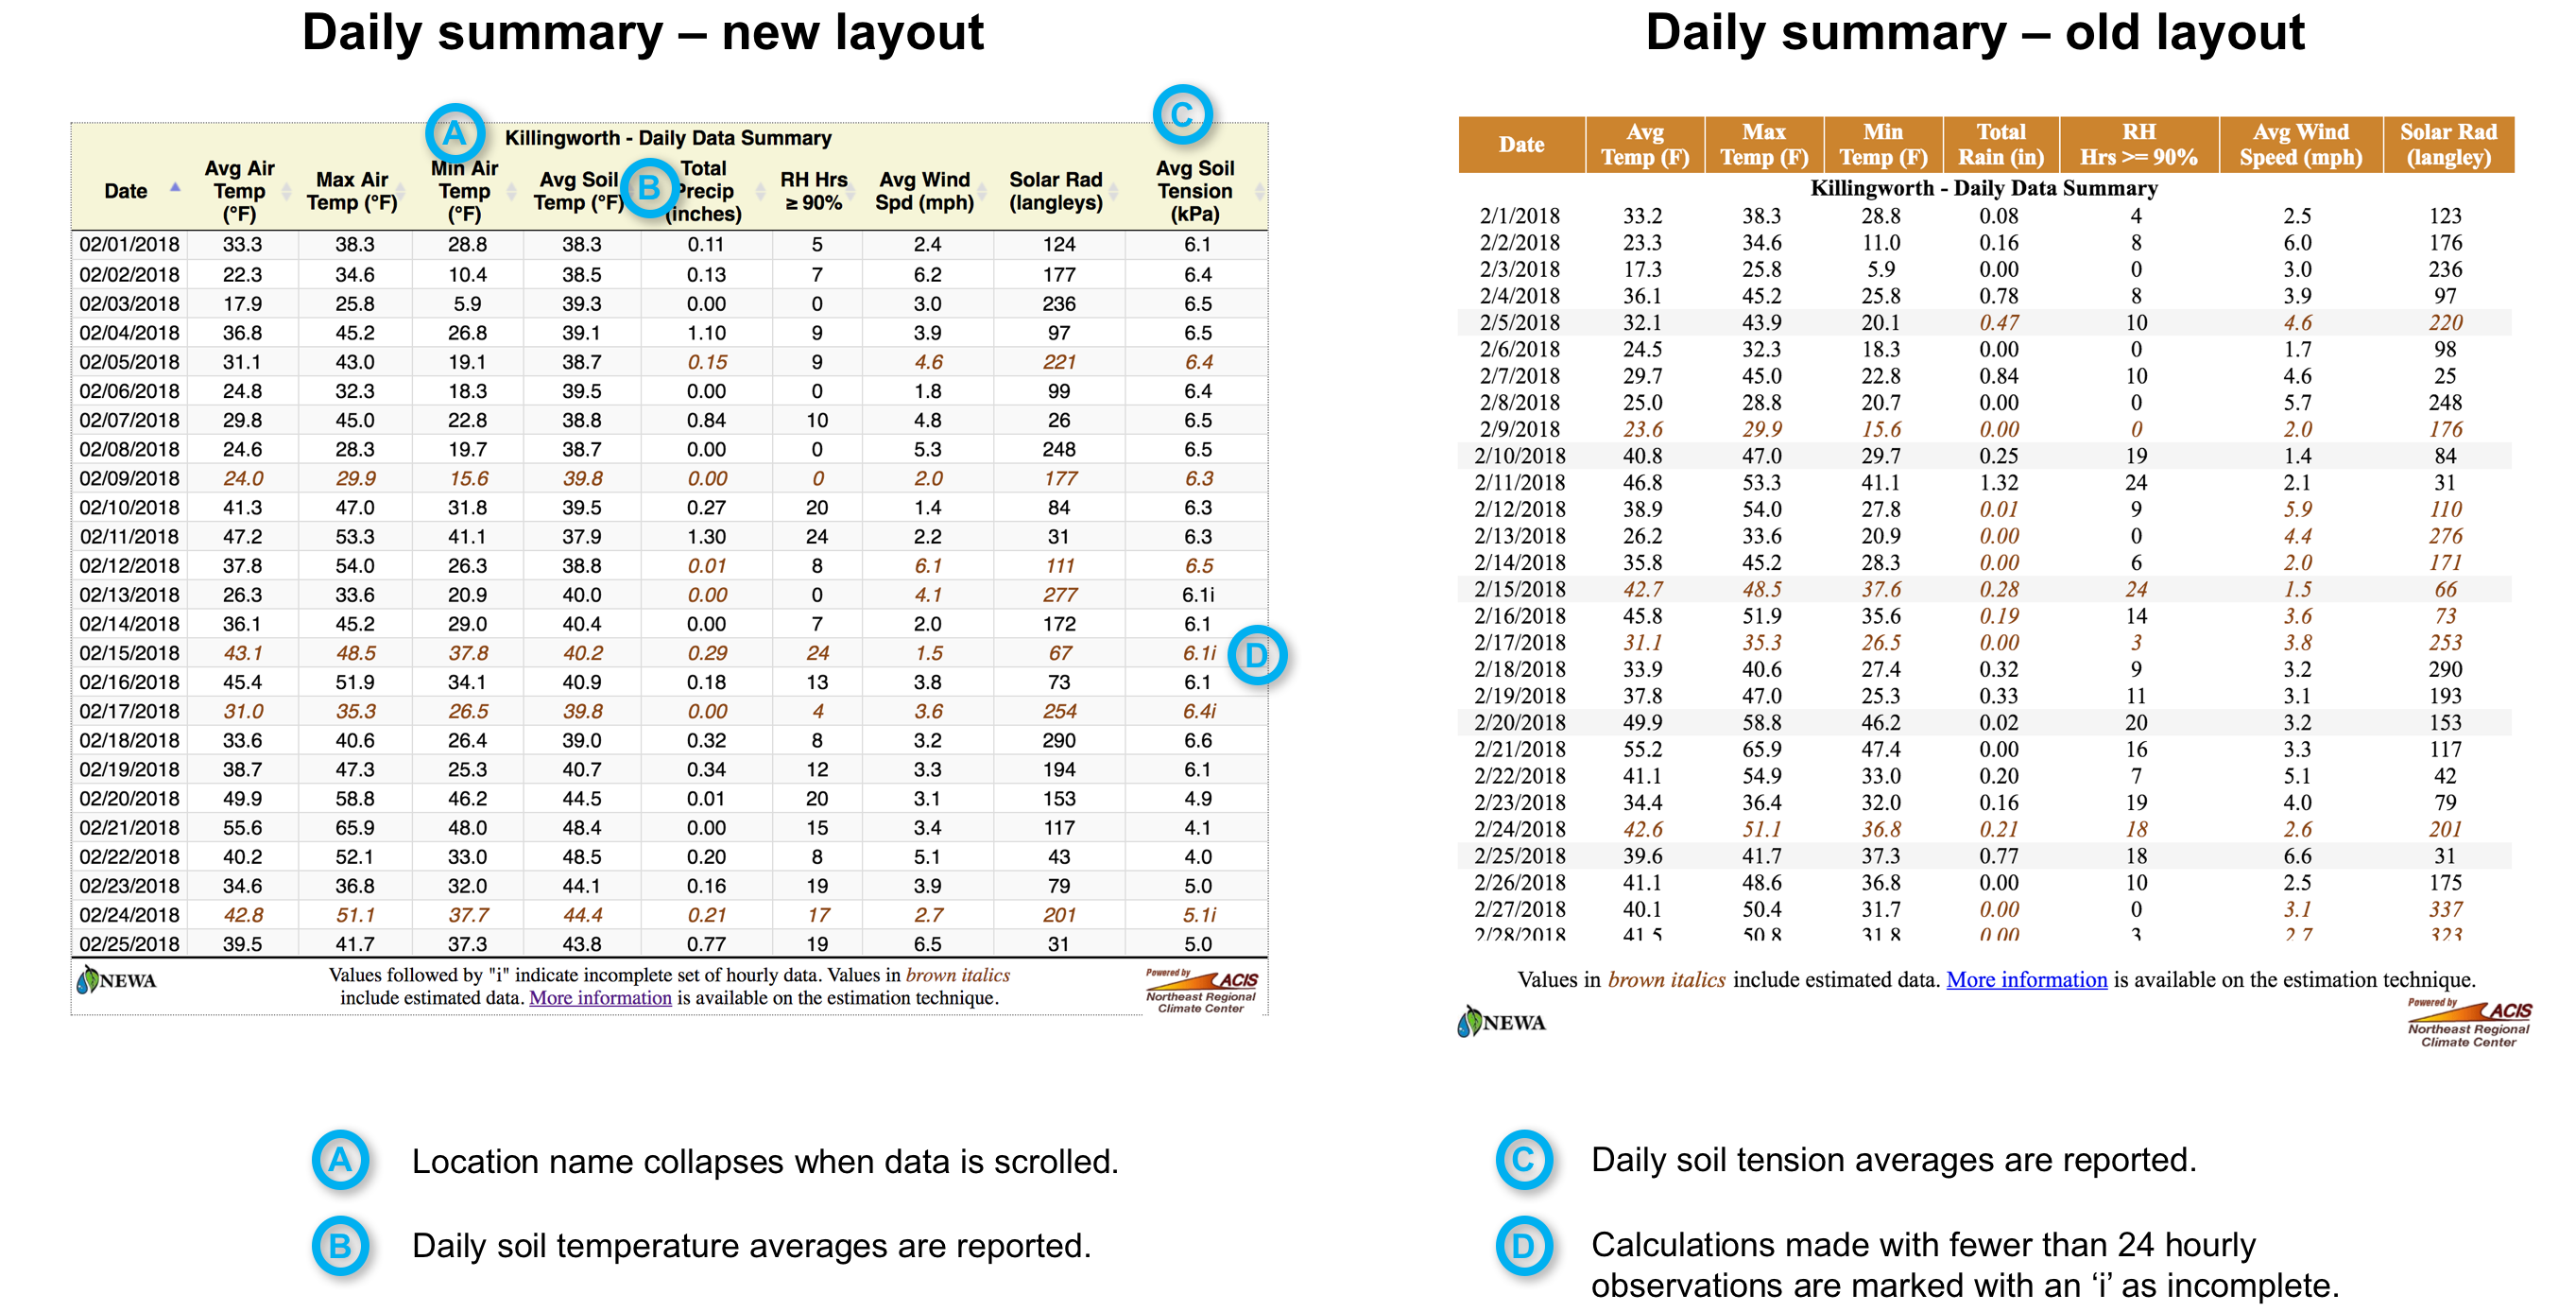
Data presented in hourly and daily weather summaries are now presented through an improved user interface (Figure 1, Figure 2). Key features include:

  • Soil temperature and tension reporting (when applicable).
  • Collapsing location name.
  • Sort by column functionality.

Figure 1. New features in hourly weather summaries.

Figure 2. New features in daily weather summaries.

Data quality control

Calculated daily values made using fewer than 24 hourly observations are now marked with an “i” to notify users of an incomplete data set (Figure 2).