Tag Archives: survey

The 2017 NEWA Survey: discussion and future directions

This is part five in a five-part blog series discussing 2017 NEWA survey results of users and non-users. Download the full report to learn more.

By Dan Olmstead and Julie Carroll

“I would suggest NEWA be a part of any subsidized agriculture. I would like to see the NEWA network as a standard tool of ag…”. – 2017 NEWA user

Survey participants self-identified as NEWA users were asked to share final comments regarding NEWA and ways the platform could be improved in the future. Of the 71 people responding to this question, 23 (32%) stated that NEWA was excellent and thanked us for NEWA. For detailed analysis, download the 2017 NEWA survey.

 Future directions

Results of the 2017 NEWA survey contain a trove of data and information. Final recommendations, based on this information include the following points of importance.

Education and promotion

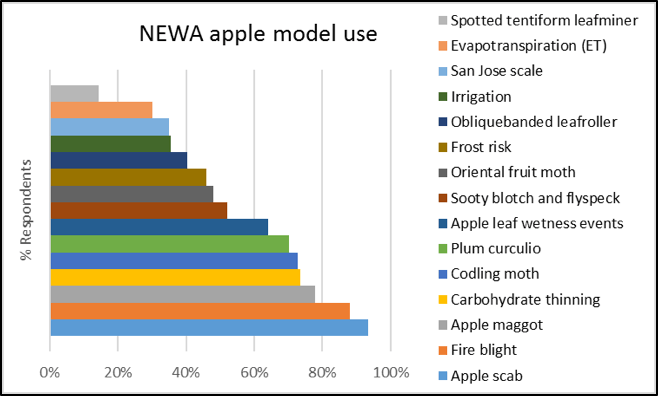
  • At workshops and conferences, promote the high level of trust and reliability growers have in NEWA to categorize pest risk and provide IPM recommendations.
  • Raise awareness among growers that using NEWA can result in better spray timing, significant savings on spray bills, and improved crop protection.
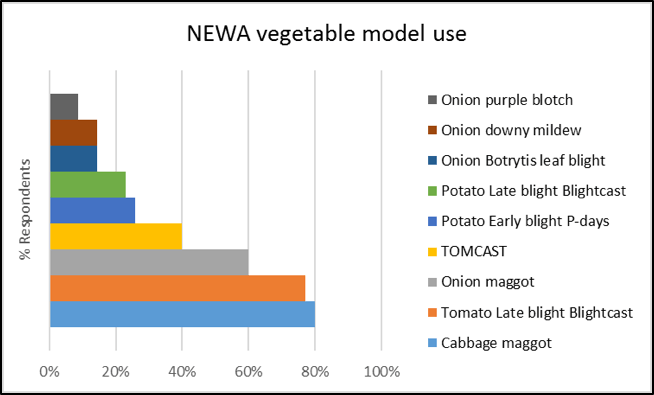
  • A promotion and awareness campaign for NEWA vegetable models and extension education on how to use them is needed, because vegetable production is significant throughout NEWA’s region — however, reported usage is low.
  • A coordinated effort is needed to develop online educational resources for new and existing NEWA users that can be used independently and in workshops and presentations.
  • A well-executed awareness campaign can reach new audiences and should bring new users to NEWA resources, and encourage them to start using the platform.

Future development

  • To expand and enhance NEWA, focus on and recruit future development in the areas of vegetable, ornamental, and field crop production and pest forecast models.
  • Because NEWA weather data products are valued and accessed by all users, develop innovative weather products to attract future NEWA users.

The 2017 NEWA survey: use of models, tools, and resources

This is part four in a five-part blog series discussing 2017 NEWA survey results of users and non-users. Download the full report to learn more.

By Dan Olmstead and Julie Carroll

In the 2017 NEWA survey, participants were asked about NEWA resources used in the prior 12 months. These were organized into categories of weather data, apple, grape, vegetable, crop management, and ‘other’ resources.

Weather data tools

All products were chosen as having been used at similar levels (n=178): degree day tables (70%), daily summaries (67%), hourly data tables (52%), and a degree-day calculator (49%) — only recently developed for NEWA.

Apple models

Apple scab, fire blight, apple maggot, codling moth, plum curculio and the apple carbohydrate thinning models were indicated as used most frequently by respondents (Fig. 1). Use percentages were based on the number of respondents to the model use questions for diseases, insects, and crop management, which were 92, 77, and 76, respectively.

Figure 1. NEWA apple insect and disease model use among current users polled in a 2017 survey.

Grape models

All five grape tools were used at similar frequency among grape growers responding to these questions (n=72): grape berry moth 93%, black rot 83%, powdery mildew 82%, downy mildew 82%, and Phomopsis leaf and cane spot 79%.

Vegetable models

Fewer vegetable than fruit models are available on NEWA. Cabbage maggot and onion maggot models are popular among growers (Fig. 2). Use percentages were based on the number of respondents to disease and insect model questions, which were 35 and 20, respectively. NEWA vegetable tool development is an area for future growth. In addition, promotion and education on how to use existing vegetable tools would increase use.

Figure 2. NEWA vegetable insect and disease model use among current users polled in a 2017 survey.

Other resources

NEWA provides outbound links to other tools and 39% of users access these. Most popular are weather information links such as NOAA radar maps and USDA drought maps, and national platforms such as the late blight USABlight and the iPIPE for Cucumber Downy Mildew. The Stewart’s wilt of sweet corn risk map and the turfgrass disease risk tool were used by very few survey respondents, four and three, respectively. Recent technological advances will allow better integration of these resources and should be considered for development within the NEWA platform.

Up next: NEWA website end-user needs and experience

Who is using NEWA?

The NEWA online survey closed January 31. So what did we learn? I’m taking a closer look at all 397 responses over the next few weeks to better understand user needs and preferences for the NEWA website. Here is a first-look at survey results.

Participants

We asked for feedback about website functionality, features and impact to evaluate and improve the usability and functionality for growers, NEWA’s the primary users. Sixty-seven% of all respondents self-identified in this category.

Farm size

Eighty percent of grower participants reported average farm area of less than 100 acres. Seventeen percent of growers indicated a farm size of great than 100 acres.

Diversification

Fruit was the most commonly reported commodity among growers, followed by vegetables. A majority of growers focus on single commodity production (55%) but a strong minority (45% have diversified operations, working in two or more commodity categories.

What does this mean for NEWA?

NEWA needs to provide flexibility in the way tools are accessed by growers at newa.cornell.edu. Smaller diversified operations need easy access to fruit and vegetable tools at the same time with minimal time investment. Both small and large single commodity operations need targeted access to specific tools without having to sort through other unrelated models or resources.