The NEWA tools for apple IPM and crop production are designed so that anyone can enter the relevant crop growth stage or insect trap date to run the model in real time (or historically, to see what happened last year).
Of special interest among tree fruit growers now is the apple scab forecast tool. This needs a green tip date, specifically 50% green tip on ‘McIntosh’, to start the ascospore maturity model. Several end-users have weighed in on the “estimated” green tip date that shows up. “Never been right, as far as I’ve seen.” “It’s way off this year; things are about two weeks early.” “Why do I have to enter it every time?” Agreed, the green tip date is only a rough estimate, and, it doesn’t go into a cache. It’s important for you to enter your orchard’s green tip date, preferably from a ‘McIntosh’ orchard.
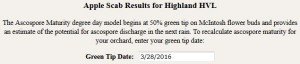
Snippet off the Apple Scab tool showing the top of the Results page where you need to enter the green tip date.
Make sure you enter your green tip date for your farm when using the NEWA apple scab tool. Click in the white box next to “Green Tip Date:” and select the date from the calendar that pops up. This will improve the accuracy of the ascospore maturity model, which begins at green tip.
We developed a list of the biofix dates you’ll need to most accurately run the available NEWA apple tools:
- Green Tip (50%) for apple scab and carbohydrate thinning tools
- First Blossom Open for the fire blight tool
- Bloom (50%) for the carbohydrate thinning tool
- 90% Petal Fall for the plum curculio tool
- Oriental Fruit Moth (OFM), first trap catch, for the OFM tool
- Codling Moth (CM), first trap catch, for the CM tool
- Obliquebanded Leafroller (OBLR), first trap catch, for the OBLR tool
- Apple Maggot (AM), first trap catch, for the AM tool
We’re thinking of blanking the estimated biofix dates in 2017. What do you think? Email me: jec3@cornell.edu. We’d like to cache biofix dates. Unfortunately, all the grants we’ve written to do that haven’t been funded.
What about the infection events? The Infection Events Summary table provides a perspective on the risk of infection over the previous two days, the current day and the 5-days into the future, based on the National Weather Service forecast. Comparing this to the level of ascospore maturity in the Ascospore Maturity Summary table helps delineate the risk level. Below the Infection Events Summary is the log of the Apple Scab Infection Events starting on March 1 and logging events through October 30 each year.
Some things to keep in mind when managing apple scab—environment, host, pathogen:
- The NEWA apple scab tool models the impact of the environment on pathogen development.
- Apples vary in their susceptibility to infection, with the “sweet spot” for Venturia inaequalis infection being from tight cluster through petal fall. So watch out for infection events occurring during these growth stages when the plant tissue is highly susceptible!
- Apples varieties vary in their susceptibility to apple scab. For instance, ‘McIntosh’ is most susceptible, whereas ‘Honeycrisp’ is less susceptible to infection. A lower, labeled rate of a fungicide might be possible on less susceptible cultivars.
- Overwintering inoculum in leaf litter. Practicing sanitation with leaf mulching in fall or spring using a flail mower or urea sprays (40 lb/A) directed at leaf litter can reduce the overwintering inoculum by about 55%.
So remember to keep track of your biofix dates and enter them whenever you use the NEWA tools. Jot them down on a card that’ll fit with your smart phone or, better yet, write them in the Notes app on your phone, so you can check the NEWA apps and enter your biofix dates wherever you might be.