Measuring rainfall is of crucial importance in agriculture. That is why most farmers have stand-alone, manual rain gauges plus a Rainwise weather station connected to NEWA. Comparing measurements of precipitation between a manual rain gauge and the data being collected by your weather station for your site is a good habit to get into. Automated tipping bucket rain gauges are calibrated by the manufacturer but, after two or three years in service, they can drift in calibration. Rainwise tipping bucket rain gauges have an accuracy rating of 2% at 1.5” per hour. This means that the difference between the amount of rain collected by the manual rain gauge and the amount recorded by the Rainwise tipping bucket rain gauge for the same time period should be no more than 2%. Calibration drifts in tipping buckets can lead to errors of 5%, possibly as high as 10%. If your tipping bucket rain gauge is collecting less than 90% of what your manual gauge is collecting, there is likely a clog in the tipping bucket collector.
Manual rain gauges– Plastic rain gauges that have a 4 inch diameter opening at the top to catch rain are quite accurate. The National Oceanic and Atmospheric Association (NOAA) weather observer network, uses manual rain gauges with an 8 inch diameter opening. These are considered the most accurate, but are also more expensive. Check to see what the size of the opening of your manual rain gauge is. Although the kind that are given away free at farm shows are not usually 4-inch-diameter gauges, they are still relatively accurate. Accuracy of the manual rain gauges is, of course, user-dependent – as accurate as the person checking the gauge, recording the data, emptying it, and resetting it.
Tipping bucket rain gauges– The Rainwise 8″ diameter collector meets National Weather Service (NWS) specifications for statistical accuracy. Water drains through the screen in the collector into the tipping bucket underneath. As the water fills the tipping bucket, it tips back and forth like a teeter totter and the water empties out on one side and then the other. Each tip of the tipping bucket underneath the black collector is counted by a reed switch calibrated to record 0.01 inch (=0.25 mm) of rain. The tipping bucket is made of specially formulated plastic for low surface tension to give quick and complete drain off of the collected rain.
Tipping bucket rain gauges have two flaws, so to speak. One is they do not operate well or at all with frozen precipitation. The other is they under-catch during extremely heavy rainfall, i.e. those when over 1.5 inches of rain fall in an hour, because the tipping arm cannot keep up with the flow of rain through the bucket. This can lead to measured precipitation over a longer time span than the actual rain event. The under-catch may disappear when the weather data is compared to manual rain gauges over longer time periods, compare 1-minute interval data to 15-minute interval or hourly data to daily data.
The nice thing about the tipping bucket rain gauge is that it logs the data to a computer and you don’t have to remember to check it, empty it and reset it. Plus the data can be used in NEWA’s online tools!
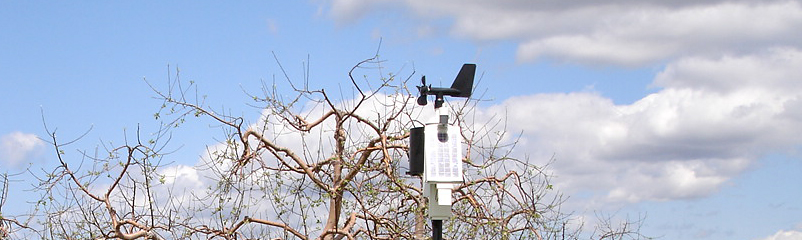
Pitfalls of rain measurement– Regardless of whether you use a manual rain gauge or a tipping bucket rain gauge, both are prone to error when rain is driven by strong winds, such as in hurricanes and tropical storms. In addition, the site in which the rain gauge is placed can impact accuracy. As a general rule, the windier the gauge location is, the greater the precipitation measurement error will be. Details about siting weather stations can be found on the NEWA website. A rain gauge should be placed in a location that is protected in all directions, but with excellent exposure to air movement, such as an opening in a grove of trees. The height of the protection should not exceed twice its distance from the gauge. Avoid locations close to obstructions such as buildings, trees, orchard and vineyard rows, which could deflect precipitation due to erratic turbulence. Don’t locate gauges in wide open spaces or on elevated sites, such as the tops of knolls, to avoid wind and resulting turbulence problems.
Errors and anomalies– Below are issues we have seen in tipping bucket data collected by rain gauges connected to NEWA. If you notice erroneous data, tell us about it and we’ll remove it from your data archive.
Rainfall data not collected – There are four issues that can cause the system to not collect rainfall data:
(1) The rain gauge is clogged – time to clean it!
(2) The cotter pin holding the screen is loose and obstructing the tipping arm – an easy fix!
(3) The reed switch is faulty, conceivable if the instrument has been in service for over three years; the reed switch is guaranteed for one year – replace the switch.
(4) There is an issue with the motherboard – check with Rainwise Tech Support.
Rainfall of 0.01 here and there… Random, trickling rain of 0.01 to 0.02 inches logged every hour or two, over a 24-hr period. Three things come to mind in this case:
(1) A clogged tipping bucket rain gauge can lead to random measurements of 0.01 inches of rain as the clogged rain water slowly drains down through the clog. John Gibbons, retired NEWA Technician, has seen this many a time. A simple thing to check.
(2) The station may not be mounted well, allowing for some sway. If you can physically make the station wiggle by hand, a 20 mph wind will DEFINITELY move it, causing occasional wind counts. Good steps are to look at the data and see if the counts are associated with wind gusts. Secure the station so no sway occurs in wind.
(3) A less common issue in this scenario is a faulty reed switch.
Insane amounts of rainfall recorded – If a large amount of precipitation is logged, say 5 inches when it clearly hasn’t rained a drop or perhaps only drizzled, usually boils down to one of two things:
(1) Failed reed switch that is shorted out – replace the switch.
(2) Cross communication from another station. Even if the neighboring station is somewhat farther than the average transmission range, interference may occur when certain environmental conditions help the radio wave signal travel. Reports have come in of 1-mile-range stations affected by a station 2 miles away.
Maintaining your rain gauge– The tipping bucket gauge has a small drain, by definition. Leaves, moss, algae, pollen, and debris can cause clogging of the tipping bucket screen and drain at the base of the collector. We recommend regular cleaning of your rain gauge (at least 1-2 times per year). The cleaning interval really depends on the location – some might go for a year or two with no issues, others might have to be cleaned every three months. Decaying leaves, bud scales, seeds, etc. created the mold and goo. At a minimum you need to make sure that there are no leaves in the collector and the drain hole is clear. Consult NEWA’s weather station maintenance guidelines.
To clean a clog from the tipping bucket on your RainWise weather station, start by turning off the weather station. Loosen the 4 screws holding the bucket to the base of the rain gauge and twist counter-clockwise to remove it. Straighten the cotter pin legs holding the screen, pull the cotter pin out, remove the screen, and clear the drain hole.You can clean the collector and tipping bucket with warm soapy water if necessary. Make sure you rinse it well afterwards. When putting it back together, if the cotter pin legs hang down inside the bucket collector, they may interfere with the tipper mechanism. The cotter pin legs MUST be bent up so they don’t interfere with the tipper. Remember to turn the weather station back on after cleaning.
Dealing with fauna– Wasps may build nests in tipping bucket rain gauges. A small piece of vapona strip set underneath the collector may be used as a deterrent. Birds may find the location of the tipping bucket a nice perch to look out over their territory. If you’ve been having issues with birds perching on your rain gauge and dropping seeds into it, try installing bird spikes. These won’t interfere with rain collection. A universal bird spike kit is being offered now as the perfect Father’s Day gift by ambient weather! (No intent to exclude other vendors is implied or expressed.)
 We’d like to acknowledge the New York State Apple Research and Development Program for funding our workshops for the apple growers in NY and making it possible to create the Troubleshooting Guide and associated web pages that are now available to everyone connected to NEWA across the Eastern US.