This is part four in a five-part blog series discussing 2017 NEWA survey results of users and non-users. Download the full report to learn more.
By Dan Olmstead and Julie Carroll
In the 2017 NEWA survey, participants were asked about NEWA resources used in the prior 12 months. These were organized into categories of weather data, apple, grape, vegetable, crop management, and ‘other’ resources.
Weather data tools
All products were chosen as having been used at similar levels (n=178): degree day tables (70%), daily summaries (67%), hourly data tables (52%), and a degree-day calculator (49%) — only recently developed for NEWA.
Apple models
Apple scab, fire blight, apple maggot, codling moth, plum curculio and the apple carbohydrate thinning models were indicated as used most frequently by respondents (Fig. 1). Use percentages were based on the number of respondents to the model use questions for diseases, insects, and crop management, which were 92, 77, and 76, respectively.
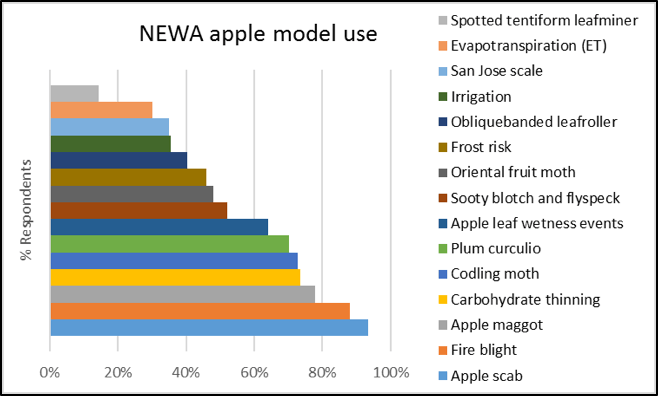
Figure 1. NEWA apple insect and disease model use among current users polled in a 2017 survey.
Grape models
All five grape tools were used at similar frequency among grape growers responding to these questions (n=72): grape berry moth 93%, black rot 83%, powdery mildew 82%, downy mildew 82%, and Phomopsis leaf and cane spot 79%.
Vegetable models
Fewer vegetable than fruit models are available on NEWA. Cabbage maggot and onion maggot models are popular among growers (Fig. 2). Use percentages were based on the number of respondents to disease and insect model questions, which were 35 and 20, respectively. NEWA vegetable tool development is an area for future growth. In addition, promotion and education on how to use existing vegetable tools would increase use.
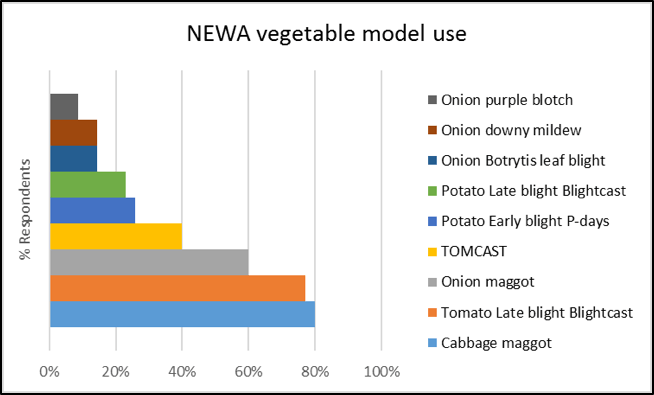
Figure 2. NEWA vegetable insect and disease model use among current users polled in a 2017 survey.
Other resources
NEWA provides outbound links to other tools and 39% of users access these. Most popular are weather information links such as NOAA radar maps and USDA drought maps, and national platforms such as the late blight USABlight and the iPIPE for Cucumber Downy Mildew. The Stewart’s wilt of sweet corn risk map and the turfgrass disease risk tool were used by very few survey respondents, four and three, respectively. Recent technological advances will allow better integration of these resources and should be considered for development within the NEWA platform.
Up next: NEWA website end-user needs and experience