Controlling Herbicide Resistant Weeds in Soybeans: 2019 Trials

Project Leaders: Bryan Brown, NYS IPM Program; Venancio Fernandez, Bayer Crop Sciences; Mike Hunter, Cornell Cooperative Extension; Jeff Miller, Oneida County Cooperative Extension; Mike Stanyard, Cornell Cooperative Extension

Collaborators: Dan Conable, Preferred Quality Grain LLC; Jaime Cummings, NYS IPM Program; Antonio DiTommaso, Cornell University; Quentin Good, Quentin Good Farms; Clinton van Hatten, Flowing Spring Farm; Kathleen Howard, Cornell University; Julie Kikkert, Cornell Cooperative Extension; Chuck Kyle, Preferred Quality Grain LLC; Grace Marshall, NYS IPM Program; Scott Morris, Cornell University; Ali Nafchi, Cornell Cooperative Extension; Jodi Putman, Cornell Cooperative Extension; Joshua Putman, Cornell Cooperative Extension; Emily Reiss, Kreher Family Farms; Matthew Ryan, Cornell University; Lynn Sosnoskie, Cornell University; Ken Wise, NYS IPM Program

Summary:
Herbicide resistant weeds have become a major problem for New York soybean farmers. This project aimed to regain control of these weeds through a mix of chemical, physical, and electrical tactics. From our replicated field trials attempting to control waterhemp in soybeans, the programs that included herbicides from WSSA groups 4, 14, or 15 were most effective, and our only treatment that provided 100% control included all three of those groups. Row cultivation performed well between-rows but missed some in-row weeds. Soybean yields generally reflected the effectiveness of each weed control treatment, with untreated plots incurring a 56% yield loss. Unfortunately, the most effective two-pass treatments were also the most expensive. In a separate demonstration, our informal evaluation of an electric discharge system was successful, with most of the herbicide resistant horseweed (marestail) exhibiting complete necrosis two weeks after application.

Background and justification:
In the past few years, herbicide resistant weeds have become a large problem for New York soybean farmers (Figure 1). Horseweed that is likely resistant to glyphosate (WSSA 9) and ALS inhibitor (WSSA 2) herbicides has spread through much of the state. Herbicide resistant waterhemp, which was initially found in a few isolated cases where farms had purchased contaminated inputs or equipment from other states, has now been observed in 12 counties. Waterhemp is more competitive than horseweed and based on our initial greenhouse spray chamber trials, it is likely resistant to glyphosate, ALS inhibitors, and photosystem II inhibitors (WSSA 5). In Seneca County NY, waterhemp was reported to have caused 50% yield loss in a field where the farmer had attempted to control it with several different herbicide applications.

Control of weeds that have exhibited herbicide resistance in other states has been improved by adding more herbicide sites of action, or WSSA groups, to the spray mixes – especially if more than one effective herbicide group is used – such as synthetic auxins (WSSA 4), PPO Inhibitors (WSSA 14), or long chain fatty acid inhibitors (WSSA 15). There has also been an increased emphasis on residual herbicide applications to decrease the burden on the post-emergence applications. Furthermore, due to the extended emergence period of waterhemp, residual chemistries are recommended additions to post-emergence applications.

Beyond the diversification of herbicides, non-chemical tactics are also necessary. Horseweed and waterhemp emerge from very small seeds and are susceptible to physical control through tillage/cultivation or suppression by cover crop residue. Due to the short longevity of both species’ seeds in soil, weed seedbank manipulation, sanitation, and practices that limit seed dispersal are also effective. In response to herbicide resistant weeds, one tactic that has been gaining in popularity in the last few years is the use of electrical discharge systems, which involve a front-mounted rod charged by a PTO-powered generator that is driven over the crop to electrocute weeds that escaped earlier controls.

In an attempt to regain control of these herbicide-resistant weeds in New York, we evaluated several strategies that integrated chemical, physical, and electrical tactics.

Objectives:
Objective 1. Evaluate the effectiveness of several different programs for controlling waterhemp in soybeans.

Objective 2. Evaluate the potential for an electrical discharge system to control weeds that survived prior chemical control efforts in soybeans.

Weeds in soybean field
Figure 1. Waterhemp competing with soybeans at a farm in Seneca County, NY.

Procedures:
Objective 1.

Two trial sites were established. Site A was in Seneca County, NY on a field of Odessa silt loam soil where waterhemp had survived various herbicide applications and produced seed in 2018. In 2019, the ground was prepared for planting with a field cultivator on May 22, and planted with soybeans (Channel 2119R2X, maturity group 2.1) on May 24. Pre-emergence applications were made on May 27. Post-emergence treatments were applied on July 8. All treatments are listed in Table 1. For fertilizer, muriate of potash (0-0-60, 125 lbs K2O/A) was applied prior to tillage and urea nitrogen (46-0-0, 100 lbs N/A) was broadcast on July 12.

Table of herbicides for use in soybeansSite B was in Oneida County, NY on a field of Conesus silt loam soil where a large patch of waterhemp had escaped herbicide applications and was hand removed the previous year. In 2019, soybeans (Asgrow 19×8, maturity group 1.9) were planted no-till on May 22 immediately followed by pre-emergence applications. Post-emergence treatments were applied July 5. All treatments listed in Table 1 except for treatments 4 and 8 were implemented at Site B. For fertility, muriate of potash (0-0-60, 120 lbs K2O/A) was applied prior to planting and starter fertilizer added 20 lbs N/A, 60 lbs P2O5/A, and 20 lbs K2O/A.

Plots were 25’ long and 10’ wide. Each treatment was replicated four times per site in a randomized complete block design. Spraying was conducted using a backpack CO2 sprayer with a 10’ boom. Spray volume was 20 gal/A applied at 40 psi. Row cultivation was achieved using a Double Wheel Hoe (Hoss Tools) with two staggered 6” sweeps (12” effective width). Two passes were made per row so that 24” of the 30” rows were cultivated.

Weed control was assessed in mid-August by collecting all aboveground weed biomass within a 2 ft2 quadrat. The quadrat was used four times per plot, placed randomly in the two middle rows of each plot. Weeds were placed in paper bags and dried at 113 degrees F for 7 days, then weighed. Control was calculated by subtracting the biomass of each treated plot from biomass of the untreated plots, dividing by the biomass of the untreated plots, and multiplying by 100. All waterhemp was manually removed immediately after the weed control assessments in order to prevent it from producing seeds.

Soybean yield was measured in mid-October by hand harvesting the pods from 10-row-feet of a middle row of each plot. Beans were separated from pods and collected using an Almaco thresher, then weighed. Yield loss in the treatments with single herbicide sites of action was determined by comparison to the more extensive treatments (Treatments 6-13). Yield loss of Treatment 11 was determined by comparison to the other extensive treatments. To provide an economic basis for comparison of each treatment, costs were estimated based on personal communications with several local custom applicators.

Objective 2.

In 2019, a 20-foot-wide electrical discharge system (“Weed Zapper ANNIHILATOR 8R30,” Old School Manufacturing LLC) was used in Cato, NY on August 1 in a soybean (R1) field with several different weed species that had survived an earlier herbicide application and were protruding up to 2’ above the crop canopy. The tractor was operated at 3 mph with 1000 rpm PTO speed, allowing the electrical discharge system to generate about 500 volts and up to 200 amps of alternating current electricity. Weed mortality was not evident on the day of implementation, therefore we returned on August 13 to informally assess control.

Results and discussion:
Weed control was greatest for the two-pass treatments (Table 2) and for the treatments that included more than one herbicide from WSSA groups other than 2, 5, and 9. One exception was that the addition of Warrant to the tank mix of Roundup and XtendiMax may have caused a slight antagonistic effect on waterhemp control.

Site A did not have complete soybean canopy closure, which likely reduced the effectiveness of most treatments. Additionally, much of the waterhemp present in the post-emergence applications was likely larger than the suggested maximum height of 4”.

Although waterhemp was abundant at Site B in 2018, hand removal efforts prevented most of the weed seed production and very little waterhemp emerged for the trial in 2019. Therefore, waterhemp control is not shown for Site B. Conversely, few weeds other than waterhemp were present at Site A.

Table of waterhemp effectiveness by treatmentSoybean yield at Site A generally reflected effectiveness of waterhemp control. Yield losses would likely have been greater if the waterhemp had not been removed in mid-August. We found yield losses in Treatments 1, 2, 3, and 5 of 56%, 26%, 34%, and 20% respectively. Yields at Site B were less effected, reflecting less weed competition. Crop injury was visible from Cobra, with yield losses of 12% and 17% at Site A and Site B, respectively. Yield loss would likely have been greater in most treatments if waterhemp had not been manually removed in mid-August to prevent seed production.

 The total cost for the materials and application of the more extensive treatments was generally more expensive (Table 2). But given that uncontrolled waterhemp could result in a loss of $300/A, more expensive weed control programs are justified. Even the most expensive treatment ($75/A) may make economic sense due to the short-lived seeds of waterhemp. That treatment provided 100% control of waterhemp, preventing the return of waterhemp seeds to the soil, thereby allowing the depletion of most of the waterhemp seedbank in four years (Mark Loux, personal communication) and return to less expensive control programs. Nonetheless, additional treatments will be investigated in 2020 to attempt to achieve 100% control with less cost.

Objective 2.

The electrical discharge system was very effective in controlling the contacted horseweed (marestail). Complete necrosis was observed for most treated plants. Some plants had green leaves near their base, but no new growth or lateral branching was observed. Common ragweed was also very effectively controlled. Annual sowthistle was mostly controlled, but green leaves persisted on about 25% of the plant. The highest branches of bull thistle (a biennial) exhibited complete necrosis, but lower branches that were untouched by the weed zapper remained unharmed.

It was evident that our August 1 application of the electrical discharge system was earlier than optimal because most of the horseweed had not yet exceeded the height of the crop canopy and was not contacted by the electrified rod. Therefore, to maximize the weed control from a single pass, scouting should be used to delay the application as late as possible, but before the weeds initiate seed production – likely mid- to late-August for most New York farms. For interested farmers, custom application of the electrical discharge system is available through Preferred Quality Grain LLC of Cato, NY.

Project location(s):
Central and western New York.

Samples of resources developed:
Online articles:
Brown, B., DiTommaso, A., Howard, K., Hunter, M., Miller, J., Morris, S., Putman, J., Sikkema, P., Stanyard, M. Waterhemp Herbicide Resistance Tests: Preliminary Results. Cornell Field Crops Blog. May 15, 2019. https://blogs.cornell.edu/ccefieldcropnews/2019/05/15/waterhemp-herbicide-resistance-tests-preliminary-results/

Video:
Marshall, G., Brown, B. Waterhemp Control in Soybeans: 2019 Trials. NYSIPM. December 20, 2019. Accessed December 28, 2019. https://www.youtube.com/watch?v=WSAmMn2P7Wc

Marshall, G., Brown, B. Weed Zapper Demo 2019. NYSIPM. October 1, 2019. Accessed December 28, 2019. https://www.youtube.com/watch?v=GVB33hB8Nes

Acknowledgements:
Thank you to the New York Farm Viability Institute for supporting this project.

Disclaimer: Read pesticide labels prior to use. The information contained here is not a substitute for a pesticide label. Trade names used herein are for convenience only; no endorsement of products is intended, nor is criticism of unnamed products implied. Laws and labels change. It is your responsibility to use pesticides legally. Always consult with your local Cooperative Extension office for legal and recommended practices and products. cce.cornell.edu/localoffices

Print Friendly, PDF & Email

Effective Waterhemp Control Programs and Compatibility with Interseeding in Corn: 2019 Trials

Project Leaders: Bryan Brown, NYS IPM Program; Venancio Fernandez, Bayer Crop Sciences; Mike Hunter, Cornell Cooperative Extension; Jeff Miller, Oneida County Cooperative Extension; Mike Stanyard, Cornell Cooperative Extension

Collaborators: Derek Conway, Conway Farms; Jaime Cummings, NYS IPM Program; Quentin Good, Quentin Good Farms; Antonio DiTommaso, Cornell University; Michael Durant, Lewis County Soil and Water Conservation District; Kathleen Howard, Cornell University; Grace Marshall, NYS IPM Program; Scott Morris, Cornell University; Ali Nafchi, Cornell Cooperative Extension; Jodi Putman, Cornell Cooperative Extension; Joshua Putman, Cornell Cooperative Extension; Matthew Ryan, Cornell University; Lynn Sosnoskie, Cornell University; Ken Wise, NYS IPM Program

Summary:
Herbicide resistant waterhemp has spread into New York and caused yield losses for corn farmers. This project aimed to find ways to regain control of this weed in corn and determine the compatibility of more extensive herbicide programs with interseeded annual ryegrass. Our field trial included several treatments that effectively controlled waterhemp. One of the most effective treatments was an integrated program utilizing a reduced rate herbicide, row cultivation, and interseeding. This treatment was slightly more expensive than the other two-pass treatments but the cost may be offset by the benefits of cover cropping. Of the several residual herbicides that were compatible with interseeded annual ryegrass, Callisto provided the most effective control of waterhemp.

weed growing under corn
Figure 1. Waterhemp competing with corn at a farm in Seneca County, NY.

Background and justification:
In the past few years, herbicide resistant waterhemp has expanded into New York and is now present in 12 counties at the time of this publication. Corn farmers have reported yield losses of 20% due to this weed (Figure 1), even after herbicide applications. Our greenhouse spray chamber tests of waterhemp from three different locations in New York indicate that it is likely resistant to herbicides from WSSA groups 2, 5, and 9 (ALS inhibitors, photosystem II inhibitors, and EPSPS inhibitors, respectively). Effective control programs in other states have relied on herbicides from other groups as well as additional physical or cultural tactics. Pre-emergence applications of residual herbicides are often recommended in order to reduce both the burden placed on post-emergence applications.

However, residual herbicides can sometimes cause injury to succeeding crops. Cover crops interseeded into a corn crop are at particular risk of injury. Interseeding has grown in popularity as a way to include a winter cover crop, which can benefit soil health, reduce erosion, and provide weed suppressive residue. Interseeding typically occurs at corn growth stage V5 rather than waiting until after corn harvest, when it is oftentimes too late. Several prominent New York farmers have bought or built their own interseeders. Additionally, the Lewis County Soil and Water Conservation District and the Genesee River Coalition of Conservation Districts each have interseeders available for custom application.

Objectives:
Objective 1. Evaluate the effectiveness of several different programs in controlling waterhemp in corn.

Objective 2. Assess the compatibility of residual herbicides with an interseeded cover crop.

Procedures:
Objective 1.
The trial site was in Seneca County, NY on a field of Odessa silt loam soil where waterhemp had survived various herbicide applications and produced seed in 2018. In 2019, the ground was prepared for planting with a field cultivator on June 4, and planted on June 7. Pre-emergence applications were made after planting on June 7. Cultivation and interseeding occurred on July 12, while the other post-emergence treatments were applied on July 15. All treatments are listed in Table 1. For fertilizer, muriate of potash (0-0-60, 125 lbs K2O/A) was applied prior to tillage and urea nitrogen (46-0-0, 100 lbs N/A) was broadcast on July 12.

Plots were 25’ long and 10’ wide. Each treatment was replicated four times in a randomized complete block design. Spraying was conducted using a backpack CO2 sprayer with a 10’ boom. Spray volume was 20 gal/A applied at 40 psi. Row cultivation was achieved using a Double Wheel Hoe (Hoss Tools) with two staggered 6” sweeps (12” effective width). Two passes were made per row so that 24” of the 30” rows were cultivated. For Objective 1, interseeding was established by hand broadcasting annual ryegrass (Mercury Brand, “Ribeye”) at 20 lb/A.

Weed control was assessed on August 15 by collecting all aboveground weed biomass within a 2 ft2 quadrat. The quadrat was used four times per plot, placed randomly in the two middle rows of each plot. Weeds were placed in paper bags and dried at 113 degrees F for 7 days, then weighed. Control was calculated by subtracting the biomass of each treated plot from biomass of the untreated plots, dividing by the biomass of the untreated plots, and multiplying by 100. Waterhemp was the dominant species present in this trial. Other species did not provide enough data for comparison. All waterhemp was manually removed immediately after the weed control assessments in order to prevent it from producing seeds.

Table of weed herbicides for waterhemp in cornCorn grain yield was measured by first harvesting and weighing all ears in 10’ of a middle row of each plot on October 25. Weights were then adjusted based on the ratio of total ear weight to grain weight and then adjusted to 15.5% moisture based on subsamples that were completely dried (25 days at 113 degrees F). To provide an economic basis for comparison of each treatment, costs were estimated based on personal communications with several local custom applicators.

Objective 2.
This objective was conducted in Lewis County, NY on a field that did not contain any waterhemp. The field (Homer silt loam soil) was tilled June 9 and planted with silage corn (Pioneer, 95 day) on June 10 with 3 gal/A starter fertilizer (7-21-7). Pre-emergence herbicides were applied on June 12 and post-emergence on July 8. All treatments are listed in Table 2. Interseeding was conducted on July 10 using a 15’ interseeder (Interseeder Technologies) with three drills between each corn row operating at 0.5” depth. Annual ryegrass (Mercury Brand, “Ribeye”) was interseeded at 20 lb/A.

Table of pre-emergence herbicides for waterhemp with interseeded annual ryegrassWeed control of the pre-emergence herbicides was evaluated on July 7 by visually estimating the percentage of the ground covered by the most prevalent species or categories – common lambsquarters, velvetleaf, other broadleaf species, and monocot species. This was done using the same quadrat system described above and control was calculated in a similar manner.

Performance of the annual ryegrass was assessed on September 20 by collecting the aboveground biomass using the quadrat system and drying samples at 113 degrees F for 7 days before weighing. Although there would have been more cover crop biomass later in the fall, silage harvest would likely have altered the results.

Results and discussion:

Objective 1.
Waterhemp control was most effective in treatments that utilized herbicides from WSSA groups other than 2, 5, or 9, or treatments that integrated non-chemical tactics. The pre-emergence-only and two-pass treatments were more effective than the post-emergence-only treatments. It was unexpected that the treatment with a reduced rate of Callisto followed by row cultivation and interseeding would control 100% of the waterhemp since most in-row weeds would have been uncontrolled by cultivation and the competition from the interseeded annual ryegrass would have been minimal.

Table of effectiveness and cost for herbicide treatments of waterhempBoth the untreated control and the treatment of ResolveQ yielded 10% less than the treatments with more than one herbicide or tactic. Yield loss would likely have been greater in most treatments if waterhemp had not been manually removed in mid-August to prevent seed production. From personal communications with NY corn farmers who have waterhemp in their fields, a 20% yield loss can be expected in fields with poor control.

The two-pass programs were the most expensive, but were also the only treatments to offer 100% control of waterhemp. Several one-pass treatments offered 99% control with less expense, but the remaining 1% of uncontrolled waterhemp could likely produce enough seed to perpetuate the population.

Objective 2.
Early-season weed control was most effective for treatments containing Acuron or Callisto (Table 4) even though reduced rates were used. Weed control for the other treatments varied by weed species, which reflects their more common use in mixtures. Dual II Magnum and Warrant performed somewhat similarly, which was expected because they are both in WSSA group 15.

Annual ryegrass biomass of the grower standard (Treatment 2) was similar to several of the treatments containing residual herbicides (Table 4). Treatments with pre-emergence applications of Dual II Magnum, Sharpen, and Acuron affected annual ryegrass biomass, although the injury from Sharpen may have been confounded by the addition of ResolveQ in the post-emergence application. More injury to annual ryegrass was expected from Atrazine, but a heavy rain may have lessened its effect. A rainfall gage at the field showed that in the four weeks between the pre-emergence applications and the interseeding, the field received nearly 4” of rain, with 2” on June 20. Likewise, the post-emergence use of row cultivation in Treatment 10 may have lessened the effect of Acuron on annual ryegrass. Overall, Callisto stood out as the residual product that did not injure the annual ryegrass but also controlled waterhemp effectively in Objective 1.

Table of effectiveness of treatment on early season weed controlProject location(s):
Northern, western, and central New York.

Samples of resources developed:
Online articles:
Brown, B., DiTommaso, A., Howard, K., Hunter, M., Miller, J., Morris, S., Putman, J., Sikkema, P., Stanyard, M. Waterhemp Herbicide Resistance Tests: Preliminary Results. Cornell Field Crops Blog. May 15, 2019. https://blogs.cornell.edu/ccefieldcropnews/2019/05/15/waterhemp-herbicide-resistance-tests-preliminary-results/

Video:
Marshall, G., Brown, B. Waterhemp Control in Corn: 2019 Trials. NYSIPM. December 20, 2019. Accessed December 28, 2019. https://www.youtube.com/watch?v=8NQ6S39uQ-8&t=17s

Acknowledgements:
Thank you to the New York Farm Viability Institute for supporting this project.

Disclaimer: Read pesticide labels prior to use. The information contained here is not a substitute for a pesticide label. Trade names used herein are for convenience only; no endorsement of products is intended, nor is criticism of unnamed products implied. Laws and labels change. It is your responsibility to use pesticides legally. Always consult with your local Cooperative Extension office for legal and recommended practices and products. cce.cornell.edu/localoffices


Print Friendly, PDF & Email

What’s Cropping Up? Volume 29 Number 3 – July/August 2019

Organic compared to Conventional Crop Rotations lost $ during the Transition but made more $ in the 2 years after the Transition and in the total 4 Years of the Study

Bill Cox, John Hanchar, Eric Sandsted, and Mark Sorrells

2016 July corn, soybeans, and wheat
The organic corn-soybean-wheat/red clover rotation was the most profitable rotation from 2015 to 2018.

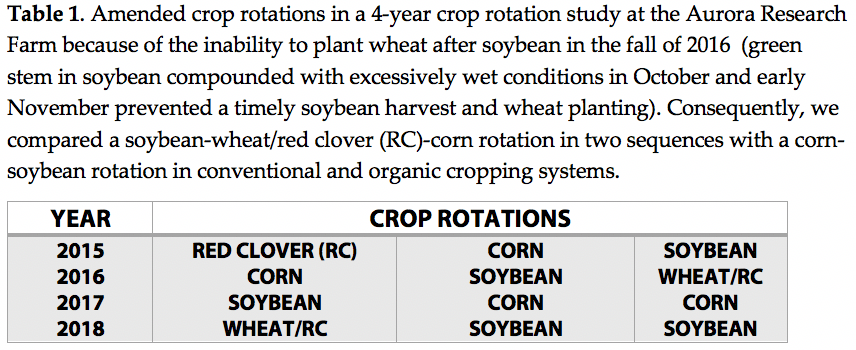
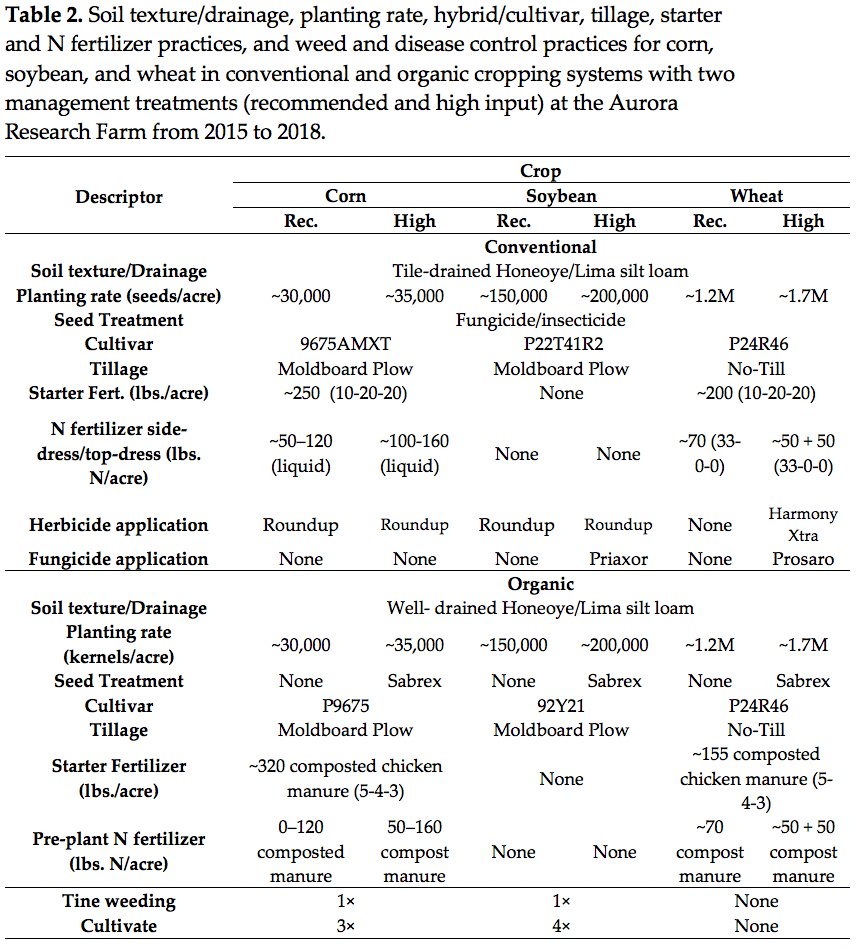
We conducted a 4-year study at the Aurora Research Farm from 2015 to 2018 to compare different sequences of the corn, soybean, and wheat/red clover rotation in conventional and organic cropping systems under recommended and high input management. Unfortunately, we were unable to plant wheat after soybean in the fall of 2016 because green stem in soybean, compounded with very wet conditions in October and early November, delayed soybean harvest until November 9, too late for wheat planting. Consequently, corn followed soybean as well as wheat/red cover in 2017 so we compared two sequences of the corn-soybean-wheat/red clover rotation with a corn-soybean rotation (Table 1). Please refer to previous What’s Cropping Up? articles from 2015 to 2018 for the various inputs for each crop for each year within each cropping system (https://scs.cals.cornell.edu/extension-outreach/whats-cropping-up/). Also, you can refer to Table 2 for a general overview of the management inputs for each crop within cropping systems across years. This article will first discuss the economics of the three crops in Year 3 or 4 of the study. We will then discuss the economics of the three rotations during the 36-month transition period (Year 1 and 2 of the study), the 2-year period after the transition (when the organic premium is in place), and the total 4 years of the study.

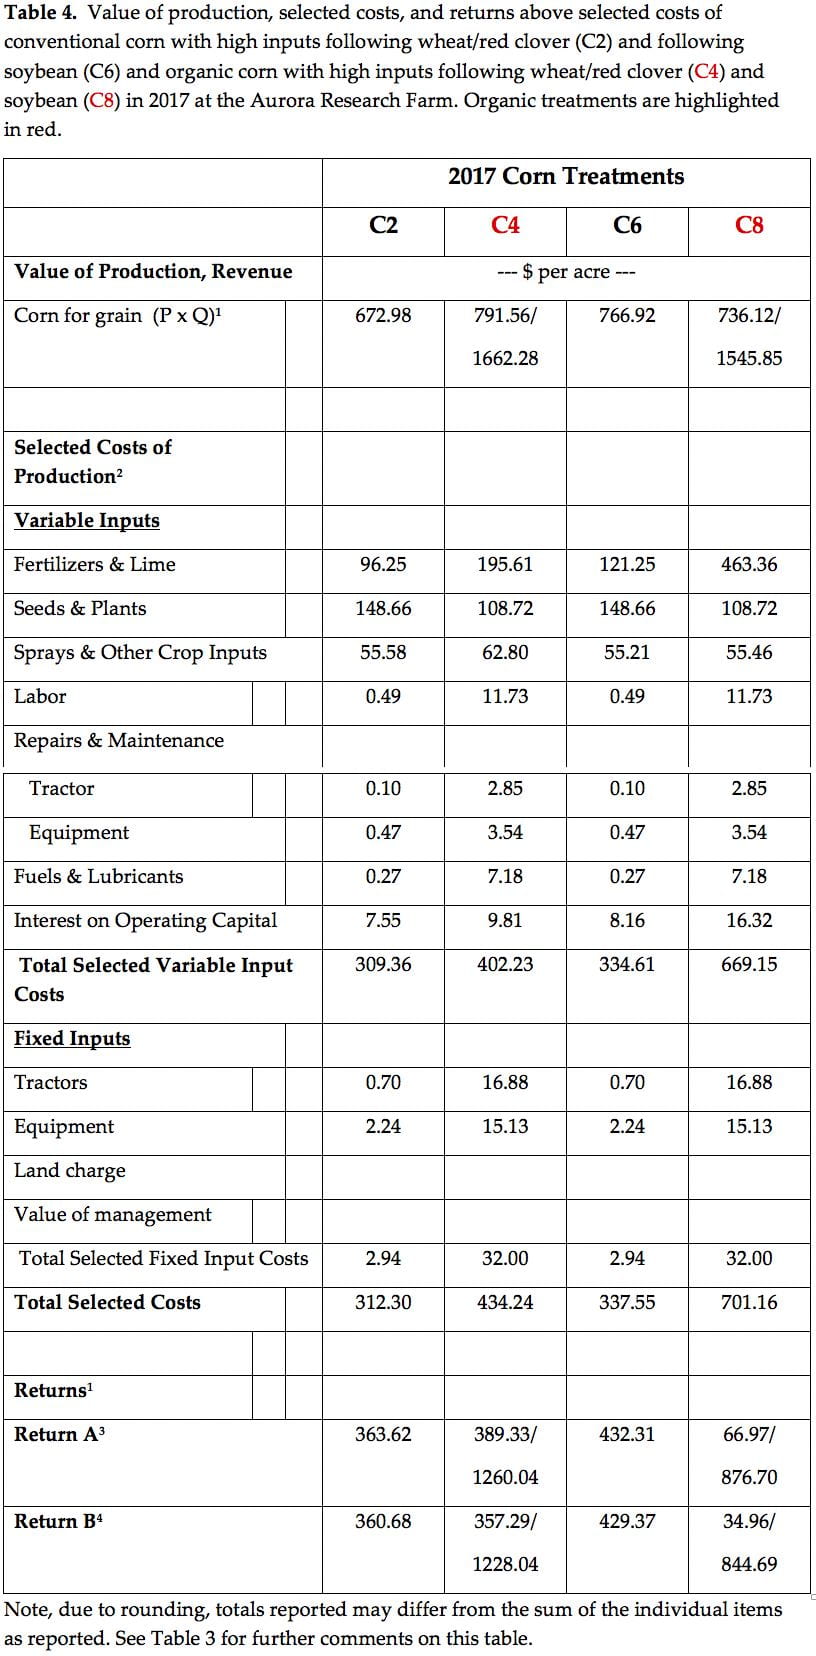
Tables 3-6 show the revenue, selected costs, and returns above selected costs for corn in 2017, soybean in 2017, and wheat in 2018. The selected costs differed slightly for each crop across years because of changes in input prices (for example fertilizer and fuel prices change somewhat from year to year). The differences in selected costs between cropping systems for each crop, however, are consistent across years so Tables 3-6 are very representative of selected costs of each crop. On the other hand, revenue and returns for each crop differed significantly across years mostly because of different yields (for example, organic corn averaged ~115 bushels/acre in 2015 but ~185 bushels/acre in 2017), but also because commodity prices varied somewhat across years. So use Tables 3-6 as references in the discussion on selected costs for each crop but not for the revenue and returns for each crop in each year. We didn’t include the 2018 soybean economics data, however, because the differences in revenue and returns between organic and conventional systems were similar as were comparisons between rotations, and  the costs did not vary by more than $6/acre for each treatment.

Organic compared with conventional corn with recommended inputs had ~$15/acre lower selected costs following wheat/red clover (C3 vs. C1 comparison, Table 3) but ~$275/acre higher selected costs following soybean (C3 vs. C7 comparison, Table 3). With high inputs, organic compared with conventional corn had ~$120/acre higher selected costs following wheat/red clover (C4 vs. C2 comparison, Table 4) and ~$365/acre higher selected costs following soybean (C8 vs. C6 comparison, Table 4). As expected, organic compared with conventional corn had lower seed costs because the organic hybrid did not receive a seed treatment and did not have GM traits (Tables 3 and 4). Organic compared with conventional corn had higher fertilizer costs because of the much greater cost for composted poultry manure relative to conventional starter and N fertilizer. The fertilizer and selected costs were much greater for organic corn following soybean (C7 and C8, Tables 3 and 4) compared with following wheat/red clover (C3 and C4) because of the greater N requirement for corn when following soybean. Organic compared with conventional corn also had higher labor, repair and maintenance, and fuel and lubricant costs because of the 4-time use of labor and equipment for mechanical weed control in organic corn (rotary hoe 1x and cultivation 3x) compared with the 1-time use of labor and equipment in conventional corn (herbicide application). Organic compared with conventional corn also had greater fixed costs because of greater wear and tear with the 4-time use of tractors and equipment compared to 1-time use of tractors and equipment for weed control purposes.

Organic compared with conventional corn with recommended inputs had ~$70/acre greater revenue when following wheat/red clover in 2017 (C3 vs C1 comparison, Table 3) and similar revenue when following soybean (C7 vs. C5 comparison, Table 3) in the absence of an organic premium. All prohibited inputs (synthetic fertilizer, GM crops, pesticides, etc.), however, had been applied to the three fields in our study by June of 2014, more than 36 months prior to corn harvest in 2017, so organic corn would have been eligible for the organic premium. We will thus use organic prices for 2017 corn and soybean crops grown under organic management in this study. Organic compared with conventional corn with recommended inputs had ~$830/acre greater revenue following wheat/red clover and ~$685/acre greater revenue when following soybean in the presence of the organic premium (Table 3). Likewise, organic compared with conventional corn with high inputs had ~$990/acre greater revenue when following wheat/red clover (C4 vs. C2 comparison, Table 4) and ~$780/acre greater revenue following soybean (C8 vs. C6 comparison, Table 4). Please keep in mind that organic corn yields averaged ~185 bushels/acre; whereas conventional corn yields averaged ~175 bushels/acre in 2017.  In 2015, however, organic compared with conventional corn had much lower revenue because of ~35% lower yields and the organic premium was not in place (first year of the transition). Likewise, in 2016, organic corn had lower revenue because of 7% lower yields, similar or higher selected costs, and no organic premium (2nd year of the transition). So please use Tables 3 and 4 as representative of selected costs but not of revenue and returns above selected costs.

Organic compared with conventional soybean had ~$20/acre higher selected costs with recommended inputs (S3 vs. S1 comparison, Table 5) but ~$5/acre lower selected costs with high inputs (S4 vs. S2 comparison, Table 5). Organic compared with conventional soybean had lower variable costs because of lower seed and other crop input costs, despite higher labor, repair and maintenance, and fuel and lubricant costs (Table 5). As with organic corn, organic compared with conventional soybean had higher fixed costs because of more wear and tear on the machinery with 5 trips (1x rotary hoeing and 4x cultivations) compared to 1 trip over the field (herbicide application) with recommended inputs or 2 trips over the field (herbicide and fungicide applications) with high inputs .

Organic compared with conventional soybean had ~$55/acre lower revenue with recommended inputs (S3 vs. S1 comparison, Table 5) or with high inputs (S4 vs. S2 comparison, Table 5) in 2017 because of ~8% lower yield in the absence of an organic premium (Table 5). In the presence of an organic premium, organic compared with conventional soybean had ~$370/acre greater revenue with recommended or high inputs. Unlike corn that had inconsistent yield differences between organic and conventional corn across years, organic and conventional soybean yield differences did not vary much (similar yields in 2015 and 2016; ~8% lower in 2017; and ~11% lower in 2018).  Because of the small differences in yield and selected costs, organic and conventional soybean had similar returns above selected costs in 2015 and 2016 and higher returns in 2017 and 2018. Organic soybean with recommended and high inputs had similar returns in 2017 (S4 vs. S3 comparison) as well as in 2015 and 2016 but somewhat higher returns in 2018.

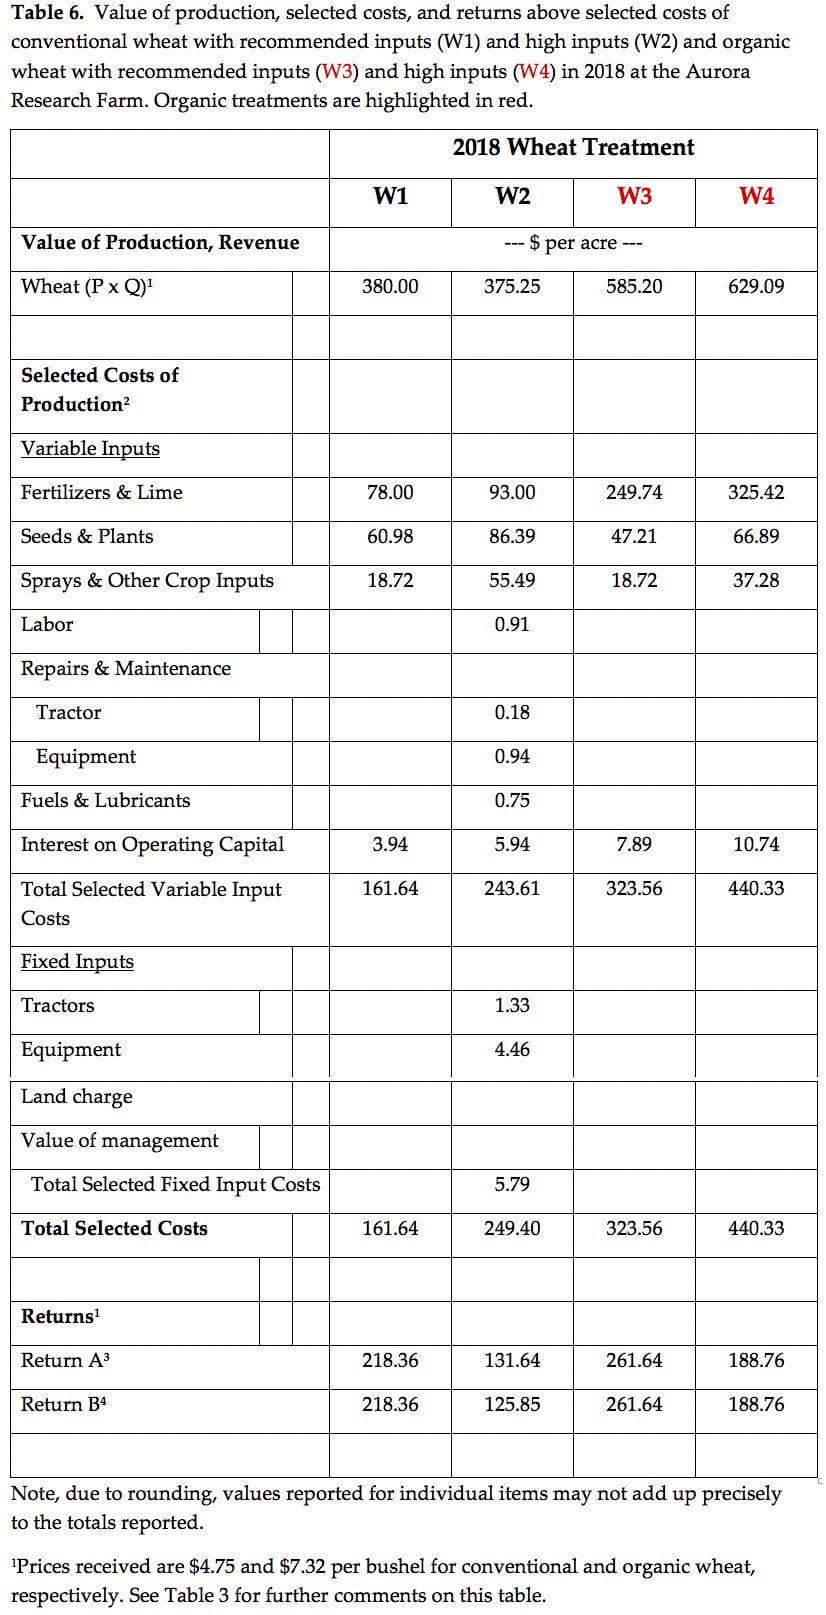
In 2018, organic compared with conventional wheat had ~$160/acre greater selected costs with recommended inputs (W3 vs. W1 comparison, Table 6) and ~$190/acre greater costs with high inputs (W4 vs. W2 comparison, Table 6). Organic compared with conventional wheat had lower seed costs (same variety but no seed-applied pesticide), but much higher fertilizer costs, associated with the use of composted chicken manure, which costs almost 13x the cost of the ammonium nitrate (33-0-0) used on conventional wheat. Organic compared with conventional wheat with recommended inputs in 2018 had ~$205/acre greater revenue because the yields were similar and organic wheat received the organic price premium. Also, organic compared with conventional wheat with high inputs had ~$255/acre greater revenue because of ~7% higher yields and the presence of an organic premium.

Organic compared with conventional wheat with recommended inputs (W3 vs. W1 comparison, Table 6) had ~$45/acre higher return in 2018, despite the ~$160/acre higher selected costs. Obviously the increased revenue, associated with the organic premium, offset the higher selected costs, associated with the use of composted chicken manure. Likewise, organic compared with conventional wheat with high inputs had ~$65/acre higher returns above selected costs (W4 vs. W2 comparison, Table 6). Despite the higher revenue of organic wheat with high vs. recommended inputs, organic wheat with recommended inputs had ~$75/acre higher returns (W3 vs. W4 comparison) because the added revenue from the ~7% yield increase did not offset the higher selected costs, associated mostly with the higher rates of composted manure. Organic compared with conventional wheat, however, had lower returns in 2016 because yields were ~7% lower, selected costs were higher, and the organic premium was not in place (2nd year of transition).

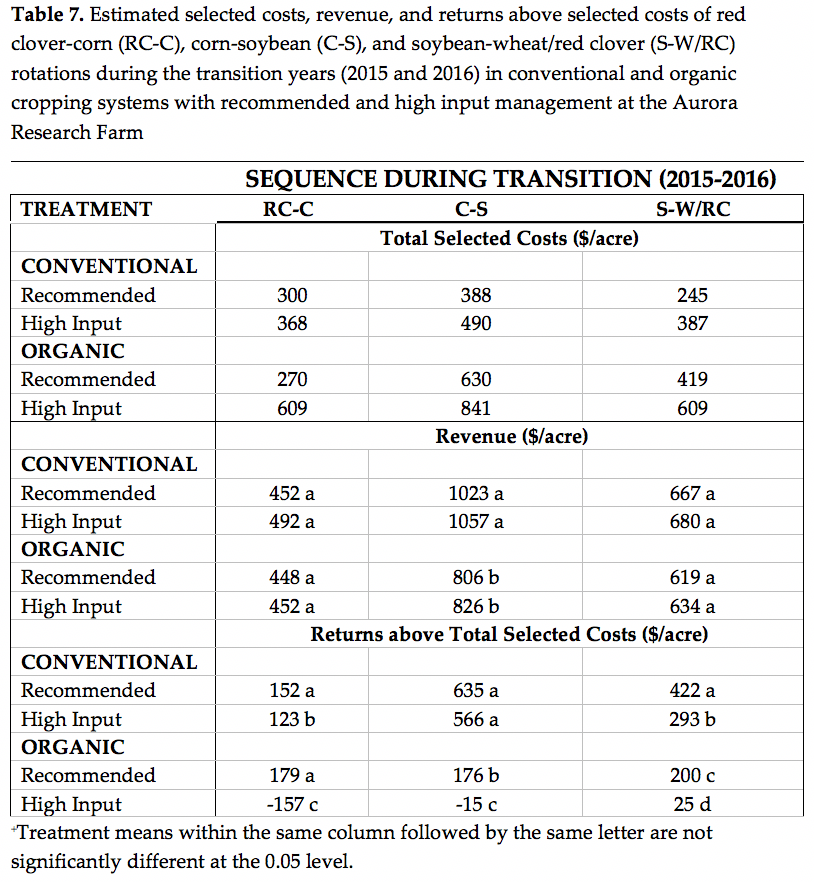
Table 7 shows the costs, revenue, and returns above selected costs of the red clover-corn, corn-soybean, and soybean-wheat/red clover rotations during the transition period, the first 2 years (2015 and 2016) of the study. (A value in Table 7 equals the sum of the 2015 and 2016 values for that treatment). As explained in previous news articles, we planted red clover alone in the early summer of 2015 and plowed it under in the spring of 2016 to see if a green manure crop would provide agronomic and economic benefits to subsequent organic crops in the rotation. The 2-year organic compared with conventional rotations generally had higher selected costs, especially with high input management, mostly because of the very high costs for the composted manure applied to corn and wheat. Revenue was similar as were returns between conventional ($152/acre) and organic ($179/acre) red clover-corn rotations with recommended inputs. Most conventional growers, however, would not plant a green manure crop so a comparison of the organic red clover-corn rotation vs. the conventional corn-soybean rotation with recommended inputs is more appropriate. In this comparison, the organic red clover-corn rotation had ~$455/acre lower returns, similar to the comparison between the conventional vs. organic corn-soybean rotation. The organic compared with the conventional soybean-wheat/red clover rotation with recommended inputs had ~$220/acre lower returns, which proved to be the most economical organic rotation in this study during the transition years. Many conventional growers, however, use high inputs on soybean (200,000 seeds/acre, fungicide/insecticide seed treatment, and foliar fungicide application) and even more so on wheat (high seeding rate, seed treatment, fall herbicide application, split-N application, and foliar fungicide application). A comparison of the organic soybean-wheat/red clover rotation with recommended inputs vs. the conventional soybean-wheat/red clover rotation with high inputs shows only ~$95/acre lower returns during the first 2 years of the transition. All rotations in conventional and organic cropping systems with recommended vs. high inputs had greater returns, except for the conventional corn-soybean rotation, which had similar returns.

During the first 2 years after the transition (2017 and 2018) in this study, selected costs were once again mostly higher in the organic compared with the conventional rotations, especially with high input management (Table 8, a value in the table equals the sum of the 2017 and 2018 values for that treatment). Again, the higher costs for composted manure on organic corn and wheat compared to synthetic fertilizer contributed to the higher costs. The organic compared with the conventional cropping system in all three rotations had much greater revenue because of similar to greater corn and wheat yields or slightly lower soybean yields, coupled with the organic premiums. So despite the mostly higher selected costs for organic compared with the conventional rotations, higher costs did not offset the higher revenue, resulting in much higher returns above selected costs for the organic rotations (Table 8). When averaged across input treatments, organic compared with the conventional cropping system had ~$410/acre higher returns in the red clover-corn-soybean-wheat/red clover rotation, ~$720/acre higher in the corn-soybean rotation, and ~$1200/acre higher in the soybean-wheat/red clover-corn-soybean rotation. When averaged across input treatments in the organic rotation, the organic soybean-wheat/red clover-corn-soybean rotation had ~$435/acre higher returns than the organic corn-soybean rotation and ~$930/acre higher returns than the organic red clover-corn-soybean-wheat/red clover rotation. Similar to the transition period, the soybean-wheat/red clover-corn-soybean rotation was the most economical organic rotation during the first 2 years after the transition.

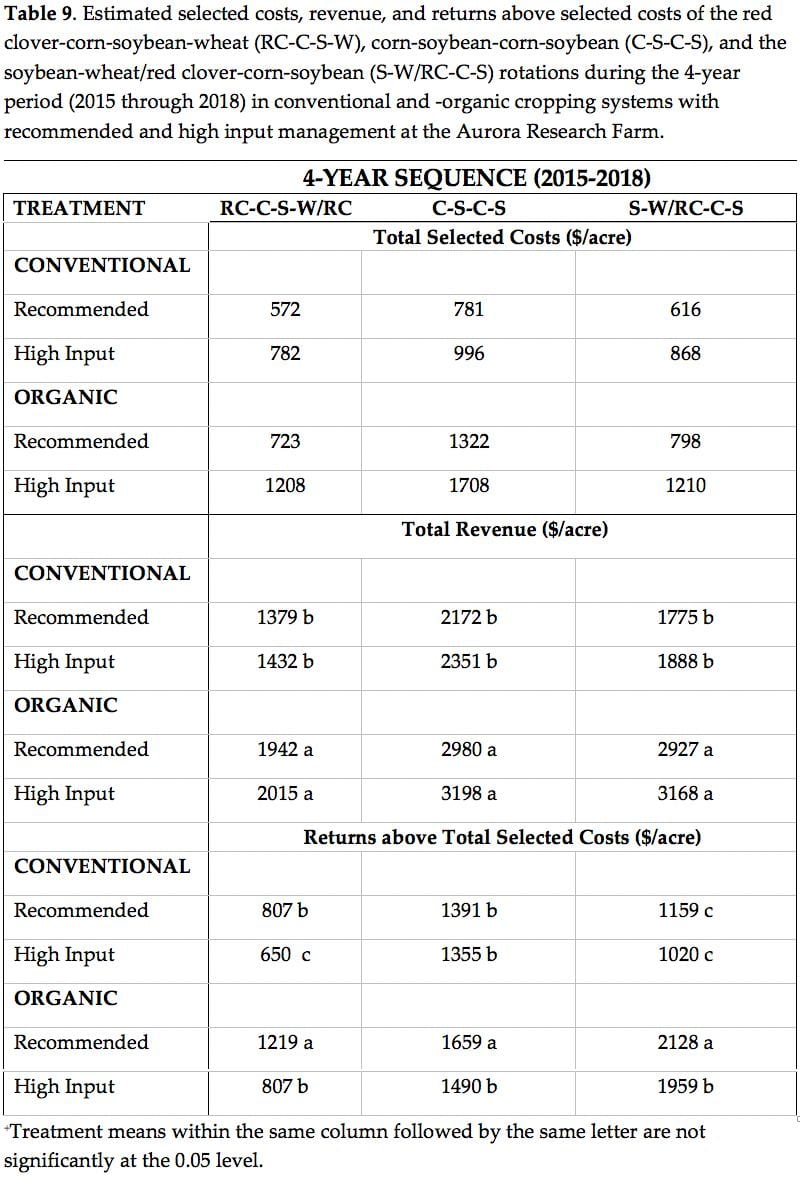
The organic compared with the conventional cropping system had much higher total selected costs in all 4-year crop rotations, which was more than offset by the much greater revenue in all 4-year crop rotations (Table 9). When averaged across input treatments, the organic compared with the conventional cropping system had ~$270/acre higher returns above selected costs in the red clover-corn-soybean-wheat/red clover rotation, ~$200/acre higher returns in the corn-soybean rotation, and ~$955/acre higher returns in the soybean-wheat/red clover-corn-soybean rotation. When averaged across input treatments in the organic rotation, the organic soybean-wheat/red clover-corn-soybean had ~$470/acre higher returns than the organic corn-soybean rotation and ~$1030/acre higher returns than the organic red clover-corn-soybean-wheat/red clover rotation. Obviously, planting a green manure crop was the least profitable organic rotation to select. Despite the lower returns for organic wheat compared with organic soybean or organic corn, the inclusion of wheat/red clover in the organic rotation was far more profitable than just the corn-soybean rotation over the 4-year period. In contrast, the corn-soybean rotation was most profitable for the conventional cropping system.

In the organic cropping system, recommended input compared with high input management had $412/acre higher returns above selected costs in the red clover-corn-soybean-wheat/red clover rotation and $169/acre higher returns in the corn-soybean and soybean-wheat/red clover-corn-soybean rotation. Consequently, the results clearly suggest that organic cropping systems, regardless of rotation, did not respond to high input management in this study. Many organic growers have been advised to use higher than recommended seeding rates with the goal of improved weed control. In our study, we saw statistically fewer weeds with high input management in corn, soybean and wheat but differences were so small that it had no effect on crop yield in this environment. Based on the returns above selected costs in our study, the use of higher seeding and N rates is not justified in the first 4 years of organic soybean-wheat/red clover-corn-soybean rotation on silt loam soils in central New York.

Conclusions

Field crop producers who transition to organic corn, soybean, and wheat production can generate greater returns above selected costs than conventional field crop producers after 4 years under the environmental conditions of this study, if they can successfully manage the cash-flow challenges during the transition period. To help manage the cash-flow challenges, transitioning growers should not apply prohibited inputs in their last conventional crop after late spring/early summer so the 36-month transition period can be accomplished in two growing seasons. Given the growing conditions during this study and the economic analyses reported here, transitioning growers should not use a green manure crop in the first year of transition but rather plant soybean. Soybean does not require N fertilizer, a major constraint to organic corn and wheat production, so growers should begin their transition in a field where soybean is the intended crop. In addition, soybean with the use of aggressive cultivation is also competitive with weeds, the other major constraint to organic field crop production.

Based on the economic results of this study, field crop producers should include winter wheat as the second crop in the transition after soybean. Organic growers may be able to no-till wheat after soybean harvest, if few winter perennial weeds are observed in the soybean crop. Growers should also frost-seed red clover into standing wheat in early spring, a typical practice for many conventional wheat growers.

Economic analyses of this study suggests that field crop producers, who transition to an organic cropping system, should plant corn in the 3rd year, or the first year when crops are eligible for the organic premium. Organic corn typically has a higher premium when compared with premiums for organic soybean and organic wheat. Corn should follow wheat with interseeded red clover, which provides considerable slow-release N to the subsequent corn crop. In addition, the wheat/red clover crops can disrupt weed cycles, as evidenced by the much lower weed densities in organic corn in the soybean-wheat/red clover-corn-soybean rotation compared with the corn-soybean rotation in 2017. In the 4th year of the study, field crop producers should begin the soybean-wheat/red clover-corn-soybean rotation again by planting soybean.

Based on the economic results of this study, field crop producers should use current recommended inputs for conventional crops and not use elevated seeding rates to improve weed control or use higher N rates to provide more available soil N to corn and wheat. Although the organic compared to the conventional cropping system generated greater returns above selected costs in this study, we recognize that commodity prices, farm size, individual/personal beliefs, and other factors influence a grower’s decision on whether to transition to an organic cropping system. Furthermore, we recognize that the growing conditions and soils were unique to this study so results could differ for different years or locations in New York.

Print Friendly, PDF & Email

What’s Cropping Up? Volume 28, Number 5 – November/December 2018

“Deja Vu all over again”: Organic soybeans in a soybean-wheat/red clover-corn rotation comes in at 55 bushels/acre but high input conventional beans come in at 62 bushels/acre

by Bill Cox, Eric Sandsted, Phil Atkins, and Wes Baum

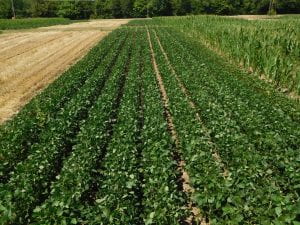
Conventional soybean remained weed-free throughout the season.
Organic soybean was generally clean but the weeds were quite robust in locations of the field where weeds were not controlled.

We initiated a 4-year study at the Aurora Research Farm in 2015 to compare different sequences of the corn-soybean-wheat/red clover rotation in conventional and organic cropping systems under recommended and high input management during the transition period (and beyond) to an organic cropping system. Unfortunately, we were unable to plant wheat after soybean in the fall of 2016 because green stem in soybean, compounded with very wet conditions in October and early November, delayed soybean harvest until November 9, too late for wheat planting. Consequently, soybean followed corn as well as wheat/red cover in 2018 so we are now comparing different sequences of the corn-soybean-wheat/red clover rotation with a corn-soybean rotation (Table 1). This article will focus on soybean yields in 2018 in both rotations.

The fields were plowed on May 17 and then cultimulched on the morning of May 18, the day of planting. We used the White Air Seeder to plant the treated (insecticide/fungicide) GMO soybean variety, P22T41R2, and the non-treated non-GMO variety, P21A20, at two seeding rates, ~150,000 (recommended input) and ~200,000 seeds/acre (high input). P21A20 is a not an isoline of P22T41R2 so only the maturity of the two varieties and not the genetics are similar between the two cropping systems. We treated the non-GMO, P21A20, in the seed hopper with the organic seed treatment, Sabrex, in the high input treatment (high seeding rate). We used the typical 15” row spacing in conventional soybean and the typical 30” row spacing (for cultivation of weeds) in organic soybean. Consequently, the soybean comparison is not as robust as the corn or wheat comparisons in this study because of the different row spacing and genetics between the two cropping systems.

We applied Roundup on June 20 for weed control in conventional soybean (V4 stage) under both recommended and high input treatments. The high input soybean treatment in the conventional cropping system also received a fungicide, Priaxor, on August 2, the R3 stage. We used the rotary hoe to control weeds in the row in recommended and high input organic soybean at the V1 stage (May 29). We then cultivated close to the soybean row in both recommended and high input organic treatments at the V3 stage (June 14) with repeated cultivations between the rows at the V4-V5 stage (June 19), the V5-V6 stage (June 29), the R1 stage (July 10), and the R3 stage (July 26).

Weather conditions were exceedingly dry from planting until July 16 with only 3.12 inches of precipitation recorded at the Aurora Research Farm. In fact, the 3.12 inches of precipitation in 2018 was the driest 5/17-7/16 period ever in 59 years of record keeping at the Aurora site (http://climod.nrcc.cornell.edu/runClimod/1d121489c4dfec7b/3/). The Aurora Research Farm, however, received 10 inches of rain over the next 2-month period (7/16-9/15), the date when organic soybeans attained physiological maturity (R7 stage). The 10 inches of rain was the 8th wettest 7/16-9/15 period ever at Aurora (http://climod.nrcc.cornell.edu/runClimod/60f4a05670d22553/1/), which contributed to high soybean yields throughout the area.

We discussed early plant establishment of our 2018 soybeans in a previous article (https://blogs.cornell.edu/whatscroppingup/2018/06/05/more-rapid-emergence-but-lower-early-plant-densities-v1-stage-in-organic-compared-to-conventional-2018-soybean/). Briefly, organic soybeans emerged earlier but only had 67-76% early plant establishment compared with 78-91% in conventional soybeans (Table 2). We noted that the organic soybeans with recommended inputs had early plant stands mostly below 105,000 plants/acre, and wondered if stands would be too low for maximum yields. We do not have our final plant stand data for soybeans completely counted yet so we are not sure if final stands in recommended input organic soybeans dipped below 100,000 plants/acre. Regardless, organic soybeans with recommended inputs yielded the same as organic soybeans with high inputs (~54 bushels/acre and ~55 bushels/acre, respectively), despite having 40,000-50,000 fewer plants/acre established at the V1 stage (Table 2).

As in 2017, organic soybeans in the soybean-wheat/red clover-corn rotation yielded around 55 bushels/acre, a significant 7 bushel/acre lower yield than high input conventional management. Organic soybeans in the corn-soybean rotation yielded 53 bushels/acre, statistically similar to organic soybeans in the soybean-wheat/red clover-corn rotation. We thought that the extended rotation of the soybean-wheat/red clover-corn rotation in conjunction with its somewhat lower weed densities in 2018 (Table 2) would boost yields more, perhaps resulting in similar yields between organic and conventional soybeans. But that was not the case in 2018. What was the case, however, was the lack of yield response to higher seeding rates for organic soybeans in 2018, for the 4th consecutive year in this study.

When averaged across the three previous 2014 crops (or three different fields) and the two different rotations (corn-soybean and wheat-red clover-corn-soybean), conventional soybean with high inputs yielded about 62 bushels/acre compared to about 58 bushels/acre in recommended conventional soybeans. The 4 bushel/acre yield response for high input conventional soybean was probably associated with the fungicide application rather than the higher seeding rates (conventional soybeans had average early stands of greater than 125,000 plants/acre-too high for a seeding rate response). We sampled two 1.52 square meter areas of each plot for yield component analysis so once those samples have been processed, we can determine if plant number, pod number, seed number, or seed weight contributed the most to the 4 bushel/acre yield advantage for high input conventional soybeans. If seed weight contributed the most, then the 4 bushel/acre response was probably associated with the fungicide application.

In conclusion, conventional soybean yielded higher than organic soybean for the second consecutive year of this study. Organic soybean, however, would receive the organic price premium (typically more than 2x the conventional soybean price). Consequently, organic soybean, despite the ~10% overall lower yield, would be more profitable, especially at the recommended 150,000 seeds/acre seeding rate and no organic seed treatment. We will conduct a final economic analyses of soybeans and the entire study over the winter and write up the final results next spring or early summer.

Print Friendly, PDF & Email