1Cornell University, School of Integrative Plant Science, Soil and Crop Sciences, Ithaca, NY; 2Cornell Cooperative Extension Northwest New York Dairy, Livestock & Field Crops, Newark, NY
Introduction
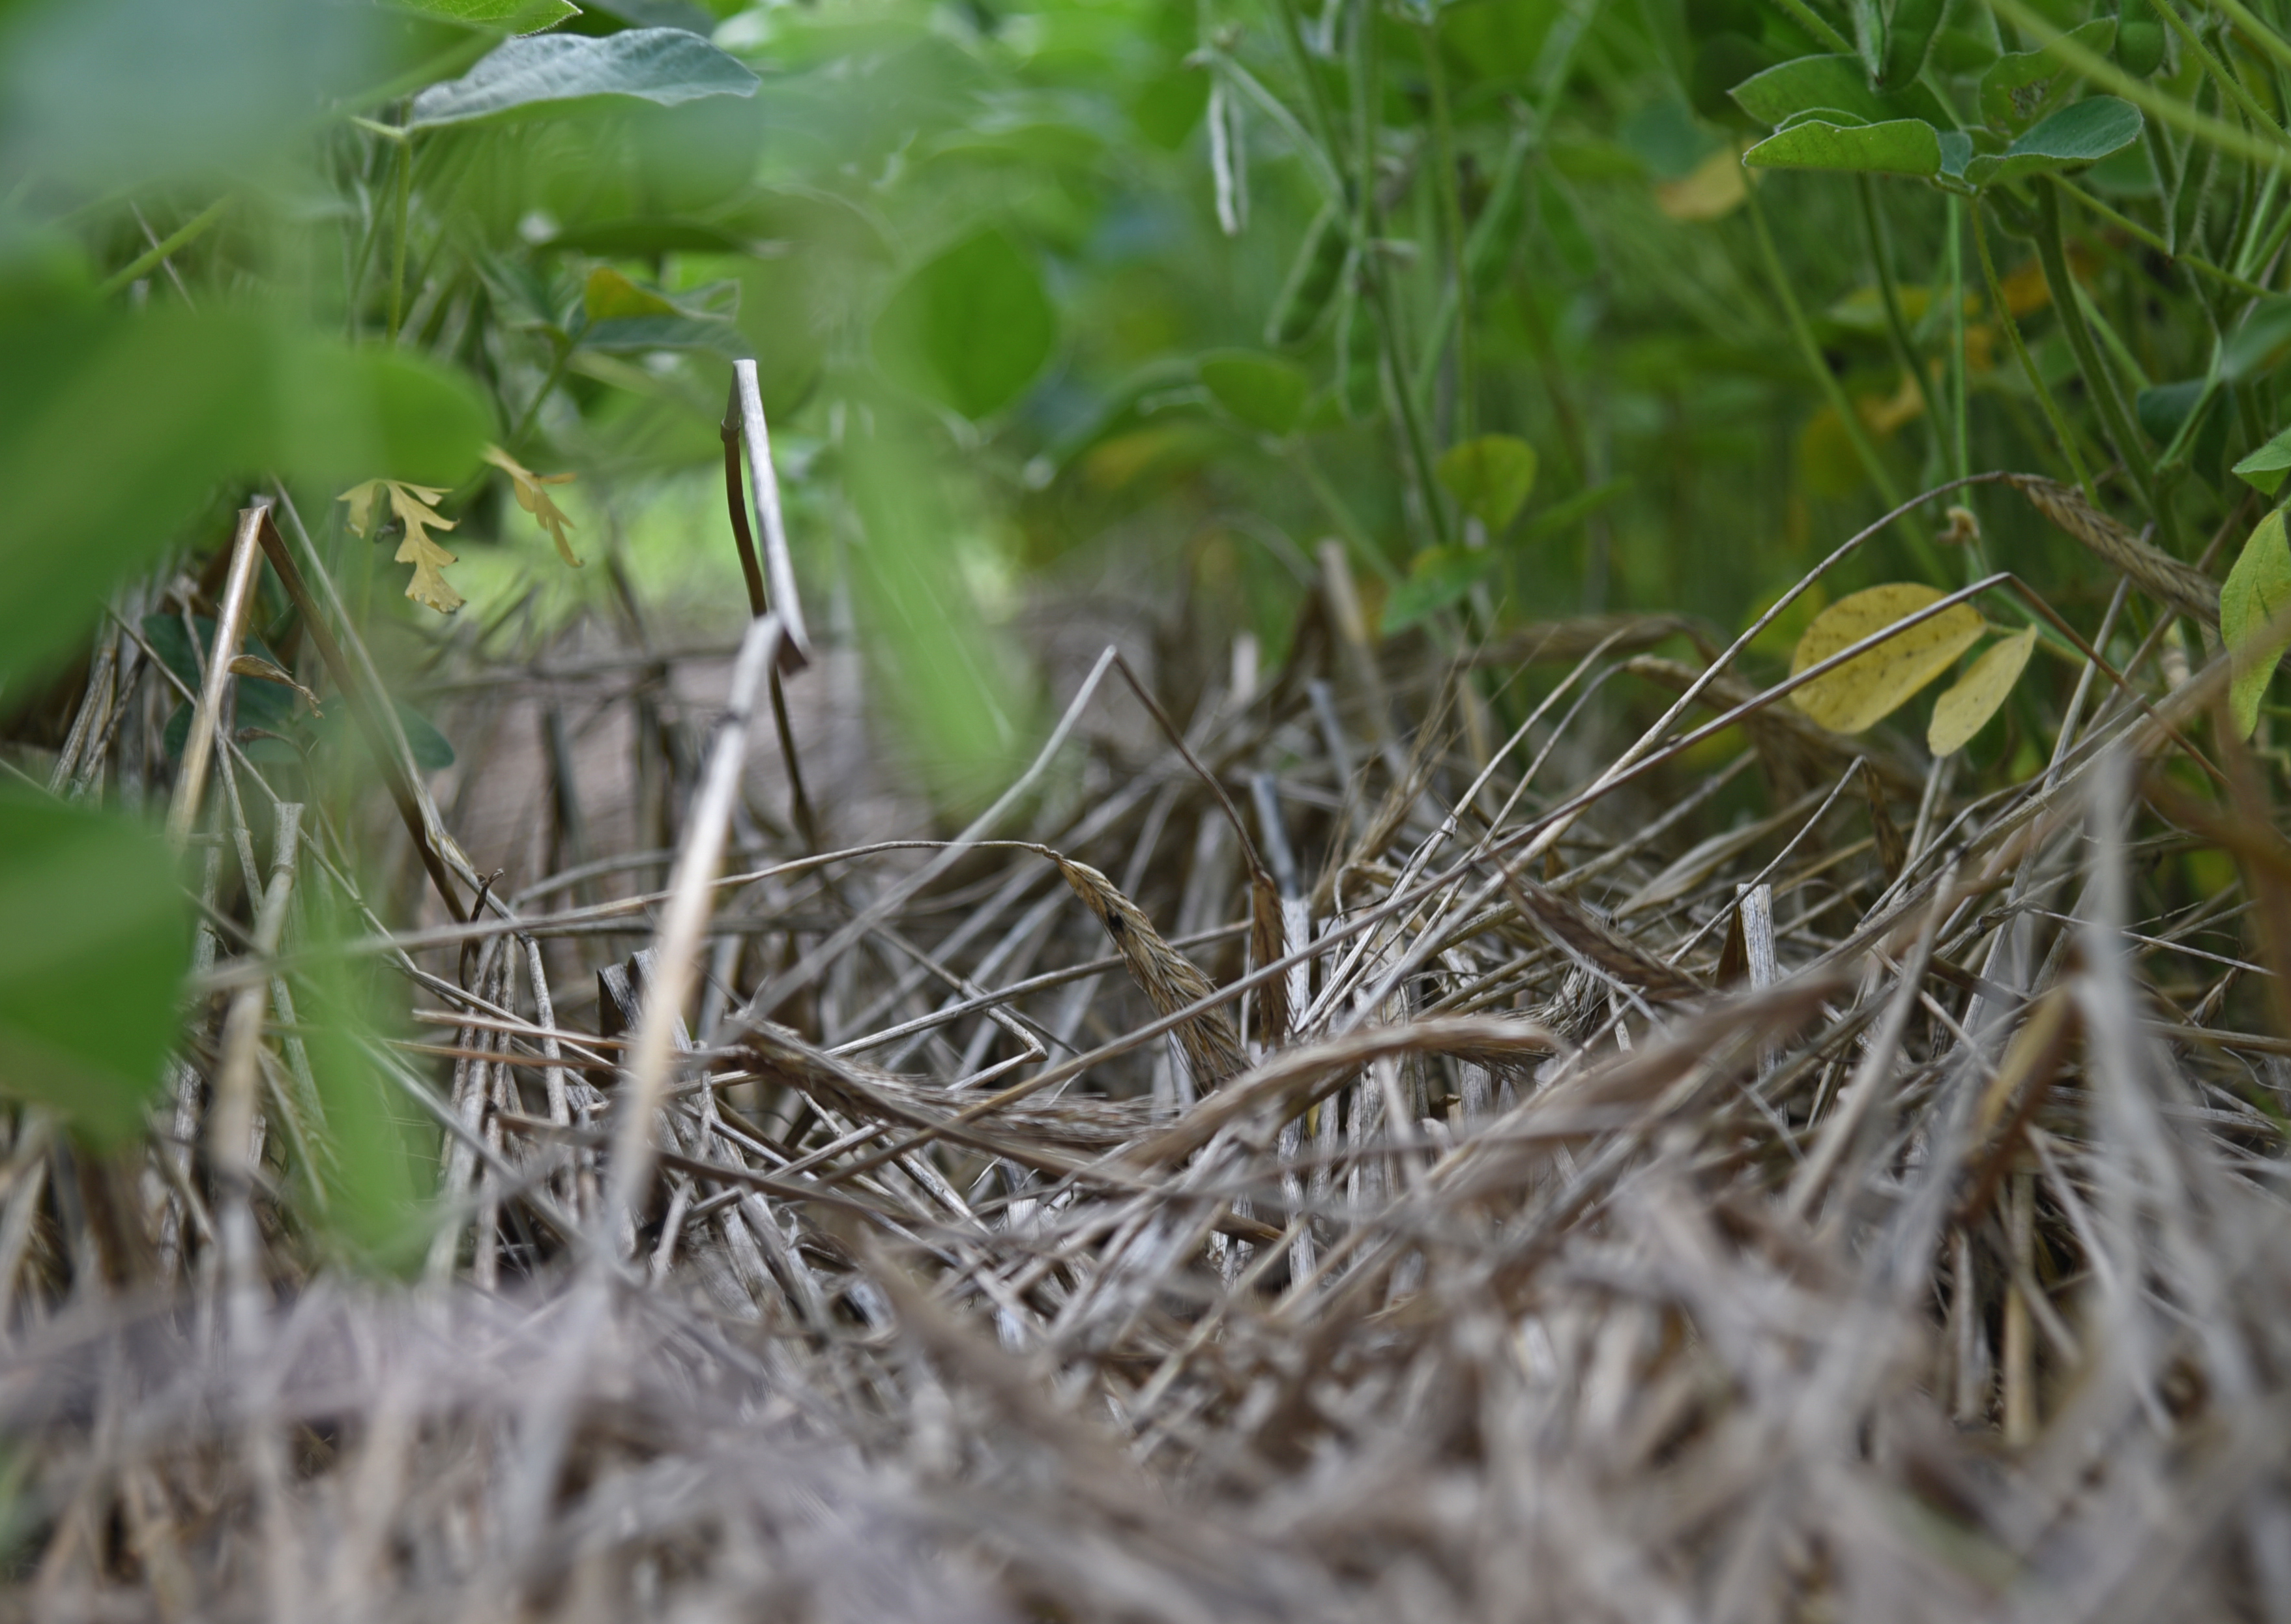
Annual ryegrass at heading stage
Annual ryegrass [Lolium perenne L. spp. multiflorum], also known as Italian rye, is commonly grown as a winter annual cover crop in New York State. Annual ryegrass was originally introduced from Europe to the United States during colonial times. About 3 million acres of annual ryegrass are currently grown as a cover crop in the United States. Annual ryegrass is often confused with perennial ryegrass (Lolium perenne L.) and rigid ryegrass (Lolium rigidum Gaud.), therefore close attention to identification characteristics between these species should be considered when distinguishing them. Annual ryegrass is generally taller than perennial ryegrass. For instance, annual ryegrass can grow 2 to 4 feet tall at full maturity, whereas perennial ryegrass can only grow 1 to 2 feet tall. Additionally, the red-tinged base of annual ryegrass also helps to distinguish annual ryegrass from perennial ryegrass, which is quite similar in growth habit and appearance. Annual ryegrass establishes quickly and grows vigorously and could become a weed if not properly managed. Annual ryegrass has been established as one of most problematic weeds in small grain cereals, row and vegetable crops as well as along roadsides in the United States. A recent survey conducted by the Weed Science Society of America (WSSA) has ranked annual ryegrass as the most troublesome and difficult to control weed in winter cereal grains. In the U.S., annual ryegrass populations have developed resistance to five different herbicide sites of action (WSSA groups: 1 2, 9, 10, and 15).
Problem of Annual Ryegrass Termination with Glyphosate
Mature annual ryegrass is generally difficult to kill with glyphosate if it is applied under suboptimal weather conditions (for instance, air temperature below 50˚ F). However, in spring of 2023, a grower in Livingston County in western New York State reported an inadequate kill during the termination of an annual ryegrass cover crop with two sequential applications of glyphosate (Roundup® or similar brands) at field-use rates (32 fl oz/a of Roundup®) (Figure 1). Similarly, in spring of 2024 and 2025, two separate field crop producers from Ontario and Genessee Counties reported termination failure of annual ryegrass cover crops with glyphosate (Figure 1). Annual ryegrass plants surviving glyphosate applications from these three fields in Livingston, Ontario, and Genesse Counties recovered, fully head out, pollinated and produced viable seeds.
Figure 1. Annual ryegrass cover crop plants surviving glyphosate applications in Livingston (A), Genesse (B), and Ontario (C) counties of western NY State (Photo credits: Mike Stanyard, CCE).
Glyphosate-Resistant Annual Ryegrass in New York
Greenhouse experiments were conducted at Cornell University Guterman Bioclimatic Laboratory in 2023 through 2024 to investigate if the annual ryegrass population from Livingston County, NY was resistant to glyphosate. Seeds of annual ryegrass plants surviving glyphosate applications from Livingston County, NY were tested along with a previously known glyphosate susceptible annual ryegrass population from Arkansas (Courtesy: Dr. Jason Norsworthy, University of Arkansas). Seedlings from both annual ryegrass populations (one from New York and the other from Arkansas) were grown separately in 4-inch plastic pots containing commercial potting mixture under greenhouse conditions. Seedlings of annual ryegrass from both populations were sprayed across a range of glyphosate doses (0, 3.3, 6.75, 13.5, 27, 54, 108, 216, and 432 fl oz/a of Durango®) along with 2% w/v ammonium sulfate (AMS) using a cabinet spray chamber when seedlings were at the 5- to- 6-leaf stage. Results indicated that Durango® applied at the field-use rate (27 fl oz/a) did not provide any control of the annual ryegrass population from Livingston County, NY at 21 days after application (DAA) (Figure 2). In contrast, plants from the Arkansas annual ryegrass population were all killed with this field-use rate of Durango® at 21 DAA. Furthermore, the annual ryegrass population from Livingston County, NY was not completely killed at the highest tested dose (432 fl oz/a) of Durango® at 21 DAA (Figure 2). Results further revealed that the annual ryegrass from Livingston, County had a 22-fold level resistance to glyphosate compared with the annual ryegrass population from Arkansas.
Figure 2. Response of annual ryegrass populations from Arkansas and New York State 21 days after treatment with Durango® (glyphosate) applied at 27 fl oz/a (field-use rate) and 432 fl oz/a (16 times the field-use rate) in greenhouse experiments at Cornell University (Photo credit: Vipan Kumar, Cornell University).
POST Herbicides for Termination of Glyphosate-Resistant Annual Ryegrass
An on-farm field study was conducted in spring of 2025 to test the effectiveness of alternative postemergence (POST) herbicides for termination of glyphosate-resistant annual ryegrass. A total of nine POST herbicide programs, including Select Max® (clethodim) at 16 fl oz/a, Assure II® (quizalofop) at 12 fl oz/a, Roundup PowerMAX® 3 (glyphosate) at 32 fl oz/a alone and in combination with Select Max® or Assure II®, Liberty® 280 SL (glufosinate) at 43 fl oz/a alone and in combination with Select Max® or Assure II®, and Gramoxone® SL 3.0 (paraquat) at 32 fl oz/a alone and in combination with Metribuzin 75 DF (metribuzin) at 4 oz/a were tested at their field-use rates for termination of glyphosate-resistant annual ryegrass. All herbicides were applied with appropriate adjuvants as recommended by each herbicide label using a CO2-operated backpack sprayer fitted with six AIXR110015 nozzles at 15 Gallons per acre, when annual ryegrass was headed out. Among all tested programs, Gramoxone® SL 3.0 alone or in combination with metribuzin, Liberty® 280 SL alone and in combination with Assure II® or Select Max® provided 92% to 100% control/kill of mature glyphosate-resistant annual ryegrass at 21 days after treatment (DAT) (Figure 3). In contrast, poor kill (10 to 25%) of glyphosate-resistant annual ryegrass was observed with Select Max or Assure II at 21 DAT.
Figure 3. Visual response of glyphosate-resistant annual ryegrass terminated with nontreated (A), Liberty® 280 SL at 43 fl oz/a (B), Gramoxone® at 32 fl oz/a (C), and Roundup PowerMAX®
Conclusions and Ongoing Research
Findings from this research confirm the first case of glyphosate resistance in annual ryegrass in New York State. Alternative POST herbicide burndown chemistries (including Liberty® 280 SL and Gramoxone® SL 3.0) can be used to terminate glyphosate-resistant annual ryegrass at or prior to planting of cash crops. We are currently investigating the status of these annual ryegrass populations for multiple herbicide resistance and underlying mechanism(s) of glyphosate resistance. We are planning to conduct on-farm field studies at multiple locations in New York State and in the northeastern region for developing cost-effective integrated strategies to manage the seedbank of glyphosate-resistant annual ryegrass in various field crops, including small grain cereals, soybean, and corn.
Kristen Loria1, Allan Pinto Padilla2, Jake Allen1, Christopher Pelzer1, Sandra Wayman1, Miguel I. Gómez2, Matthew Ryan1
1School of Integrative Plant Science, 2Charles H. Dyson School of Applied Economics and Management, Cornell University, Ithaca, NY 14853.
About the Cornell Organic Cropping Systems Experiment
The Cornell Organic Cropping Systems (OCS) experiment was established in 2005 at the Musgrave Research Farm in Aurora, New York to serve as a living laboratory for organic field crop management systems and provide practical insights to farmers. This ongoing long-term experiment compares four management systems along a dual spectrum of external inputs and soil disturbance over a multi-year crop rotation. An advisory board consisting of a dedicated group of organic farmers provides guidance on management decisions. The four systems are compared in terms of several sustainability indicators including yield, profitability, soil health and greenhouse gas emissions.
Both external input and soil disturbance gradients of the four treatment systems range from an extensive approach (low input) aimed at maximizing profitability by reducing costs via efficient resource use, to an intensive approach (high input), aimed at maximizing profitability by maximizing yield. Risk associated with low input management includes reduced crop production from inadequate soil fertility or weed competition, which can lead to decreased returns despite low input costs. Risk associated with high input management include diminishing returns where productivity increases are insufficient to justify additional cost.
The four management systems of OCS are: 1) High Fertility (HF), 2) Low Fertility (LF), 3) Enhanced Weed Management (EWM), and 4) Reduced Tillage (RT). In 2018, the crop rotation was modified from a three-year rotation to a four-year rotation based on advisor input.: This article includes an economic analysis of the complete four-year crop rotation cycle from 2018-2021, which consisted of: 1) triticale / red clover, 2) corn / interseeded cover crop mix, 3) summer annual forage mix / cereal rye cover crop, 4) soybean (Figure 1).
Figure 1. Four-year crop rotation for the OCS phase 2018-2021.
Looking back: key takeaways from past OCS cycles
Caldwell et al. (2014) compared the yields and the profitability during and after the initial phase of organic transition in OCS following two three-year rotation cycles (corn-soybean-winter spelt/red clover) from 2005-2010. The first three years were considered as transitional production years in which crops could not be sold as certified organic, while crops produced from 2008 to 2010 could be sold as such. They used flexible interactive crop budgets to calculate relative net returns based on crop yields, tillage, weed management and fertility practices and, after the three-year transition period, compared relative net returns of organic production with concurrent organic price premiums to Cayuga County yield averages with conventional crop production inputs and prices. With a 30% organic price premium, the relative net return of organic production in all systems except RT was positive. The RT system was excluded from most analyses due to major challenges with experimental ridge-till practices resulting in decreased crop competitiveness. For both corn and soybean phases averaged across entry points, relative net return in the HF system was significantly lower than LF or EWM, due to higher input costs without corresponding higher yields in the HF system. For the spelt phase averaged across entry points, relative net return was higher in HF than LF and EWM (though not significantly so), with increased input cost in the HF system corresponding with a yield increase. The HF system led to higher weed biomass over time than the EWM and LF systems.
Trial design and system differences
The Cornell Organic Cropping Systems experiment uses a split-plot randomized complete block design with four blocks. The main plot treatments are the four management systems, whereas subplot treatments are two crop rotation entry points (A and B) . Entry points A and B represent different phases of the crop rotation. For example, in 2018 entry point A was planted to triticale while entry point B was planted to soybean.
Treatment systems are arranged along a fertility gradient as well as a soil disturbance gradient (Figure 3). For triticale, summer forage, and corn, the HF system had a 50% higher fertilization rate than RT and EWM. LF received fertilizer rates 50% lower than RT and EWM on the same crops. Intermediate fertilizer rates were applied to both EWM and RT. With respect to soil disturbance, EWM received additional weed management operations in several crops, while RT and LF incorporated an organic no-till soybean phase. Overall number of primary tillage events was not substantially different between systems, though mechanical cultivation was reduced in the soybean phase for RT and LF.
Figure 2. Contrasting management approaches in four systems.
Crop yields across management systems
No matter the management system, crop yield is a key component of profitability. Yields across all four years of the cycle comprising five harvested crops are summarized below. Ryelage was only harvested in EWM and HF systems as the cereal rye cover crop was rolled-crimped for no-till soybean in LF and RT systems. Triticale was grown as a grain crop in EWM and HF and taken for forage in the LF and RT systems. Organic no-till practices were implemented in RT and LF systems only, with soybean planted into tilled soil in HF and EWM. In entry point A soybean yields were comparable across systems, but in entry point B organic no-till soybean yields were nearly half of cultivated yields, likely due to dry conditions in the soybean phase in 2018.
Table 1. Mean yields for all harvested crops across four management systems and crop rotation entry point from 2018-2021. Within an entry point, systems sharing a letter were not significantly different (p < 0.05). Means were not compared between entry points. Triticale in RT and LF systems was harvested as forage (lbs DM/ac) while in HF and EWM it was harvested as grain (lbs/ac). Means were not compared.
Net return of management systems
Net return subtracts total variable costs (TVC) of production (inputs + labor + equipment-associated costs) from gross income (crop yield x price). Prices for corn and soybean were obtained from the USDA organic grain report (USDA National Organic Grain and Feedstuffs Report, February 4, 2022). As commodity price references for triticale grain, cereal rye forage and summer annual forage were unavailable, prices were based those typically fetched for organic forage in NY (MH Martens and P Martens, personal communications, 2022). All operation-related costs were taken from Pennsylvania’s 2022 Custom Machinery Rates (USDA NASS 2023). To correct the absence of an inflation adjustment, crop prices and input costs used in this study were converted to real values using the U.S. Consumer Price Index (CPI), with 2016 as the reference year.
All values are denominated in U.S. dollars and represent the average annual revenue, production costs, and net return over four years. In the case of crop rotation entry point A, the LF cropping system exhibited the lowest Total Variable Cost (TVC). Conversely, the HF system had the highest TVC, which despite higher grain and forage yields, resulted in lower net return than LF, EWM and RT systems (Figure 4).
Overall, across four years of the crop rotation and in both crop rotation entry points (i.e., temporal replications of the trial) the EWM system maximized net return via intermediate fertility rates and relatively high yields, though the HF system yielded higher in both entry points Net return for RT and LF systems was more variable between crops and entry points, possibly indicating higher weather-related risk associated with those system approaches, i.e. reliance on cover crops for fertility in LF, and use of organic no-till management for LF and RT (Figure 4).
Figure 4. Comparison of net return and components across four systems in entry point A.
In entry point A, LF demonstrated higher net return than both HF and RT despite lower yields due to reduced input costs. Net return in RT narrowly surpassed HF due to lower input costs as well. In entry point B, LF ranked lowest in net return due to low grain yields across the rotation. HF ranked second and RT ranked third, with RT characterized by intermediate to low yields with intermediate input costs.
Figure 5: Comparison of net return and components across four systems in entry point B.
When net return of each management system is summarized by entry point, high variability in profitability was observed across entry points, largely due to yield differences between growing seasons of the same crop. Because management was nearly identical for each crop within each system across entry points, temporal variation in net return can be attributed to yield response from seasonal environmental or climatic factors either directly or in interaction with management. This highlights the complexity of systems experiments given year-to-year variation (Figure 6).
Figure 6: Net return comparison of all four cropping systems and two entry points.
Conclusions
Differences in yield and subsequent net return between systems varied significantly across entry points, making it difficult to draw conclusions on the most profitable system overall. However, the HF system had the lowest net return across entry points, indicating that input levels were likely higher than optimum and yield gains to justify increased inputs were not realized. EWM had the highest net return across entry points, indicating that intermediate levels of fertility combined with additional cultivation passes in the row crop phases and full tillage soybean production “paid off” as a management strategy, with increased labor or fuel costs outweighed by increased yields. Of course, this assumes availability of labor required which may be out of reach for some farms, and can be challenged by finite weather-related windows conducive to field operations.
Variability in net return between entry points was particularly high for the LF and RT systems, largely driven by yield variation in the soybean phase between temporal replications. For entry point B, intermediate corn yields and low organic no-till soybean yields drove low profitability in LF, while relatively high corn yield in RT partially made up for low organic no-till soybean yield. This variation in soybean yield highlights a challenge with an organic no-till management approach that dry conditions can reduce yields to a greater extent compared to a tillage-based approach. However, in an extremely wet year where adequate weed control was not possible, no-till management may pay off.
By accounting for system profitability only, this article does not consider other tradeoffs between systems such as soil health outcomes or greenhouse gas emissions from contrasting management, additional sustainability metrics to evaluate organic production system success.
References
Caldwell, B; Mohler, CL; Ketterings, QM; and DiTommaso, A. (2014). Yields and profitability during and after transition in organic grain cropping systems. Agronomy Journal, 106(3):871–880.
Gianforte, L personal communication. 2022.
Jernigan, A. B., Wickings, K., Mohler, C. L., Caldwell, B. A., Pelzer, C. J., Wayman, S., and Ryan, M. R. (2020). Legacy effects of contrasting organic grain cropping systems on soil health indicators, soil invertebrates, weeds, and crop yield. Agricultural Systems, 177:102719.
USDA National Organic Grain and Feedstuffs Report, February 4 2022. Agricultural Marketing Service.
John Wallace, Weed Management Extension Specialist, Penn State University
In the coming year(s), Penn State will be leading a regional, SARE-funded project to better understand the agronomic, environmental, and economic challenges that prevent the adoption of cover crop interseeding in field corn. The team is comprised of Penn State and Cornell University researchers and extension educators, the New York State IPM program, and several cooperating Soil and Water Conservation Districts in PA and NY.
Interseeding cover crops early in the corn growing season (i.e., V4-V6) can potentially increase the benefits of cover cropping in growing regions that struggle to establish fall-sown cover crops. Previous studies and on-farm trials in our region have demonstrated the benefits of interseeding with specialized grain drills for improving establishment rates. Best management practices for early interseeding have also been developed for this region, including cover species selection and herbicide management.
However, there has been less documentation of conservation and soil health benefits associated with early interseeding compared to either winter fallow or post-harvest cover crop seeding. Understanding these benefits, and potential management tradeoffs, will help understand the return-on-investment of this practice. Finally, there is a general consensus that early cover crop interseeding works better in certain growing regions and production systems than others. Defining the geographic and agronomic fit for cover crop interseeding is one of our project objectives.
If you are interested in following the project, or participating in on-farm trials, please take a moment to complete this brief anonymous survey (link below). This information will help the projectteam prioritize on-farm trials and extension-outreach programming in the coming year(s).
Sandra Wayman1, Lisa Kissing Kucek2, Virginia Moore3, Lais Bastos Martins4, Matt Ryan1 1Soil and Crop Sciences Section, SIPS, Cornell University, 2USDA ARS Dairy Forage Research Center, 3currently: NC State University. Feb 2021: Plant Breeding and Genetics Section, Cornell University, 4Crop and Soil Sciences, NC State University.
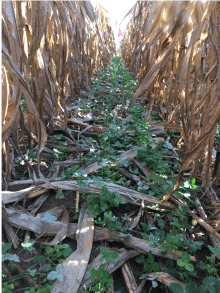
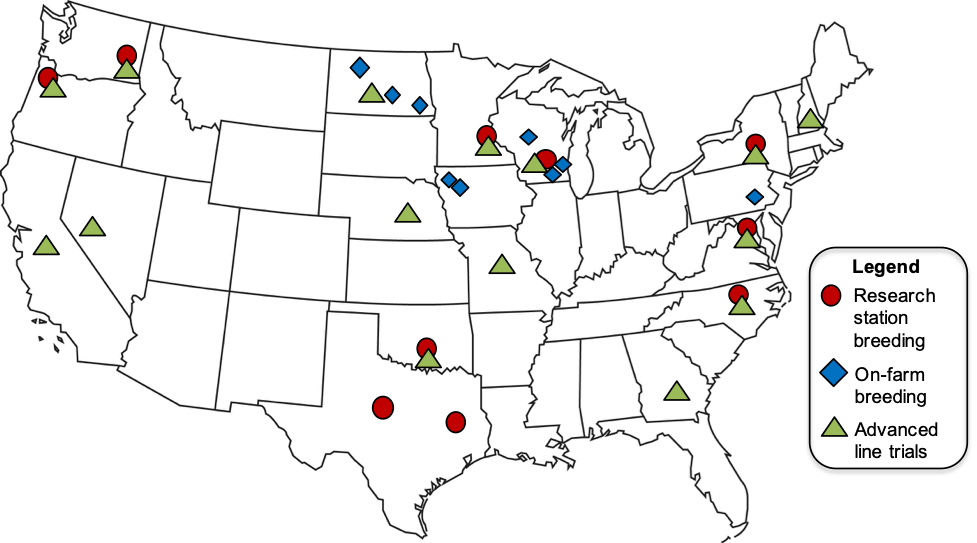
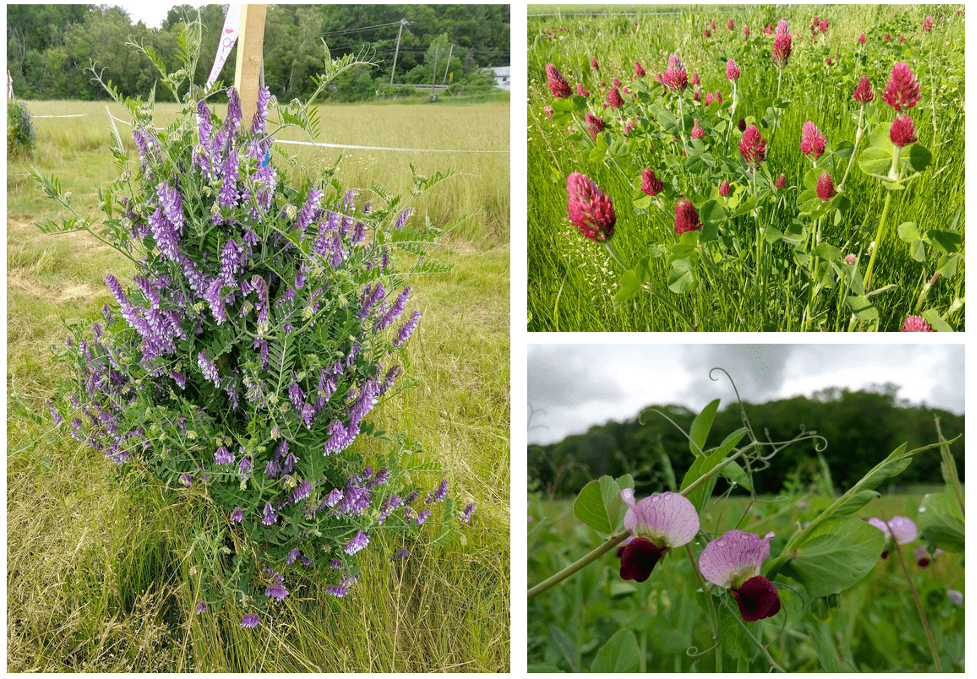
Legume cover crops have room for improvement Winter annual legume cover crops are essential management tools for organic farmers; they fix nitrogen, improve soil health, and suppress weeds. Winter annual cover crops are planted in the early fall, overwinter, then grow vigorously in the spring and complete their life cycle in the summer. However, many farmers struggle with these cover crops. Poor emergence, low vigor, and winter kill are basic challenges that could be addressed through plant breeding. Unlike cash crops, cover crops have received relatively little attention from plant breeders in the past. Thus, even modest investments in germplasm improvement could return large benefits. The Sustainable Cropping Systems Lab is taking advantage of this opportunity to improve legume cover crops for organic farmers by participating in the national Cover Crop Breeding Network (Fig. 1). Sites across the U.S. are developing cover crop lines best suited to each region. Our goal is to develop new varieties that boost the sustainability of organic farms, using classical plant breeding methods rather than genetic engineering. We are working with three species of winter annual legume cover crops: hairy vetch (Viciavillosa), crimson clover (Trifoliumincarnatum), and winter pea (Pisumsativum) (Fig. 2).
Figure 1. Sites participating in the legume cover crop breeding program.Figure 2. Left, hairy vetch; top right, crimson clover; bottom right, winter pea.
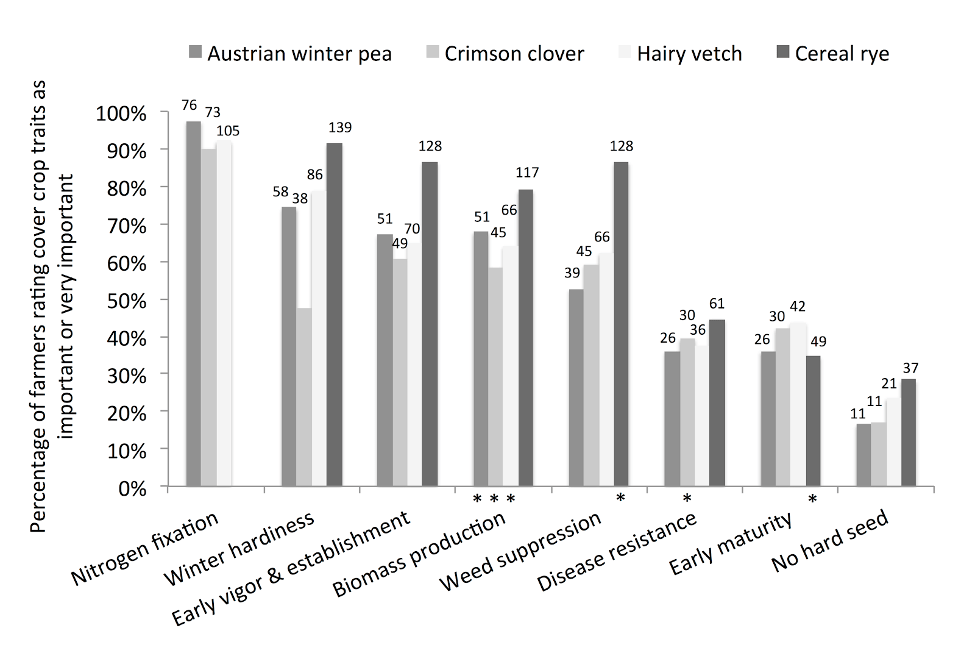
The traits farmers want To inform our breeding efforts, we conducted a national survey of organic and conventional farmers to learn which cover crop traits were important to them (Fig. 3, Wayman et al 2017). We received 417 responses to the survey, and 87% of the respondents reported they used cover crops. Organic farmers reported placing greater value on the ecosystem services from cover crops than did conventional farmers. The top four traits chosen by respondents as important for legume cover crops were nitrogen fixation, winter hardiness, early vigor and establishment, and biomass production (Fig. 3).
Figure 3. Percentage of farmers (organic and conventional together) who rated the given traits for four focus cover crops as “important” or “very important” out of total of five rating levels (“not at all important” to “very important”). Numbers above bars indicate count of farmer respondents for each cover crop and trait. Stars on bars indicate significant differences between conventional and organic farmers for that particular trait and cover crop (chi-square test, * is P < 0.05, *** is P <0.001).
Genetic improvement The steps in developing better cover crop varieties for farmers are 1) create better genotypes through breeding nurseries, and 2) select the best new varieties through advanced line trials. Researchers at different sites in the project are selecting for different legume traits based on their region. In the legume cover crop nurseries planted at Cornell University, we are selecting for winter-hardiness in addition to early-flowering.
We began the breeding program with seeds of hairy vetch, crimson clover, and winter pea from commercially available varieties, lines from worldwide breeding programs, landraces selected by farmers, and PI (plant introduction) lines from the U.S. National Plant Germplasm System Germplasm Resources Information Network (NPGS GRIN) seed bank.
For five seasons, we have planted breeding nurseries of the three legume cover crop species at our Cornell University site. We selected plants based on fall vigor, low winterkill, spring vigor, early maturity, and soft seed. We culled undesirable plants before flowering, and saved seeds from the best plants to replant in the following year. We selected between 2.8% and 4.6% of the hairy vetch individuals across the breeding seasons, and between < 0.01% and 2.8% of crimson clover individuals.
For winter pea, the first year of the breeding program evaluated the performance of accessions from the National Plant Germplasm System. The results informed what material to include in breeding nurseries. For the following three seasons, we planted and selected early generation breeding lines originating from the USDA-ARS Grain Legume Genetics Physiology Research Center in Pullman, WA. The best 0.5 to 1.4% of the winter pea plants were chosen as new breeding lines, based on winter survival and vigor. In 2019, the winter peas experienced severe winter conditions 900 feet above Cornell University’s campus, where almost all the winter peas died from winterkill.
Advanced line trials In the 2018-2019 and 2019-2020 seasons, our breeding lines were tested against commercial varieties in multi-environment advanced line trials. Sites across the country (Fig. 1) grew replicated plots of breeding lines and commercial checks of each legume cover crop species. Each trial grew the legume cover crops alongside triticale to simulate grass-legume cover crop mixes typically grown by farmers. Breeding lines of each crop were compared with commercial check varieties to assess if our breeding program has produced something better than what is currently available to growers on the market. Lines were evaluated for emergence, winter survival, fall and spring vigor, flowering timing, disease, and biomass. The best lines of each species will be tested again in the 2020-2021 season, and performance of these lines will determine variety release and commercialization.
Nursery and advanced line trial performance Testing variety performance is currently underway. An analysis of the advanced line trials will identify if any lines perform well across the U.S., or if certain lines excel in specific regions. Ideally, we would find a few breeding lines performing well across all sites. Such “broadly adapted” lines could be sold as varieties nationwide. If certain lines are excellent in specific regions, however, seed companies are interested in selling lines as “regionally adapted” varieties. In the meantime, data from the breeding nurseries indicated patterns in regional performance. The results suggest different trends among species, which are detailed below.
Hairy vetch We found no hairy vetch line that performed best in both the fall and spring (Kissing Kucek et al. 2019). Instead a tradeoff between fall growth and spring growth was observed. As a result, the breeding program is screening and selecting for vigor at both times of the year, with the goal of finding ideal lines that have the best overall seasonal performance.
Over two seasons and a dozen U.S. sites (Fig. 1), we tested 16 hairy vetch breeding lines and six checks. Breeding lines developed by the Cover Crop Breeding Network beat the commercial check lines in both years. Winning lines, however, differed among sites. Colder northern environments had different winning breeding lines than warmer southern and western sites. Our Cornell University site proved to be an intermediate winter environment compared with the harsh upper Midwest and mild southeast and west. In cold winters like 2018-2019, Cornell University shared winning lines with MN, WI, and NE. In contrast, during warm winters like 2019-2020, NY was more similar to southern and western sites. These results suggest that the best performing lines in NY may vary depending on weather conditions, with warmer years in NY mimicking southern and Mid-Atlantic sites, and colder winters grouping NY with the northern Midwest. To select for resilient lines that can handle variable winter conditions, Cornell University breeding nurseries include material from warm and cold regions of the U.S.
The 2018 hairy vetch line from Cornell University was the second highest seed yielding in our OR trials, demonstrating 25% more seed yield than checks (Hayes and Azevedo, 2019). High seed yield is a very desirable trait for seed growers and seed companies.
Crimson clover Two commercially available varieties of crimson clover, ‘Dixie’ and ‘Linkarus’ were included as checks in our trials. ‘Dixie’ is a variety developed in GA that exhibits high forage biomass production, ability to reseed, and high amounts of hard seed (Hollowell 1953). ‘Linkarus’ is a highly productive winter hardy crimson clover which was developed in Germany. In general, we have seen ‘Dixie’ perform well in the southern locations, while ‘Linkarus’ performs better at northern locations. In the harsh NY winter of 2018-2019, our breeding lines beat both ‘Dixie’ and ‘Linkarus’.
In two seasons, we also evaluated crimson clover breeding lines for biomass production at Cornell University. Biomass production is important for all farmers, who often use crimson clover as a green manure. The crimson clover lines with the highest biomass production were included in the next season’s nursery. At our Cornell University site in 2018, ‘Linkarus’ had the highest biomass production, with 1.5 to 2.9 times more biomass production than ‘Dixie.’ Additionally, to compare top-performing lines from nursery selections at a dozen sites across the country, we tested 13 crimson clover breeding lines and 2 checks over two seasons. In the first season, a soft-seeded MD breeding line produced the most biomass, followed by ‘Linkarus’ and a Cornell University breeding line. In the second season, ‘Dixie’ produced the most biomass, followed by a MD breeding line.
Breeding lines have also been tested for seed yield in OR, where most crimson clover seed is produced. The two checks beat all breeding lines for seed yield (Hayes and Azevedo 2019). As a result, we have increased our focus on selection for seed yield in the crimson clover breeding program.
Winter pea In NY, winter peas have often been challenging for farmers due to poor winter survival. In the 2017-2018 season, 0.5% of plants were selected based on winter survival and vigor. Their seed is currently being increased so they can be included in future advanced line trials. In the 2019-2020 season, our Cornell University site experienced optimal weather to discriminate cold tolerance. Data from 39 new and different genotypes helped us choose the entries with the best potential to be increased for the advanced line trial.
Over two seasons, we tested 21 winter pea lines and five checks in our advanced line trial. In the 2018-2019 season, the winter pea advanced line trials did not survive at Cornell University and in MN due to harsh winter conditions. Southern locations (CA, GA, NC, OR) of the advanced line trials had overall higher biomass production than did the northern locations (MD, MO, NE, WI) in 2018-2019. Across all sites, our breeding lines performed better than the checks. Indeed, one of our breeding lines was in the top five performers across five different locations, showing good potential for release as a variety. Many of our breeding lines performed better than the two commercially available cultivars in the trial.
An additional observation for winter pea is that lines with the highest vigor in fall may have poor biomass production in the spring. This is not uncommon in peas; if the plants grow too much in the fall their exposed above-ground biomass is susceptible to frost damage and winter kill.
Next steps As part of this project, we will release varieties of legume cover crops adapted to specific regions. Our next steps include selecting for high-vigor and improved material in our nurseries, continuing advanced line trials with this new material, planting seed increases, and inviting farmers and seed company representatives to the breeding sites to evaluate the lines. We planted a third year of advanced line trials in 2020, after which we will determine if any lines are consistently high performers and good candidates for variety release.
Cover Crop Breeding Network team member coming to Cornell In February 2021, a Postdoctoral Scholar with the team, Virginia Moore, will join Cornell as an Assistant Professor with SIPS in the Plant Breeding and Genetics Section. Virginia’s program will focus on breeding for sustainable cropping systems. Virginia has been involved in the national Cover Crop Breeding Network as a project manager since 2019. She is currently based at USDA-ARS in Beltsville, MD, and completed her graduate work at the University of Wisconsin, with a MS in Agroecology and Agricultural & Applied Economics and a PhD in Plant Breeding & Plant Genetics. She sees plant breeding as a powerful tool to increase sustainability of cropping systems, with goals like a) reducing pesticide inputs through breeding for pest resistance, b) increasing cover crop adoption by developing regionally adapted cultivars, c) selecting crops for organic systems, and d) diversifying cropping systems through rotations and intercropping. She is excited to continue working in cover crop breeding and to take on new crops including alfalfa and other forages, hemp, and switchgrass.
Acknowledgements: Thanks to Gerald Smith for sharing data and resources. Thanks to Chris Pelzer, Katherine Muller, Dylan Rodgers, James Cagle, Nina Sannes, and Matt Spoth for help planting the nurseries.
References Hayes, R and M. Azevedo. 2019. Seed yield of hairy vetch and crimson clover breeding lines. Raw data available upon request.
Hollowell, E. A. 1953. Registration of varieties and strains of crimson clover (Dixie crimson, Reg. No. 1). Agron. J. 45:318-320
Kissing Kucek, L.; H. Riday; et al. 2019. Environmental influences on the relationship between fall and spring vigor in hairy vetch (Vicia villosa Roth). Crop Science. 59:1-9
Wayman, Sandra & Kissing Kucek, Lisa & B. Mirsky, Steven & Ackroyd, Victoria & Cordeau, Stéphane & Ryan, Matthew. (2017). Organic and conventional farmers differ in their perspectives on cover crop use and breeding. Renewable Agriculture and Food Systems. 32. 376-385. 10.1017/S1742170516000338.
Elson Shields, Entomology Department, Cornell University
The increased adoption of cover crops as a soil conservation and soil health building strategy is not without increased risk from insect pest problems. Increased insect pest risk can be managed with a combination of timely killing of the cover crop, pest scouting, and additional timely application of insecticide.
The best-case scenario for the management of the cover crop to reduce insect risk is to kill the cover crop far enough in advance that the cover crop is completely dead prior to the planting of the crop. Foliar feeding insects often can survive on the dying cover crop, and if the new crop emerges before the cover crop is completely dead, the foliage feeding insects simply move from the dying cover crop onto the newly emerged and tender crop plants. This is termed a green bridge.
The worst-case scenario for insect risk is to plant into a green cover crop which has been rolled prior to planting and then sprayed with an herbicide to kill it after the crop has been planted. This provides an excellent green bridge for the insects, like black cutworm larvae and armyworm larvae, to move directly onto the newly emerging crop.
Cover Crop Bridging Insects:
Black cutworm: Black cutworm is a long-ranged migrant which overwinters in the southern US. Moths typically arrive in NY during mid-April to early-May on the early weather systems. Moths are attracted to grassy areas, grassy cover crops, grass waterways, and fields with grassy weed problems. Eggs are laid on these plants and larvae begin feeding on these plants. In the situations where producers kill the cover crops or grassy weed areas with herbicide or tillage, the black cutworm larvae continue to feed on the dying plants for 1-2 weeks. When corn seedlings start emerging, the existing larvae then move from the dying plants onto the growing corn. Since black cutworm larvae do not start their cutting behavior until mid-size (L-4), the early larval development on the grassy weeds is a critical association with the economic association of black cutworm to seedling corn. In the situations where eggs are laid on emerging corn, corn development to V6, a stage where black cutworm has difficulty cutting occurs before the black cutworm develops to the larval stage where they begin cutting (L4).
Since black cutworm larval development on existing plants in the field prior to the planting and emergence of the corn is a critical component in the development of economic infestations, the management of the green plants prior to corn planting is important. Elimination of the green bridge between the cover crop and/or grassy weed cover at least 2 weeks before the emergence of corn seedling dramatically reduces the risk of a black cutworm infestation in NY corn fields. If the separation between the killing of the cover crop/grassy weeds and the emergence of the corn crop cannot be at least 14 days, the corn seedlings need to be scouted for the presence of foliar feeding, early cutting and the presence of larvae. To the trained eye, pre-cutting foliar feeding is very obvious and easily detected.
Armyworm: Armyworm is a long-ranged migrant similar to black cutworm, but often arrives 15-30 days later in NY. It overwinters in the southern US, and the moths emerging in April in the south use the weather systems to move long distances. When the moths arrive, they are attracted to grass hay fields or grassy cover crops. If the eggs are laid in the hay field, larvae will feed on the grass and only move when the field has been stripped, thus the name armyworm. Neighboring corn fields are then attacked by the larger marching larvae. When eggs are laid in a grassy cover crop, the larvae will feed on the cover crop until it is stripped before moving. If corn is emerging in the cover crop, they will simply move onto the young corn plants. Armyworm larvae are totally foliage feeders and do not cut plants like black cutworm. With timely scouting, this insect is easily controlled with an application of foliar insecticide. Usually, the infestation is missed until the field is stripped and the larger larvae are moving into a neighboring field.
Seed corn maggot: Seed corn maggot (SCM) adults (flies) are attracted to decomposing organic material. This organic matter can range from animal manures to decomposing plant material/killed cover crop. Fresh decomposing organic matter is more attractive to the flies for egg deposition than composted organic matter; although, SCM will also lay eggs in composted organic matter. Adult flies are present for egg laying from early May until late September. The highest risk fields for SCM problems would be a green manure crop covered with a thick layer of animal manure prior to planting the crop. High manure application rates without thorough incorporation before planting of large seed crops is a high SCM risk field. Damage from SCM is plant stand reduction, and without insecticide protection, plant stands can be reduced 30%-80%. The primary reason for insecticide treatment (Poncho, Cruiser, etc) on large seed crops (corn, soybeans) is protection against SCM-related plant stand loss. Under extremely heavy SCM pressure, the insecticide seed treatment can be overwhelmed, resulting in corn/soybean stand losses.
To reduce risk from SCM, cover crops should be killed and allowed to turn brown before planting the season’s crop. In addition, applications of manure should be subsurface rather than surface applied.
Wireworms: Adult wireworms (click beetles) are attracted to small grains, grass fields, run-out alfalfa fields which are mostly grass, and grass-based cover crops. Adult beetles search out these hosts during the growing season (June-August) and lay eggs. The larvae (wireworms) hatch and feed on a wide array of roots for multiple years. In cropping sequences where grassy/small grain/cover crops are present in the field during the June-August period, wireworms feeding on new seedlings and root crops can become an economic problem. While corn is technically a grass, wireworms do not find corn fields attractive for egg laying. However, small grains are very attractive. Generally, spring planted grains are more attractive than fall planted grains which mature in early summer. In conventional production systems, the insecticide seed treatment generally is effective at reducing the impact of wireworm feeding. However, in the organic production system, there are no effective rescue treatments for wireworm infestations/feeding damage. If grassy cover crops are the only grass in the cropping sequence, timely crop termination before June will reduce the attractiveness to wireworms for egg laying.
White grubs: In NYS, there are two different groups of white grubs which can be problematic. The first group is the native white grubs which have multi-year life cycles and the second group is the invasive annual white grubs (Japanese Beetle, European Chafer). Adults from both groups are attracted to grassy habitats to lay their eggs during mid-June to mid-July. Eggs hatch during August, and the larvae begin to feed on grass roots. In the case of the invasive annual white grubs, the larvae grow quickly and achieve more than 50% of development before winter. In the spring, the larvae resume development and are quite large when the grassy field is rotated to corn or soybeans and the new plants are quite small. Plant death is caused by these large larvae feeding on plant roots faster than the plant can generate roots. Larvae become adults in June and the cycle repeats. In the case of the native multiyear white grubs, the life cycle is similar but larval development requires 2-4 years depending on the species. Subsequent crops following the grassy/cover crop/small grain field are then impacted differently. With annual white grubs, the damage to the subsequent crop is confined to the following year only. In the case of native white grubs, subsequent crops could be impacted up to 4 years with declining damage levels each year.
The following two different cropping scenarios seem to place subsequent crops at higher risk. The most common case is the alfalfa field which has become mostly grass or a grass hay field which is then rotated into a large seed crop like corn or soybeans. The second scenario is the field which has been planted to a grass-based cover crop and not killed during the June-July egg laying period. In most cases, the insecticide seed coating on all corn and some soybean seeds reduce the impact of white grubs on subsequent crops. High white grub populations can overwhelm the insecticide, however.
Slugs: Increasing the organic soil cover with either the use of cover crops or last year’s crop waste increases the slug problem. In cool wet springs, which slow plant emergence and growth, damage from slug feeding can be severe. There is a little anecdotal evidence to suggest the presence of green cover reduces the slug damage because of the surplus of green tissue. In these cases, slugs miss the newly emerging plants and feed on the green cover crop.