Joseph Amsili, Aaron Ristow, Márcio Nunes, Harold van Es, Robert Schidelbeck, Mike Davis
Soil and Crop Sciences, Cornell University and Cornell University Agricultural Experiment Station
Take-Aways:
- Corn N Calculator (CNC) N rates based on realistic yields expectations were on average 59 lbs N acre-1 higher than Adapt-N rates, but did not result in yield increases.
- Adapt-N nitrogen (N) rates led to 58% (clay loam) and 68% (loamy sand) less nitrate leaching compared to CNC N rates.
- Adapt-N rates resulted in savings of $29 acre-1 compared to CNC N rates.
The over-application of nitrogen (N) fertilizer leads to large environmental problems and represents a considerable financial cost to the farmer. Despite these issues, farmers tend to over-apply nitrogen due to the difficulty of predicting the economic optimum N rate and the need to ensure high yields. Static N rate tools, like Cornell’s Corn N Calculator (CNC; http://nmsp.cals.cornell.edu/software/calculators.html), are promoted widely but don’t capture the dynamic interactions between site-specific weather, soil, and management variables. Adapt-N (http://www.adapt-n.com), a dynamic-adaptive N recommendation tool, was designed to integrate real-time weather and site-specific soil and management data to predict the optimum N rate.
In previous studies, it was demonstrated that Adapt-N can produce comparable yields to static N models and grower selected rates, while reducing overall N inputs (What’s Cropping Up article on comparing static and Adaptive N Tools; What’s Cropping Up article on comparing Adapt-N and CNC Tools). Yet no field experiments had been conducted to compare the effects of Adapt-N and a static N calculator on measured nitrate leaching. This study utilized two long-term tillage experiments to measure the effects of modeled N rates (Adapt N vs. CNC), soil type (clay loam vs. sandy loam), and tillage practices (no-till vs. plow-till) on nitrate leaching.
Methods
Adapt-N and CNC nitrogen recommendations were superimposed onto two long-term tillage experiments (plow and no-till) at the Cornell Willsboro Research Farm for four years (2014-2017). The trials were done on contrasting soil types, one on a Muskellunge clay loam and the other on a Cosad loamy fine sand. Nitrogen rates included 15 lbs N/acre as starter fertilizer and the rest was side-dressed approximately six weeks after planting. CNC N rates were calculated using accurate yield potentials for each plot at the two sites (default yield potentials in the tool are unrealistically low). Adapt-N recommendations were developed considering plot-specific soil textures, organic matter contents, rooting depths, crop rotations, tillage practice, crop cultivar and population, previous N applications, drainage, and yield potentials, as well as daily weather information and grain and fertilizer prices.
Corn silage yield was collected each year by hand harvesting two 5 m corn rows at three locations per plot. Drainage water samples were collected on 14 dates between April 2015 and October 2017 (Figure 1) on dates when the drain lines discharged. Water samples were analyzed for nitrate, NO3–, and nitrate, NO2–, which we simply refer to as nitrate in this article because the nitrite fraction is generally less than 1%.
Results and Discussion
Nitrogen rates and Yield
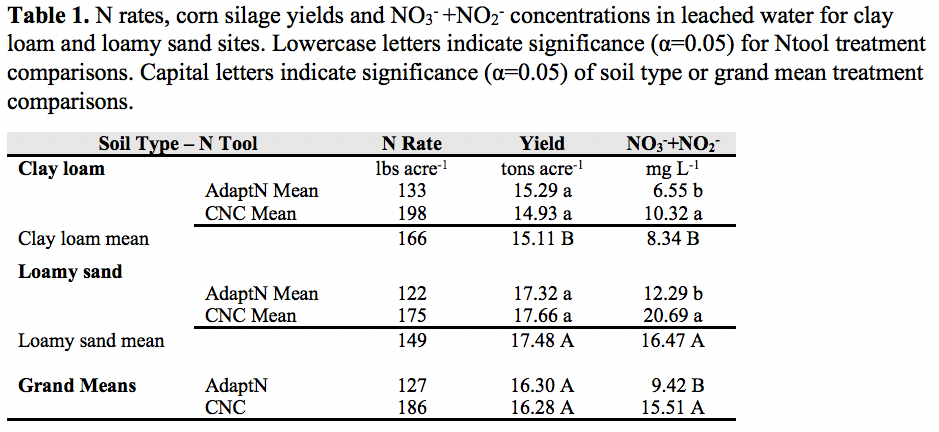
The CNC tool calculated 59 lbs acre-1 higher average N application rates than Adapt N (186 vs. 127 lbs N acre-1; Table 1). There were only two instances (both wet seasons on the clay loam soil) where Adapt-N predicted higher N rates than the CNC tool.
Soil type had a very strong effect on corn silage yield, which were 2.37 tons acre-1 higher in the loamy sand plots than the clay loam plots. Despite a lower yield potential for the clay loam site, the mean recommended N rate for that soil was 17 lbs acre-1 higher than the loamy sand site. This indicates that both N tools assume a lower nitrogen use efficiency (NUE) for finer textured soils.
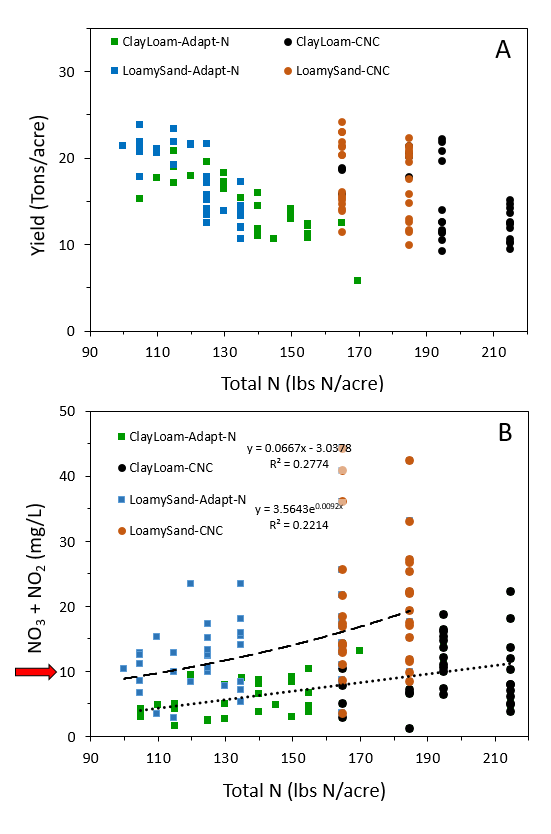
While CNC N rates were much higher than Adapt N rates, they did not result in increases in yield (16.28 vs. 16.30 tons acre-1; Table 1). We found no relationship between N rate and yield as equally high yields were achievable at 100 lbs N acre-1 with Adapt-N as with CNC rates higher than 180 lbs N acre-1 (Figure 1). The Adapt-N rates resulted in calculated savings of $29 acre-1 (based on a fertilizer price of $0.50 lb N-1) compared to the CNC N rates since yields between the N tools were indistinguishable.
Nitrate Leaching
Soil type and N Tool were important drivers of nitrate leaching in this study. Nitrate leaching averaged two times higher in sandy loam soils than clay loam soils (16.47 vs. 8.34 mg NO3–+NO2– L-1; Table 1) despite slightly higher N rates for the clay loam soils. This “missing” nitrogen in leached waters under the clay loam soils suggests that denitrification is an important N loss pathway in these finer textured soils, which is a well-documented phenomenon.
In addition to higher fertilizer costs per acre, CNC N rates led to 58% higher nitrate leaching in clay loam soils (10.32 vs. 6.55 mg NO3–+NO2– L-1) and 68% higher nitrate leaching in loamy sand soils (20.69 vs. 12.29 mg NO3–+NO2– L-1) compared to Adapt-N (Table 1). Increases in nitrate leaching were proportionally larger than the increases in N rates (46 % higher for CNC than Adapt N for clay loam; 43% higher for loamy sand). This pattern indicates that N rates above the optimum have disproportionately large environmental impacts. Also, average nitrate concentrations in leached water under CNC plots exceeded the U.S. EPA drinking water standard of 10 mg NO3– L-1 for both soil types. But nitrate concentrations under Adapt-N plots only exceeded the EPA standard at the loamy sand site.
Despite high variability in nitrate concentrations at different sampling dates, there was a positive relationship between N rate and nitrate concentrations in leached water (Figure 1). The exponential relationship suggests that nitrate leaching is more sensitive to increasing N rates on loamy sand soils than clay loam soils (Figure 1). We noticed that extremely high nitrate concentrations (> 50 mg NO3–+NO2– L-1) in leached water in loamy sands occurred after long dry periods (e.g., in the 2016 growing season) under CNC N rates, but not Adapt-N rates.
Tillage effects were modestly significant and on average the mean nitrate concentrations were 45% higher for the plow than no-till in the clay loam and 5% higher in the loamy sand.
Conclusions
This study compared the static Corn N Calculator and Adapt-N and showed that the CNC seriously over-predicts the optimum N rate when based on realistic corn yields because the higher N rates did not result in yield benefits. Use of Adapt-N led to savings of $29 acre-1, reduced nitrate leaching by between 58% (clay loam) and 68% (loamy sand), and helped keep nitrate concentrations in drain water below or near the U.S. EPA drinking water standard.
Acknowledgements:
Research was funded by the Northern New York Agricultural Development Program, USDA-NRCS, and New York Farm Viability Institute.


