Series: Phosphorus and the Environment 4. Greatly Improved Nutrient Efficiency Demonstrates New York Dairy Farmers’ Environmental Stewardship

Lisa Fields, Cornell Nutrient Management Spear Program Contract Writer

The deadline has been looming for years: all states that are part of the Chesapeake Bay Watershed must reduce nitrogen (N) and phosphorus (P) loads from agricultural sources by 2025. The Environmental Protection Agency (EPA) has set a Total Maximum Daily Load (TMDL) for N and P for each state to achieve water quality goals for the Chesapeake Bay region. The headwaters of the Chesapeake Bay Watershed originate in New York’s Upper Susquehanna Watershed (USW) and include part or all of 17 New York counties (Figure 1).

Figure 1: Upper Susquehanna watershed. Courtesy of Chris Yearick, Upper Susquehanna Coalition.

In 2009, the annual nutrient load delivered to the Chesapeake Bay from USW agriculture was estimated to be 4.54 million pounds of N and 0.53 million pounds of P. The EPA set the 2017 target nutrient load for the USW at 3.79 million pounds of N and 0.45 million pounds of P, with target annual 2025 TMDLs at 3.04 million pounds of N and 0.36 million pounds of P. The 2025 target represents N and P reductions of roughly 33% from the 2009 estimation of these nutrient inputs from USW farms.

Although it is too soon to know if the 2017 total nutrient load targets from USW farms will be achieved, a recent study published in the Journal of Soil and Water Conservation (‘Upper Susquehanna watershed and New York State improvements in nitrogen and phosphorus mass balances of dairy farms.’[1]) suggests that, collectively, farms have already significantly reduced N and P use over the past ten years without sacrificing productivity. The reported downward trend in N and P imports onto dairy farms means a reduced risk of N and P losses to the environment, as well as greatly improved nutrient efficiency.

The study reports the analyses of whole-farm nutrient mass balances (NMBs) completed by 189 New York dairy farms, including 91 located in the USW. The NMBs were completed through the collaborative effort of farmers, private sector certified crop advisors and nutrient management planners, Soil and Water Conservation District staff, and the Upper Susquehanna Coalition (a network of the 17 Soil and Water Conservation Districts in New York and 3 in Pennsylvania). Cornell Cooperative Extension staff, and Cornell faculty and staff were also highly involved.

The trend study shows that, in 2004, the USW farms averaged an N balance of 77 lbs/acre and a P balance of 9 lbs/acre. In 2013, that average decreased to 46 lbs N/acre and 5 lbs P/acre. These reductions represent a significant effort of successful nutrient conservation by the farms in the study. In addition, assuming all USW dairies can achieve similar reductions, an extrapolation of these findings shows nutrient imports onto farms could be reduced to 9.5 million lbs of N and 0.9 million lbs of P when comparing 2013 versus 2004 (Table 1). This indicates that USW farms may be able to achieve the 2025 TMDL goals.

The whole-farm NMB diagnostic tool was developed over 30 years ago to quantify the nutrient status of New York dairy and livestock farms.[1] Over the past 15 years, it evolved under the direction of the Cornell Nutrient Management Spear Program, led by Professor Quirine Ketterings. The NMB reports that farmers receive after they submit their data include the N, P, and K balances (imports minus exports) in pounds per tillable acre and pounds per 100 pounds of milk produced. Typically, the imports are dominated by concentrate feed purchases, with fertilizer nutrients playing a secondary role. The nutrients in milk are the largest source of exports, with exports in the form of animal and crop sales playing a smaller and more variable role among individual farms.

The 189 farms that comprised the NMB dataset represented the wide range of farm sizes and management practices found across New York. Herd size ranged from 20 to well over 1,000 animals, with 71% at less than 200 cows and 29% CAFO sized herds (more than 300 animal units; one animal unit is 1,000 lbs). Milk production across all farms and the 10 years of NMB data ranged from just under 8,000 to over 30,000 pounds per cow per year. Ten percent of all New York dairy farms are CAFO sized, so the non- USW farms in the NMB dataset had a higher percentage of CAFO farms than dairy farms overall in New York. The NMBs from the USW farms closely represented average New York farm size and milk production, with 88% animal feeding operations (AFO) and 12% CAFO, and an average milk production of just over 18,500 pounds per cow per year.

Figure 2: Feasible balances for N, P, and K for New York. Farms that meet the feasible balance per acre and per 100 lbs of milk produced are in the “green box”.

The NMB data from the 189 farms reveal that feed efficiency was the largest factor in the nutrient reductions achieved by New York farms over the ten years of the study. This was accomplished by the fine-tuning that occurred from adopting precision feed management practices that led to higher forage diets. Feeding higher levels of homegrown forage reduced both the quantity and nutrient concentration of purchased concentrate feeds. Decreased imports of fertilizer nutrients also played a role on farms where manure management efficiency was improved and some farms increased nutrient exports in the form of forage sales over the study period as well. Although improved efficiencies reflected by lower NMB numbers are no guarantees of a better economic bottom line, they can contribute to improved financial sustainability. Farm participation in the annual NMB program has been, and remains, voluntary, so trends shown are a testimony to farmers’ opinion that the time involved is a sound investment.

In recent years, the authors of the Journal of Soil and Water Conservation article defined guidelines for interpretation of NMBs by combining balances per tillable acre and per 100 pounds of milk produced. Those farms that meet the “feasible balances” for both the balance per acre and the balance per 100 pounds of milk, are operating in the “optimal operational zone,” termed “the green box” (Figure 2 shows the green box for N, P, and K).

Numbers falling below the green box are not desirable over the long term, as they imply that soil nutrients are not being replenished (mining of soil resources over time). Numbers above the green box can indicate lower efficiency and the opportunity for improved economic returns. The feasible NMBs (within the green box) have been identified as 0-105 lbs N, 0-12 lbs of P and 0-37 lbs of K per tillable acre, and 0-0.88 lbs N, 0-0.11 lbs P and 0-0.30 lbs K per 100 pounds of milk shipped. Due to the variable conditions that occur on farms from year to year, these numbers have been termed as “feasible” rather than absolute goals. However, the feasible NMB numbers can be viewed as benchmarks, as they represent nutrient balances proven to be achievable by most farms.

Having a robust dataset of farm NMBs has clearly been critical for validating the positive change in nutrient efficiency and progress toward meeting watershed TMDL goals. Capturing nutrient conservation accomplishments can answer regulatory demands, but it is also highly useful to the farms that use their annual NMBs to determine their individual farm goals. Farmers have consistently reported the following benefits from completing annual whole-farm NMBs:

  • The NMB captures the overall results of management practices, and reflects the degree of nutrient efficiency in the balance numbers and milk exports.
  • Trends are illustrated, so the impacts of management changes, such as reduced feed protein levels, are reflected in a reduced N balance.
  • A feedback loop is created between NMB report results and management decisions: the tracking process required to complete a NMB causes feed and forage production changes to be considered in light of their potential impacts on the farm’s nutrient efficiency, which is then captured in the NMB report. This adaptive management process has been highly effective in implementing positive change.
  • The impacts of manure and fertilizer management practices on soil levels of P and K are reflected in homegrown forages and quantified in the NMB diagnostics. This information is useful to both crop and feed management.
  • The NMB results, and their position compared to the green box, give farmers an indication on their progress towards nutrient efficiency goals, and validate results of management decisions.

The authors of the NMB trend study reported a need for a larger dataset that will better represent the nutrient balance status of New York farms. The current dataset shows that nutrient efficiency can improve over time, and illustrates the impressive progress already made by farmers. However, a larger number of farms would provide a more robust dataset to compare the nutrient conservation progress of farms to the nutrient reductions expected by regulatory entities.

 

Save

Close Cultivation Followed by Three In-Row Cultivations Reduce Organic Corn Plant Densities by another 3.5% or ~1000 Plants/Acre

Bill Cox and Eric Sandsted
Soil and  Crop Sciences Section, School of Integrative Plant Science, Cornell University

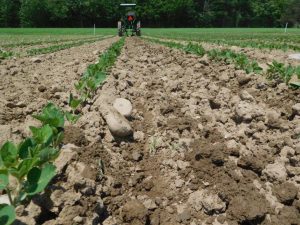
Cultivating soybean close to the row. This operation may have contributed to the 3.5% further reduction in organic corn plant densities between the V3 and V9 stages.

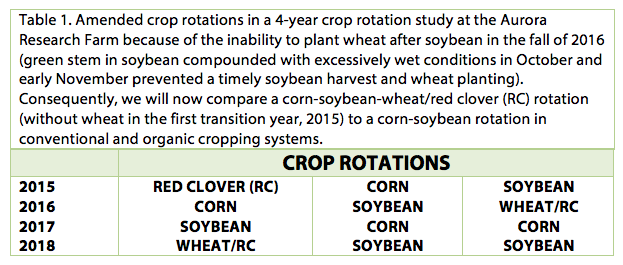
We initiated a 4-year study at the Aurora Research Farm in 2015 to compare different sequences of the corn, soybean, and wheat/red clover rotation in conventional and organic cropping systems under recommended and high input management during the 3-year transition period (2015-2017) from conventional to an organic cropping system. We provided a detailed discussion of the various treatments and objectives of the study in a previous news article (https://blogs.cornell.edu/whatscroppingup/2015/07/23/emergence-early-v4-stage-and-final-plant-populations-v10-psnt-values-v4-and-weed-densities-v12-in-corn-under-conventional-and-organic-cropping-systems/). Unfortunately, we were unable to plant wheat after soybean in the fall of 2016 because green stem in soybean compounded with very wet conditions in October and early November delayed soybean harvest until November 9, too late for wheat planting. Consequently, corn followed soybean as well as wheat/red cover in 2017 so we are now comparing different sequences of the corn-soybean-wheat/red clover rotation with a corn-soybean rotation (Table 1). This article will focus on corn plant densities at the V9 stage after rotary hoeing (V1-2 stage), a close to the row cultivation (V3 stage), and three subsequent in-row cultivations (V5, V6-7, and V7-8 stages) in organic corn.

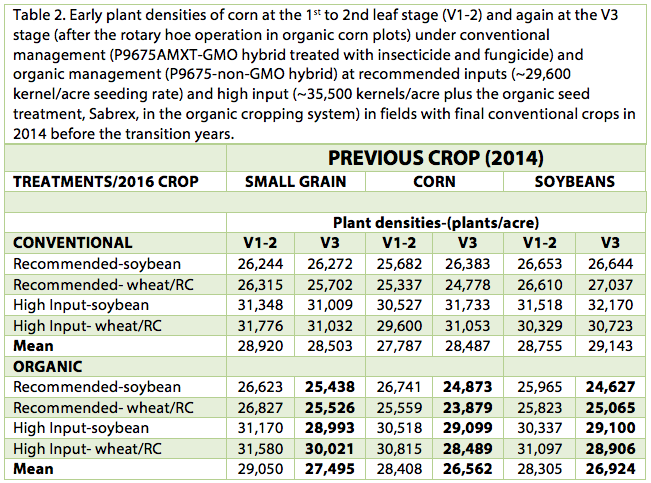
We reported in a previous article (https://blogs.cornell.edu/whatscroppingup/2017/06/05/organic-and-conventional-corn-have-similar-emergence-and-early-plant-densities-in-2017/) that organic corn and conventional corn had similar plant densities in all treatments at the V1-2 stage (June 2), a few hours before the rotary hoe operation. Organic corn, however, had 5.5% lower plant densities 10 days later at the V3 stage, whereas conventional corn had similar plant densities at the V3 stage compared to the V1-2 stage (Table 2). We attributed the 5.5% reduction in plant densities to rotary hoe damage (https://blogs.cornell.edu/whatscroppingup/2017/07/06/rotary-hoe-operation-at-the-v1-2-stage-decreases-organic-corn-plant-densities-by-5-5-but-has-limited-effect-on-organic-soybean-plant-densities/). Consequently, organic corn with recommended inputs (~30,000 kernels/acre seeding rate) had plant populations of only ~24,500 to ~25,500 plants/acre at the V3 stage, too low for maximum yields in New York. We speculated in the previous rotary hoe article that organic corn seeding rate recommendations may have to be increased to ~33,000 kernels/acre.

Unfortunately, after a close to the row cultivation and three subsequent in-row cultivations, plant densities in organic corn were further reduced by 3.5% with final plant stands now below 24,600 plants/acre in all six recommended organic corn treatment combinations (Table 2). Again, conventional corn had similar plant densities at the V3 and V8 stages, so we attributed the 3.5% reduction in organic corn to cultivation damage. We are not sure which of the four subsequent cultivations after the rotary hoe operation resulted in most of the 3.5% reduction. We did see some corn tipping damage at the V7-8 operation because of the height of the corn but the damage was estimated to be only ~0.5%. We suspect that most of the damage came during the in-row cultivation when thrown soil from the close cultivation buried some of the corn plants.

We have recommended seeding rates of ~30,000 kernels/acre for conventional corn in New York, despite criticism from some industry personnel, farmers, and academic colleagues in other states. We have maintained these recommended seeding rates because on most occasions final stands of 26,000 to 28,000 plants/acre have resulted in maximum economic yields (https://scs.cals.cornell.edu/sites/scs.cals.cornell.edu/files/shared/documents/wcu/WCUvol23no1.pdf). Ironically, the high input organic corn treatments (seeding rates of ~35,000 kernels/acre) had final plant stands of ~27,000 to ~29,000 plants/acre in this study (Table 2), close to optimum for maximum yields in New York. Apparently, organic corn in New York should be planted at ~34,000 kernels/acre. We attributed the 7% lower yield in organic compared with conventional corn in 2016 to lower plant densities (https://blogs.cornell.edu/whatscroppingup/2016/11/28/organic-corn-only-yields-7-lower-than-conventional-corn-during-the-second-transition-year/). Likewise, organic corn with high inputs yielded 6.5 to 7.0% greater than organic corn with recommended inputs in two of three treatment comparisons in 2016, presumably because of the low final stands in the organic recommended input treatment. If high input organic corn yields greater than organic corn with recommended inputs in 2017, we will change the recommended seeding rate for organic corn to ~34,000 kernels/acre in the 2018 Cornell Guide for Integrated Field Crop Management.

Series: Phosphorus and the Environment, 3. Protecting our lakes: shoreline septic system concerns.

Karl J. Czymmek
PRO-DAIRY Program, Cornell University

Introduction
Phosphorus (P) chemistry is very complex in farm fields as well as streams and lakes. Only a small portion of the total quantity of P in the environment is bioavailable, meaning that it is readily available to living organisms. In this article two methods or tests that water chemists use to measure P are referred to: Total Phosphorus (TP) and Soluble Reactive Phosphorus (SRP). The TP represents most or all of the various forms of P that are present, while SRP is a fraction of TP, representing what is immediately available to organisms in the lake. The SRP acronym is often used as shorthand for bioavailable P. There are other forms of P considered by scientists, such as Dissolved Organic P (mostly available) and Particulate P (partial or limited availability), but these are topics for another time.

In the temperate freshwater ecosystems found in this region, P is usually the nutrient that limits algae growth. As water temperatures rise in the summer, SRP tends to be in such high demand that it is very rapidly used by lake organisms. The natural P cycle in a lake creates a continuous source of SRP used by water life. Lake-recycled SRP in the upper waters is supplemented when a summer storm carries a fresh surge of P, some of which is SRP, from the land (watershed) that drains into the lake. While it is critical to manage all forms of P that reach a lake (readily available or not), for the most part, it is the quantity of that bioavailable SRP supplied from and to a lake that feeds the organisms and drives algae blooms. Paying attention to and understanding all SRP sources is an important part of lake management.

It is well established in the scientific literature that runoff from a watershed, including farms and forests, contributes to the TP and SRP loading in lakes. This has been well publicized in communities across the Finger Lakes region as well. While significant attention has been devoted to agricultural contributions, the serious nature of water quality challenges that have been observed in recent years requires a better understanding of all watershed sources of P. This third article in the Phosphorus and Environment Series focuses on P sources from septic systems on lake shores.

Septic systems
Many people dismiss the notion that septic systems can have an impact on the lakes. After all, the quantity of nutrients shed by any individual human directly to lakes is small and local agencies may report rigorous testing and a record of high compliance for shoreline septic systems. While it is widely believed that a septic system is working properly so long as effluent does not show up on the surface, what goes on underground, unseen, may be a real concern. Septic related outbreaks to the yard surface are not the only indicator of poorly functioning or failing systems, and for a variety of reasons, the situation for shoreline septic systems may be more complicated. For a general review of shoreline septic system issues, see: http://waterquality.cce.cornell.edu/septic/CCEWQ-YourSepticSystem-Shoreline.pdf. A broad description of P and onsite wastewater systems is provided in an article by the National Environmental Services Center (2013) and can be found here: http://www.ct.gov/dph/lib/dph/environmental_health/pdf/pipeline-wastewater_issues_explained_to_the_public.pdf). This second article indicates that many shoreline communities with closely sited homes and leach fields in well-drained soils that are close to the shoreline have experienced problems with noxious algal blooms (page 6).

For septic systems, part of the issue lies in how they are designed to work. For many non-sewered homes, all the drainage from toilets, showers, laundry, sinks and dishwashers flow into a septic tank. Liquids are held here temporarily, while the solid materials settle in the tank. The solids should be removed every 1-3 years (if not, then the system risks failure or is in such porous soil that it is likely not properly treating the waste). Liquids pass through the tank and are distributed to a leach or drain field through pipes with drainage holes that distribute the liquids into what should be moderately permeable soil. In the right conditions, soil chemistry and biological activity are expected to treat the nutrients and bacteria released from the system. To ensure proper treatment, much of the focus for septic system function relates to making sure the soil drains sufficiently well that the liquids do not rise to the surface, yet does not drain so rapidly that poorly treated liquids reach the water table.

Problems can arise when septic systems are installed into well-drained situations, especially on shorelines, where the water table is often close to the soil surface and where the separation distance of 100 feet from the leach field to the surface water (New York State Department of Health, 2016) cannot be met. Lakeshore soils can be variable but there are many areas of gravelly, well-drained soil types near shorelines with unsuitably rapid percolation rates that are close to the water table. Other shoreline locations may have shallow bedrock or rock outcrops with cracks that allow liquids to pass with little or no treatment. Lakeside property owners have reported finding older cottages and camps with perforated 55 gallon drums for disposal systems with little or no pipe distribution system for a leach field at all. The only way these systems could have worked, often for decades, is if they were (or are) sitting in very porous material which implies that septic flows could be in direct contact with the lake. In other cases, old systems, overuse and other factors suggest that septic systems along local lakes can contribute SRP to the water that promote near-shore algae and nuisance aquatic vegetation growth. Some newer full collection systems may contribute as well if they have difficult to detect (and illegal) overflow/bypass connections.

Another key part of the issue lies in the characteristics of the P in human urine and the P content of septic outflow. First, about 2/3 of the P that humans excrete is in urine (Meinzinger and Oldenburg, 2009) and this P is highly bioavailable (Kirchmann and Pettersson, 1995). According to the National Environmental Services Center (2013), the median TP level in the liquid that flows out of the typical septic tank measures about 10 parts per million (ppm or milligram/l). It is unclear how much of septic outflow is in the SRP form, but since the P we excrete is highly bioavailable, it seems probable that a portion of the P in septic outflow is also highly bioavailable.

Changes have occurred in intensity of use of shoreline septic systems over the years. Many seasonal camps have been removed and replaced with larger, year-round homes. Properties that were single family with 3 or 4 children in the 70’s and 80’s are now shared by multiple families. Also, many properties are rented and now occupied up to 7 days per week, sometimes week after week. The increased “person days” on shorelines may be contributing to the changes in water quality that have been observed in some locations.

Considerations for Owasco Lake
A review of the USDA soil survey for Cayuga County shows that all of the major Owasco lakeshore points sitting at the mouth of streams south of Buck Point and Martin Point are mapped as having well-drained soils, and many of these locations consist of soils that are described as having a significant gravel content. Such soil conditions are identified as a risk for water pollution by various reference sources, and there may be other locations along the shore with soil conditions that are not well suited to septic treatment.

According to the 2016 Owasco Lake Report (Halfman et al., 2016), the NYSDEC threshold for impairment is 20 parts per billion (ppb or microgram/l) TP, and the lake-wide summer average TP has been approximately 15 ppb for the last few years. For background, note that 1 ppm is 1,000 times greater than 1 ppb. In comparison, 10 ppm TP median septic outflow is 500 times the TP impairment threshold of 20 ppb, and approximately 660 times the lake-wide summer average TP of approximately 15 ppb (Halfman et al., 2016). Given that septic outflow P concentration is hundreds of times higher than lake-wide summer average TP, and combined with the high bioavailability of P in our urine, it seems very possible that poorly functioning septic systems can be an important contributor to lakeshore hot spots of SRP that support algae and nuisance weed growth.

It should also be noted that several lakes with TP levels below 10 ppb, much lower than Owasco Lake, have also experienced algal blooms in recent summers, suggesting that TP for the lake may not be the best algae growth indictor and that SRP from shorelines or other sources could be involved. A better understanding of P in our water bodies is critical.

In Summary
In the short term, when it comes to growing algae and weeds in our lakes, the quality of P may be more important than the quantity: SRP represents the main form of immediately available P that is used by nuisance weeds and microorganisms such as the cyanobacteria that contribute to harmful algal blooms. Human urine contains a high proportion of bioavailable P and shoreline septic systems are often in close proximity to the water and may be situated in unsuitable soil conditions. The series of factors described here suggest that shoreline septic systems can contribute to elevated levels of SRP in our lakes and further investigation is warranted. As we work to understand and manage P from all sources, including agriculture, addressing shoreline septic contributions will be an important part of the solution.

References

Rotary Hoe Operation at the V1-2 Stage Decreases Organic Corn Plant Densities by 5.5% but has Limited Effect on Organic Soybean Plant Densities

Bill Cox and Eric Sandsted
Soil and Crop Sciences Section, School of Integrative Plant Science, Cornell University

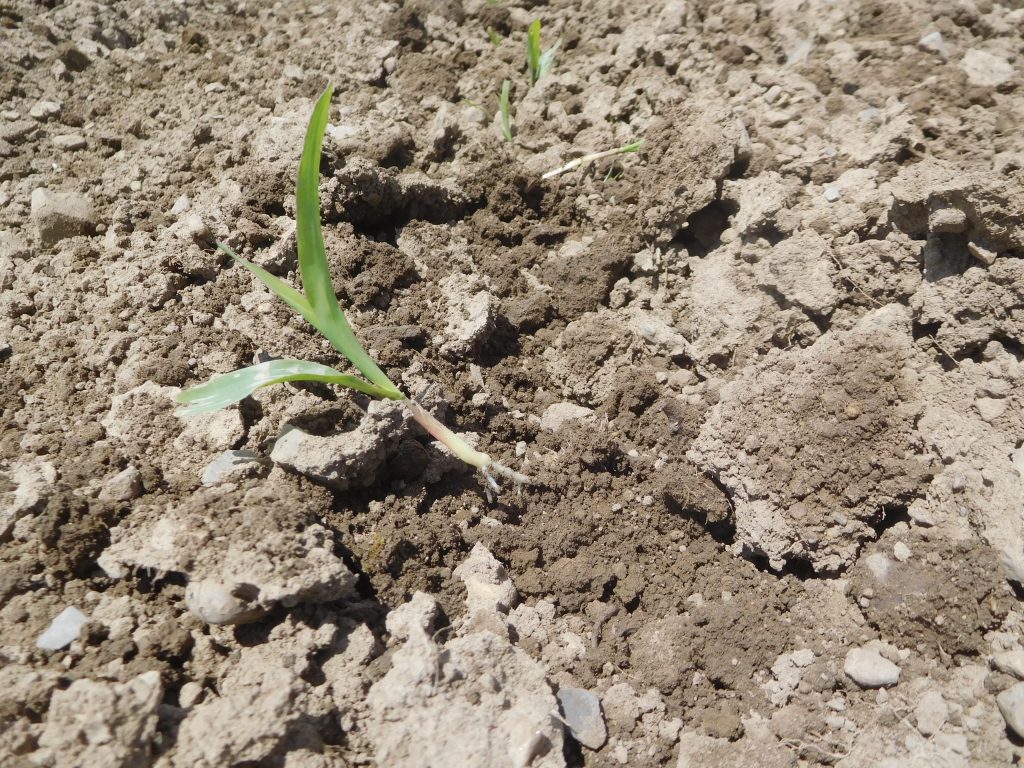
Corn damage after rotary hoe operation on June 12.

We initiated a 4-year study at the Aurora Research Farm in 2015 to compare different sequences of the corn, soybean, and wheat/red clover rotation in conventional and organic cropping systems under recommended and high input management during the 3-year transition period (2015-2017) from conventional to an organic cropping system. We provided a detailed discussion of the various treatments and objectives of the study in a previous corn article (https://blogs.cornell.edu/whatscroppingup/2015/07/23/emergence-early-v4-stage-and-final-plant-populations-v10-psnt-values-v4-and-weed-densities-v12-in-corn-under-conventional-and-organic-cropping-systems/). Unfortunately, we were unable to plant wheat after soybean in the fall of 2016 because green stem in soybean compounded with very wet conditions in October and early November delayed soybean harvest until November 9, too late for wheat planting. Consequently, corn followed soybean as well as wheat/red cover in 2017 (Table 1). This article will focus on corn and soybean plant densities after the rotary hoeing operation in the organic cropping system.

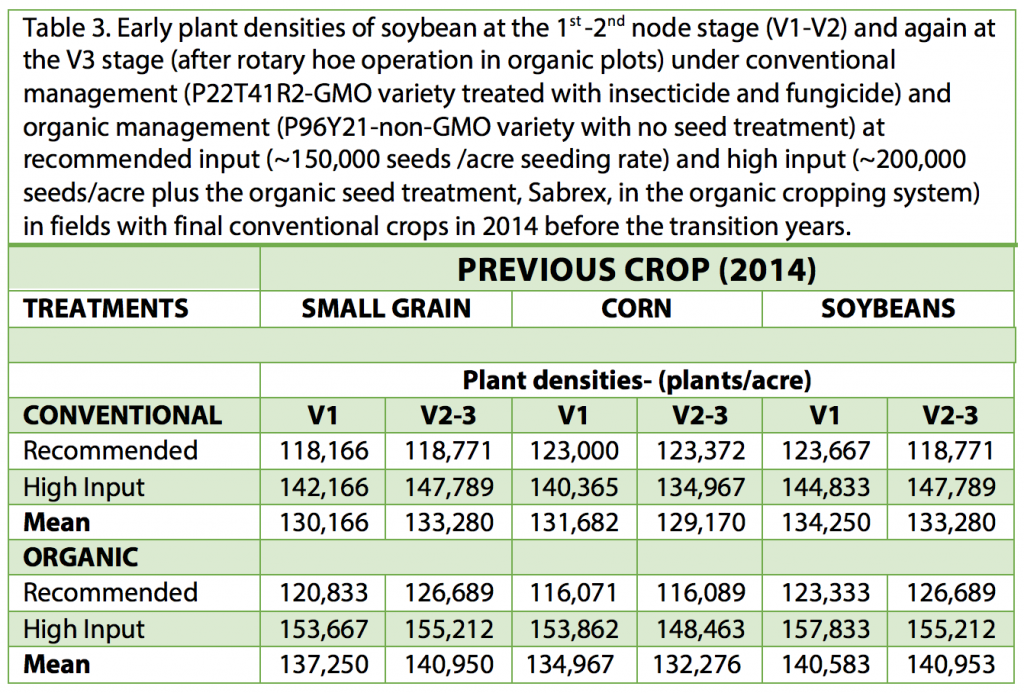
We reported in a previous article (https://blogs.cornell.edu/whatscroppingup/2017/06/05/organic-and-conventional-corn-have-similar-emergence-and-early-plant-densities-in-2017/) that organic corn and conventional corn had similar plant densities in all treatments at the V1-2 stage (June 2), a couple of hours before the rotary hoeing operation (Table 2). Results were surprising because we presumed that the seed treatment of conventional corn, P96AMXT, would result in higher plant establishment rates compared to the non-treated organic isoline, P9675. In contrast, organic soybean (P92Y21) with no seed treatment had greater plant establishment rates compared with conventional soybean (P22T41R2) with seed treatment (Table 3). We attributed difference due to variety or genetic factors and not to organic management factors (https://blogs.cornell.edu/whatscroppingup/2017/06/06/soybean-emergence-and-early-plant-densities-v1-v2-stage-in-conventional-and-organic-cropping-systems-in-2017/).

Conventional corn had similar plant densities at the V3 stage compared to the V1-2 stage (Table 2). In contrast, organic corn had 5.5% lower plant densities on June 12 compared to June 2. Although we observed limited visual plant damage when inspecting the organic plots during the operation, the rotary hoeing must have reduced plant stands, especially because conventional corn plant densities remained similar.

Conventional soybean had similar plant densities at the V3 stage compared to the V1-2 stage (2.4% higher at V3 compared to the V1-2 stage in the field with a small grain in 2014 probably because of uneven and delayed emergence in soybean, Table 3). Likewise, organic soybean generally had similar plant densities at the V3 stage compared to the V1-2 stage. Apparently, the rotary hoeing operation results in limited damage to soybean, unlike corn, at the V1-2 stage.

We have recommended seeding rates of ~30,000 kernels/acre for conventional corn in New York, despite criticism from some industry personnel, farmers, and academic colleagues in other states. We have maintained these recommended seeding rates because on most occasions final stands of 26,000 to 28,000 plants/acre result in maximum economic yields (https://scs.cals.cornell.edu/sites/scs.cals.cornell.edu/files/shared/documents/wcu/WCUvol23no1.pdf). After the rotary hoeing operation, however, most of the plant densities of organic corn at the V3 stage ranged from ~24,000 to 25,500 plants/acre. This is before the close cultivation, performed on June 12, and 2 in-row cultivations that occurred on June 27 and again on July 5, which will further reduce plant densities. We attributed the 7% lower yield in organic compared with conventional corn in 2016 to lower plant densities (https://blogs.cornell.edu/whatscroppingup/2016/11/28/organic-corn-only-yields-7-lower-than-conventional-corn-during-the-second-transition-year/). Organic corn apparently should be planted at seeding rates of at least 33,000 plants/acre to maintain final plant densities above 26,000 plants/acre after the myriad of weed control operations, including rotary hoeing, close cultivation, and in-row cultivation.

We have recommended seeding rates of ~150,000 seeds/acre for soybeans in New York based on numerous studies (https://scs.cals.cornell.edu/sites/scs.cals.cornell.edu/files/shared/documents/wcu/WCU21-2.pdf). Some organic soybean producers and researchers believe that seeding rates should be higher, ~200,000 seeds/acre, because of the delayed planting date and more importantly for improved weed control. Data from this study in 2015 and 2016, however, indicated that organic soybean with recommended management practices (~150,000 seeds/acre) compared with high input management (~200,000 seeds/acre) yielded similarly (https://blogs.cornell.edu/whatscroppingup/2016/11/28/organic-soybean-once-again-yields-similarly-to-conventional-soybean-during-the-second-transition-year/). Weed densities were indeed higher in organic soybean at the lower seeding rate in both years but seed yield did not correlate with weed densities in 2016. We are only in the 3rd year of growing soybeans organically and perhaps weed densities will increase to such an extent that higher seeding rates will be justified. At this time, however, we see no justification for increasing the recommended organic soybean in 30-inch rows from ~150,000 seeds/acre to ~200,000 seeds/acre, especially because the rotary hoeing operation did not lower early plant densities in soybean as it did in corn.

Save