NYCSGA Precision Ag Research Update: Year One of Model Validation

Savanna Crossman, Precision Agriculture Research Coordinator
New York Corn and Soybean Growers Association

The 2016 field season marked the first year of testing for the variable rate planting model that is being developed by the Precision Ag Research Project. Growers across New York State know the challenges that the severe summer drought brought to our region.  Crop yields were impacted across the state and the research was no exception.  While unfortunate, it is advantageous to be able to test the model during a dry year and learn from how the crops reacts to the stress.

Across the board, the mid-to-lower seeding rates fared the best in the corn and soybean trials.  The model was tested on five fields this year and only four made it to grain harvest due to severe drought stress.  The results revealed that in three of the fields, there was not a significant difference in the profit produced by the model.  While the average yield of the model was significantly less, the model was able to achieve similar profit per acre by using lower seeding rates. (Table 1) 

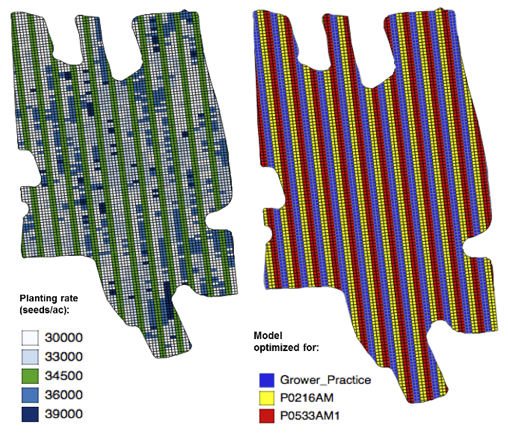
Figure 1. 2016 Beach 2 model design. The left image displays the planting rate map and the right image displays the hybrid map.

A variation of the model design was planted on one field, Beach 2, in a split planter fashion with two contrasting hybrids.  This varied design was used as it allowed for of multiple points of comparison, including hybrid comparison.  Check strips were integrated every two passes to allows direct comparison of how the model performed to the typical grower practice rate.  From there, the design becomes more complicated.  The first pass would be planted at the model optimized rate for hybrid A, which meant hybrid B was also being planted at that same rate.  Then the next pass would plant at the rate optimized for hybrid B while hybrid A was being planted at that rate as well.  This allows us to examine the hybrid response to population in more depth. (Figure 1)

The hybrids P0216 and P0533 were selected due to their differences in plant architecture and responses to stress.  In years of excellent growing conditions, the tight leaf structure and short stature of P0533 will produce aggressive yields.  The hybrid P0216 will produce average yields in years of stress as well as in excellent conditions.

A 4,000 foot view of this field would show that there was not a significant yield difference between the model and the grower’s flat rate.  The model yielded about 2 bu/ac more than the flat rate, but that difference was not statistically significant.  When we separate the results out by hybrid, we see a much more telling story.

These hybrids resulted in a wonderful side-by-side comparison this year.   When compared to the flat rate, P0533, regardless of optimization, yielded significantly more per acre and yielded an astounding $64/ac more.  Conversely, P0216, regardless of optimization, yielded less than the flat rate and produced a profit $22/ac less than the flat rate.

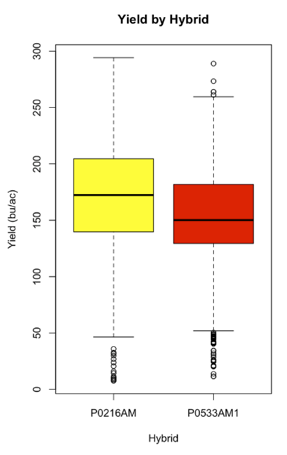
Figure 2. P0216 optimized yield versus P0533 optimized yield.

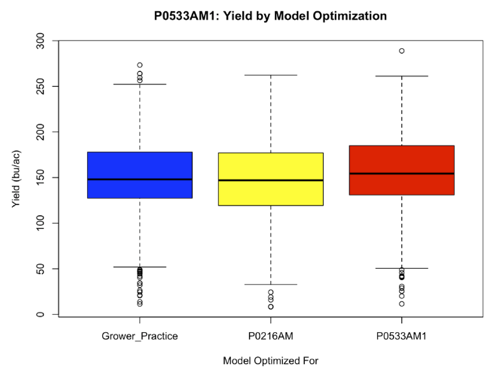
A deeper look into the results showed that that when both hybrids were planted optimally, P0216 yielded almost 18 bu/acre higher than P0533 (Figure 2).   It also demonstrated that P0533 exhibited a statistical significant response to model optimization.  Meaning, when it was optimized the yield significantly improved over not being optimized (Figure 3).  This is likely due to the fact that in a stressful year, P0216’s yields will not fall apart due to seeding rate while P0533 benefited from precise placement.

Figure 3. P0533 exhibited a hybrid response to population.

These same hybrids in Beach 2, however, exhibited the exact opposite hybrid response in 2014 which was a normal year in terms of weather conditions.  Knowing this emphasizes the importance of multiple years of testing and data collection to create a robust algorithm.  The biggest gain from the 2016 season has been the strong design and analysis process that has been developed.  What the project has accomplished in these terms, is at the leading edge of the scientific community.

In order to build upon what the project has already accomplished, the project is still looking to get more producers involved and participating.  The project aims to get fields in the research that have a large amount of variation and are fifty acres or greater.  Any interested growers are highly encouraged to get in touch with the Project Coordinator, Savanna Crossman, at 802-393-0709 or savanna@nycornsoy.com.

Save

Series: Phosphorus and the Environment, 2. Setting the Record Straight: Comparing Bodily Waste Between Dairy Cows and People

Michael Van Amburgh and Karl Czymmek
Animal Science Department, Cornell University

A lawsuit filed against the New York State Department of Environmental Conservation in March 2017 incorrectly compares the amount of waste produced by 200 cows to that produced by a city of 96,000 people.  This error is more than 10-times too high and has been picked up and repeated by the media.  In order to make a legitimate comparison it is necessary to answer the question: how much urine and feces are excreted each day by a dairy cow and a person and what are the nutrient contents of that excretion that are an environmental concern?

Background
Simply put, the type of digestive system along with the quantity of food and water consumed by an individual cow or human drives the quantity and nutrient content of what is excreted.  Based on a survey of the scientific literature, there seems to be a lot more information about excretion by cattle than humans.  For both cattle and people, the amount of fiber consumed determines fecal weight and volume.  The human diet of North Americans and Europeans tend to be lower in fiber and higher in protein than humans in other parts of the world. Since cows are ruminants, they are especially adapted to extracting nutrients from high fiber diets that would not sustain a human.  Cows have four stomachs and the first is a large fermentation vat, known as the rumen with a capacity of about 50 gallons, which   produces billions of beneficial microbes that can digest high fiber feeds that cannot be digested by humans.  The microbes help the cow to partially break down forages like grass, alfalfa and corn silage that comprise much of the diet.

A single mature dairy cow, depending on her breed, can weigh 900-1,800 pounds.  Holsteins are the predominant dairy breed in NYS and mature cows can weigh 1,600-1,800 pounds.  A 1,600 pound cow can consume about 120-170 pounds of feed per day or 52-62 pounds of dry matter (all water removed).  Ultimately, this simply means that pound for pound, a cow excretes more feces than a human does.  Similarly, urinary excretion is a function of fluid intake.  The fact that cows are able to digest bulky, high fiber feeds that we cannot makes a direct comparison difficult.  For this discussion, we compare excretion between cows and people in three different ways: 1) pound for pound of urine and feces (“wet basis”); 2) total nitrogen; and 3) total phosphorus.

Dairy Excretion Basics
According to 2016 data from the USDA Economic Research Service, the average NYS dairy cow produced more than 23,000 lbs of milk per year, or about 75 lbs of milk per day.  Using a typical diet at this production level, total excretion of urine and feces as well as nitrogen and phosphorus was calculated using the Cornell Net Carbohydrate and Protein System (CNCPS) animal nutrition model.  The CNCPS has been under development for more than 40 years, is based on numerous published scientific studies, is widely recognized to accurately predict how a cow will respond to a particular diet, and is used in the US and across the world to formulate diets for millions of dairy and beef cattle. In addition, because the model was developed to more accurately predict the nutrients required by the cow and the supply from the diet to meet these nutrient needs, application of the model has helped farms significantly reduce nitrogen and phosphorus excretion and related losses to the environment.  According to CNCPS evaluations and predictions, an average mature milking cow producing 75 lbs of milk per day on a typical NYS diet generates about 63.5 liters of urine and feces per day (16.8 gal) and this contains 415 grams (0.9 lbs) of nitrogen and 57 grams (0.13 lbs) of phosphorus.

The Herd
The lawsuit analysis appears to be based on a herd of 200 milking cows and does not include calves and heifers.  In NY and the Northeast, most dairy herds also raise calves and heifers as the replacement animals.  For this analysis, we assume the 200 milking cow farm includes 140 calves and heifers. The calves and heifers do not consume as much feed and water as a lactating cow, and the CNCPS predicts their excretion and we converted them to a “lactating cow equivalent” for easier calculations.  After considering the calves and heifers, the overall excretion is similar to 242 lactating cows so the comparison below includes this for a sensitivity analysis ensuring all animals on the farm are accounted for.

The People
In terms of human waste, there are a limited number of studies and the literature reports an extremely wide range of output across individuals.  The data are actually much better for cattle than for people.  The reference for human excretion data used in this analysis comes from a paper referenced below and is based on European diets, which are expected to be similar to North American diets.  This paper provides the most clear cut statement of the median excretion volume of urine and feces by humans, as well as nitrogen and phosphorus content.  The median daily excretion rate of feces and urine reported for humans is 1.51 liters (0.4 gallons) per day, for nitrogen, the rate is 11.9 grams (0.026 lbs) per day and for phosphorus, 1.5 grams (0.003 lbs) per day.

The Comparison – volume basis
On a volume basis in a direct comparison to the analysis in the court filing, a herd of 200 milking cows is about the same as 8,400 people, not 96,000.  Even when the herd of 200 milking cows includes an additional 140 head of calves and heifers, the volume of urine and feces amounts to that produced by 10,736 humans.

Nitrogen and Phosphorous basis
On a nitrogen and phosphorus basis, the comparison changes because cows consume a bulky, very high fiber diet.  Calculating the values on an N and P basis aligns with the way we evaluate manure for application as a fertilizer for crop fields.  It is also in keeping with the regulations that are used to manage and monitor how manure nutrients are used at the field level for nutrient management plans.  Using the per capita N excretion rate, the average human excretes approximately 0.026 lb of nitrogen per day, and compared to our 200 cow herd with calves and heifers, this equates to about 8,400 people.

For phosphorous, the average human excretes a very small amount of excess P because our diets are very digestible compared to a cow and we consume modest amounts of phosphorus to begin with.  For our example herd, per cow excretion is about 0.13 lb of phosphorous per day, mostly in the feces.  On a phosphorus basis, our example herd compares to 9,196 people.

Conclusion
Increasingly, there are calls to require farms to build wastewater treatment plants, like towns and cities have.  However, there is one important, fundamental difference that should be considered: unlike our dairy and livestock farms in NYS, cities do not have a land base where nutrients are recycled.  When people congregate in cities, they also concentrate nutrients that are excreted in our waste.  It was not all that long ago that this waste was simply released into the nearest waterbody.  Even today, despite the best efforts of the skilled people who manage wastewater treatment facilities, a significant quantity of human waste ends up in our surface waters. According to a 2004 report by USEPA, combined sewer systems (CSS’s), annually discharge 850 billion gallons of sewage plus storm water, with a range of 3-10 billion additional gallons of undiluted sewage from sanitary sewer overflows (SSOs). The report also states that while large cities like New York, Philadelphia, and Atlanta have CSSs, most communities with combined sewer overflow problems have fewer than 10,000 people.  Even when functioning properly, discharge from municipal wastewater treatment contains a portion of the phosphorus from human waste.  These plants also generate sludge that must be land applied or sent to a landfill.  Additionally, most homes outside of towns and villages utilize on-site septic systems that can also be sources of contamination.

NYS requires each regulated dairy and livestock farm to have a nutrient management plan ensuring, at a minimum, that there is an adequate land base for nutrient recycling and includes prescribed manure rates and practices to reduce risk of loss.  Just as municipal treatment plants cannot always guarantee losses will not occur, farms are in a similar position.  Many farms strive very hard to keep nutrients on the land and they continue to look for better solutions to make best use of the nutrients from manure to replace fertilizer required for optimum plant growth.

By averaging all three methods in our calculations above, waste from the 200 cow example herd compares to 9,444 people, substantially below the figure provided in the lawsuit. To make sound policy decisions, we need a picture of the true value of these systems that is as accurate and complete as possible. Making comparisons like the one presented here in a careful and precise way, is key to preventing misconceptions that can have big and potentially detrimental impacts.

References
http://www.courthousenews.com/wp-content/uploads/2017/03/Cows.pdf

  1. Meinzinger, M. Oldenburg. 2009. Characteristics of source-separated household wastewater flows: a statistical assessment.  59 (9) 1785-1791; DOI: 10.2166/wst.2009.185

http://blogs.cornell.edu/cncps/home/

https://www.ers.usda.gov/data-products/dairy-data.aspx.  Milk cows and production by State and region.

Report to Congress: Impacts and Control of CSO’s and SSO’s. 2004. https://www.epa.gov/sites/production/files/2015-10/documents/csossortc2004_full.pdf

Series: Phosphorus and the Environment, 1. An Introduction to Phosphorus

Mart Ros1, Karl Czymmek1,2, Quirine Ketterings1
1
Nutrient Management Spear Program and 2PRODAIRY, Cornell University

In 1999, “What’s Cropping Up?” featured a series of articles on phosphorus (P) and agriculture. At the time, P and water quality was a big topic. New York had just released its first Concentrated Animal Feeding Operation (CAFO) Permit and the United States Department of Agriculture Natural Resources Conservation Service (USDA-NRCS), the New York State Department of Environmental Conservation (NYSDEC), and the New York State Department of Agriculture and Markets (NYSDAM) and Cornell University personnel worked closely together to frame up New York’s version of the Comprehensive Nutrient Management Plan (CNMP) system. This system has continued to evolve and now serves the 4th generation of the New York CAFO Permit that takes effect in July 2017. The P and agriculture series was initiated in recognition of the role of P, not just as a necessary nutrient for crop growth, but also as a as a contributor of P in water bodies to such levels that it can support harmful algal blooms, excessive weed growth and other issues. Proper management of P as a resource is therefore essential, for both economic and environmental reasons.

The articles in the first series on P and agriculture made the case for the New York Phosphorus Index (NY-PI), a tool designed to help identify and better manage farm fields that are at high risk for P runoff. The first NY-PI, which was based on the principles set out in the series of articles, has served the state well, resulting in changes to rates, timing and application methods for manure, among other things. Through changes in fertilizer use and feeding practices on dairy farms, and changes in the way manure is handled, New York agriculture has significantly reduced P imports over the past ten years. Every pound of P not imported onto farms represents reduced risk of loss of P to the environment. Yet, we must continue to look for ways to improve P management on and off farms, to protect New York’s water resources.

Here, we initiate a new series of articles entitled “Phosphorus and the Environment”. Phosphorus as a topic of discussion had died down for a while, taking second place to nitrogen (N) in years with extreme weather. However, because concerns about harmful algal blooms have resurfaced over the past years, and P is usually the limiting nutrient in these freshwater systems, P has returned to the forefront for many. This series of articles will range more broadly than the first. We will address some basic soil P related issues, provide an update on statewide and Upper Susquehanna P balances, and have a closer look at whole-farm nutrient mass balances of dairy farms that are improving sustainability while maintaining or increasing productivity. We will discuss proposed revisions to the NY-PI as well, and touch upon some unconventional topics such as shoreline septic systems and characteristics of human waste, to keep P management at the landscape level in perspective. In this first issue, we provide a refresher on P basics and compare excretion of dairy cows to that of people in terms of total volume, N and P.

Phosphorus is an essential macronutrient which means that plants, animals, and humans cannot go without it; P is a structural element of DNA and it is used in energy transfer processes in plants. Within farming systems, where economic security is directly linked to crop yield, animal health, and milk or meat production, it is crucial these systems have sufficient levels of P. To ensure that farms have an adequate P supply to support healthy animals and crops, P often needs to be imported in the form of fertilizer and/or animal feed.

Phosphate rock is the main source for the P fertilizers that are applied on agricultural fields throughout the world. In its natural state, phosphate rock is not very soluble, making it somewhat ineffective as a direct fertilizer source. This is why phosphate rock is normally ground and treated with sulfuric acid to obtain more effective fertilizer sources like superphosphates. Phosphate rock is mined from pits, and the major part of the global supply is located within just a few countries, such as Morocco/Western Sahara, China, South Africa, United States, and Jordan. Over the past century, the global use of, and dependency on, P fertilizers has increased exponentially. In modern crop-based agriculture, the application of P fertilizers is often standard procedure. However, like other resources such as fossil fuels, sources for rock phosphate are finite. It is uncertain how long these sources will last and predictions about the size and availability of global P reserves vary widely. Some projections estimate that the world’s reserves could be depleted within the next 50 years, whereas others expect they will last for centuries still. Regardless of whether and when we will run out of easily mineable P, expectations are that fertilizer costs will increase over the coming decades. This, combined with the indispensability of P for agricultural productivity calls for careful use of the resource, which is prudent for long-term sustainability.

Figure 1. Phosphorus cycle among mineral, organic and inorganic pools in the soil. Plants require P in solution for optimal growth and production.

Distribution and application of mineral fertilizers and other P sources such as manure over the world varies greatly. This results in different P-related problems depending on location. In large parts of Africa and Australia, soils are very poor and contain little P. In these areas, low P inputs and strong binding of P to soil particles prevent plants from taking up enough P, which can strongly limit crop yield. In other parts of the world, such as temperate climate zones in North America and Europe, P fertilizers and manure have been applied consistently over a long period. For some farm fields, this has resulted in a substantial buildup of P in the soil beyond crop needs (often referred to as ‘residual P’ or ‘legacy P’), which increases the risk of losing the P to the environment. In the case of animal manure, continued excessive application of fertilizer beyond what is already applied with manure can result in unnecessary loss of P to the environment. The application management of manure and fertilizer P can also contribute to P losses, regardless of soil test P level.

One way to improve P management (in cases of P excess as well as deficiency) is through a good understanding of P dynamics in soils. The soil contains many different pools of P. Plants however, can only take up P from the soil solution pool (Figure 1). It needs to be dissolved and in its inorganic form (orthophosphate). The fraction of P that is in solution (and thus directly available) is usually very small. With adequate soil P levels, crops can source much of the needed P from small amounts released from the soil supply over the growing season. This can occur through several processes, like desorption of P from binding agents such as iron and aluminum oxides and clays, the dissolution of P from calcium phosphates, or the mineralization of organic matter. These processes that determine the availability of P to crops all depend on soil characteristics such as pH, organic matter content and soil structure. This is why proper soil management, in addition to P source management (for example, not importing P if it is not needed for animal or crop production), is key to sustaining a healthy, profitable business.

Managing P in soils, on the farm, across the landscape, and in streams and lakes is an extremely challenging job. We need a better understanding of P movement and how management impacts P uptake by plants and loss to the environment, so we can reduce the risk of P loss and improve agricultural production. In the meantime, farmers and other members of the community will be called upon to take the steps they can to reduce P loading to our waterways, where P can be too much of a good thing.

What’s Cropping Up? Volume 27 No. 3 – May/June 2017


The full version of What’s Cropping Up? Volume 27 No. 3 is available as a downloadable PDF and on issuu.  Individual articles are available below:

Reduced Tillage and Cover Crops Have Additive Effect for Improving Soil Health

Bob Schindelbeck, Aaron Ristow, Matthew Ryan and Harold van Es
Soil and Crop Sciences Section, School of Integrative Plant Science, Cornell University, Ithaca, NY

Background
Soil health constraints may significantly limit crop productivity and sustainability in New York.  Typically, soils with poor soil health are less resilient to drought and flooding impacts, and are more prone to soil erosion and chemical runoff during heavy rainfall events.  Moreover, building and maintaining healthy soils is essential to supporting a robust population of beneficial soil organisms crucial to the cycling of carbon, nitrogen and other plant nutrients, as well as additional biological processes like disease suppression, and root proliferation.

Cornell University led the development of a suite of soil health measurements that focus on optimization of physical, chemical and biological soil properties for sustained productivity and minimal negative impacts on the environment (soilhealth.cals.cornell.edu). Our Comprehensive Assessment of Soil Health (CASH) approach includes a scoring function framework for interpreting soil health laboratory test results and identifying remediation options.   Increasingly many farmers, government and non-government organizations, and researchers are interested in understanding how cover crops, reduced tillage, crop rotation, intercropping, and organic amendments help to improve soil health.  We are using a long-term tillage study, with recently incorporated cover crops, to quantify the soil health and yield benefits of these practices.

Procedures

Figure 1. Growth of the cover crop cocktail
shown about 6 weeks after interseeding.

Beginning in 1994, continuous corn grain management was implemented on replicated (6) plots on a Lima Silt Loam under strip-till (ST) vs. plow-till (PT) treatments.  In 2013, we added cover cropped (CC) vs. no cover crop (NC) management in subplots, for a total of 4 individual treatments (PT-NC, PT-CC, ST-NC, ST-CC). The cover crops were established as a “cocktail” of grasses and legumes (Figure 1) using a drill interseeder in late spring (just after sidedressing nitrogen to the corn).  The mix included annual ryegrass (10 lb/a), Red Clover (5 lb/a), Crimson Clover (10 lb/a) and Hairy Vetch (7.5 lb/a). Corn yields were assessed by representative sampling (four twenty-foot long row sections per plot).

In the early spring of the 2016 season we collected a composited CASH soil sample from each of the four tillage x cover crop treatments to get a summary report of the soil health status.

Results
Soil Health Indicators
Table 1 shows the 2016 measured values of the physical and biological soil health parameters for each treatment. We included the continuous sod (sample from adjacent field border) as a benchmark of the soil health potential of these soils.  The table uses the same color scheme as in the CASH report to interpret the laboratory values from very low (red) to very high (dark green).  These results demonstrate that a change from plow to strip-till resulted in clear benefits for soil health and that combining strip-till with cover cropping had an additive benefit vs. just reducing tillage alone. We observed this pattern for the indicators of Aggregate Stability, Organic Matter, Soil Protein, and Active Carbon, with approximately equal and additive benefits from reduced tillage and cover cropping.  For Available Water Capacity and Soil Respiration, however, we observe primary benefits from transition from plow to strip-till, and less benefits from cover cropping.  Surface and subsurface hardness (penetrometer measurements) were not affected by these management changes. Overall, it appears that soil health differences between plow-till and no-till are expressed through the physical indicators (Available Water Capacity and Aggregate Stability), while the benefits of the cover crop cocktail are additionally apparent in the biological indicators.   Notably, Aggregate Stability, a critical soil physical property, showed substantial additive benefits of tillage and cover cropping changes with a total increase from 17.0 to 57.6% from the conventional (continuous plow-till, no cover crop) treatment to the strip-tilled, cover cropped treatment.  The biological indicators of Soil Protein and Active Carbon also demonstrated substantial improvement in measured values (increases of 40% and 24% in measured values, respectively).

As a result, the overall soil health score (Table 1) increased 7 points for strip-till over plow-till (41 to 48 and 49 to 56), and increased 8 points when adding the cover crop cocktail (41 to 49 and 48 to 56), which are remarkably consistent results. It is noteworthy that the cover crop treatment had only been in place for 3 years, while the tillage treatments had been in place for 22 years, suggesting that cover cropping results in faster soil health benefits, especially for biological processes.     The sod benchmark comparison shows that none of the corn-based treatments were able to reach soil health values that are similar to an undisturbed and continuously covered reference site, although the strip-tilled, cover cropped treatment was closest.

Yields
Improved soil health does not always translate into higher crop yields due to annual variations in weather and management.  However, for the recent 5 years, we observed an increase of 12 bu/a on average from the strip-till treatments compared to plow till. It is important to note that these results are based on just 3 seasons, and that it is still too early to determine the full extent of yield improvement from the recent addition of cover crops into the rotation.

Conclusions
The results of this study are interesting in that they show measurable soil health increases from reducing tillage over the long term. Adding cover crops resulted in benefits after only a few seasons, and these were observed in addition to the benefits from reducing tillage. This study involved a continuous corn experiment, and showed that the sustainability of such an intensive row crop system can be considerably improved with reduced tillage and the use of cover crops.

Acknowledgements
We are grateful for the funding support from the New York Farm Viability Institute, the Northeast Sustainable Agriculture Research and Education program, the New York State Department of Agriculture and Markets, USDA-NRCS, and the USDA-AFRI Water Quality Grant.

Save

Save

Save

Stripe rust: A new challenge to wheat yield in New York

Gary C. Bergstrom and Michael R. Fulcher
School of Integrative Plant Science, Plant Pathology and Plant-Microbe Biology Section, Cornell University

Stripe rust, known in many parts of the world as ‘yellow rust’ for its yellow-orange urediniospores, is a relatively new problem for wheat production in the eastern U.S.  However, the disease has been steadily increasing in severity and geographic range in the central and eastern U.S. over the past decade.  It has been observed sporadically in New York State for several years, but occurred at epidemic levels associated with potential yield losses for the first time in New York in 2016.  As of early June 2017, it has already been found in 24 states and three Canadian provinces.  It has been observed in several wheat fields in the Finger Lakes and western New York and may become widespread in New York before the crop matures.

Figure 1. Characteristic yellow-orange pustules of stripe rust urediniospores running in stripes or lines along veins on the wheat leaf surface. Smaller, circular, cinnamon-brown pustules of leaf (brown) rust of wheat may be seen on the same leaf. Photo by Gary Bergstrom. Inset photo (by Kent Loeffler) shows close-up of stripe rust pustules.

Stripe rust of wheat is caused by the fungus Puccinia striiformis f. sp. tritici. Stripe rust is identified by its telltale, yellow-orange spore pustules arranged in stripes along the leaves in contrast to the smaller, cinnamon brown pustules of leaf (brown) rust (Figure 1). Stripe rust isolates currently found in the Eastern U.S. do not attack barley.  Like other cereal rusts, the stripe rust fungus only survives between growing seasons on living wheat plants.  Therefore, stripe rust survives the winter primarily on winter wheat in frost-free areas of the southern U.S. Spores become airborne, move long distances in the atmosphere, and are deposited on green wheat plants in northern states each spring/summer.  Occasionally stripe rust may overwinter on wheat plants in New York during mild winters or under snow cover, resulting in an earlier spring epidemic. Once infection begins in a field, new generations of rust spores can be spawned as quickly as every 10 days under mild temperatures and moist conditions, thus magnifying disease in individual fields and providing new spores to be blown to both nearby and distant fields.  Significant yield losses can result when rust attacks the upper leaves of wheat during the critical first weeks of grain filling.

The best way to manage rust diseases is to plant resistant varieties.  However, rust pathogens are tricky, and fungal populations can evolve new races that attack once-resistant wheat varieties.  We are just beginning to understand the susceptibility of regional wheat varieties to stripe rust.  We learned in 2016 that certain widely grown soft red and white winter wheat varieties were particularly susceptible to stripe rust (Figure 2).  There are several foliar fungicides labeled for stripe rust control in New York and these will be very useful to utilize on susceptible varieties in years when there is a significant risk of stripe rust infection.  Rust epidemics observed in 2016 developed primarily following head emergence of wheat.  We found that a flowering time (Feekes stage 10.51) application of either Caramba or Prosaro fungicides for Fusarium head blight suppression provided complete protection of flag leaves against late-developing stripe rust. However, in future years when epidemics are initiated at earlier growth stages, it is likely that we will need to apply protectant fungicides at jointing to flag leaf emergence stages if scouting reveals the early presence of rust.

Figure 2. Relative severity of stripe rust observed on soft red and soft white winter wheat varieties compared over four New York nursery locations in June 2016. The boxplot midlines are median values, and the diamonds mark the average severity.

Since stripe rust is still fairly new to New York, we are tracking its progress and making collections of the fungus to determine races and genetic variation.  Please contact your Cornell Cooperative Extension Field Crop Educator or the Cornell Field Crops Pathology Program if you find stripe rust in your wheat over the next few weeks. You can help us learn more about this new yield robber and how we can minimize the risk.

Acknowledgements:
This work is supported in part by funding from USDA-NIFA Hatch grant NYC153436 and USDA-NIFA Smith-Lever grant NYC153652.

Save