Update of Scoring Functions for Cornell Soil Health Test

Aubrey K. Fine, Aaron Ristow, Robert Schindelbeck and Harold van Es
Soil and Crop Sciences Section, School of Integrative Plant Science, Cornell University

Comprehensive Assessment of Soil Health
Soil health refers to the ability of a soil to function and provide ecosystem services. The Cornell Comprehensive Assessment of Soil Health (CASH), initially referred to as the Cornell Soil Health Test, is a tool designed to aid landowners and managers in the evaluation of their soil health status. When a soil is not functioning to its full capacity, sustainable productivity, environmental quality, and net farmer profits are jeopardized over the long term.

Soil health cannot be determined directly, so it is assessed by measuring indicators that relate to soil quality. The CASH approach broadens the scope of conventional soil testing by evaluating the integration of biological, physical, and chemical properties, including soil texture, available water capacity, soil penetration resistance (i.e., compaction), wet aggregate stability, organic matter content, soil proteins, respiration, active carbon, and macro- and micro-nutrient content (see soilhealth.cals.cornell.edu/ for more details). Results from testing are interpreted using scoring functions, which are equations quantifying the relationship between measured indicator values and soil health status. Scores from all indicators are synthesized into a comprehensive report, which identifies specific soil constraints and provides management suggestions for clients.

A challenge of assessing soil health in this way is the interpretation of measured values for each soil property. For example, what does a 30% value for wet aggregate stability mean? Is it an indication of a problem, or does it signify a good soil? Should the interpretation be different depending on soil texture? The CASH scoring functions and interpretative color code for each indicator were developed to address this issue. The scoring functions for the original Cornell Soil Health Test, first made publically available in 2006, were based on soils data collected from the Northeastern United States. In the decade since, the Cornell Soil Health Laboratory (CSHL) database has expanded to include data for a much greater number and more geographically diverse set of samples representing over 60% of the United States and areas overseas.  This project reports on the most recent analysis of the CSHL database, performed in 2016. The results of this work allowed us to refine the scoring functions and incorporate regional differences that broaden the scope of the CASH outside of the Northeast.

Scoring Functions
The CASH scoring functions are based on the distribution of measured values for each indicator from all samples in the CSHL database.  This approach allows us to assess whether a particular soil sample shows low, medium, or high values relative to other soils in our database, and thereby make some judgment on the health of that soil and possible problems.  This is similar to many medical tests where an individual’s health measure (e.g., blood potassium level) is scored based on the values measured from a large population to assess whether or not it is within normal range.

For most CASH scoring functions, we use the mean and standard deviation of our data set to calculate the cumulative normal distribution (CND). The CND function is essentially the scoring function, as it translates measured values to a unit-less score ranging from 0-100. Scoring functions for all indicators and textural groups (i.e., coarse, medium, fine) were calculated this way. This approach can be adapted to other regions with different soils and climate, as scoring functions can be attuned to fit different conditions.

As an illustration on how scoring functions are developed, the histogram in Figure 1 shows the observed distribution of measured values of active carbon (Active C) for medium textured soils. The height of the bars depicts the frequency of measured values that fall within a range (bin) of 100 ppm along the horizontal axis. For instance, approximately 24% of the soil samples in this set had measured Active C concentration between 500 and 600 parts per million (ppm). The normal distribution, or bell curve, superimposed over the bars was calculated using the mean (531 ppm) and standard deviation (182 ppm) of all medium textured soils.  Using these two parameters, we can develop a scoring curve (Fig. 2e) representing the CND having the same parameters (i.e., the mean and standard deviation).

FIGURE 1. Example of the distribution of active carbon indicator data in medium textured soils used to determine the scoring curve.
Figure 1. Example of the distribution of active carbon indicator data in medium textured soils used to determine the scoring curve.

Three general types of scoring are used, whether the curve shape is normal, linear, or otherwise:

  • More is better, where a higher measured value of the indicator implies a higher score. We use this type of scoring curve for most soil health indicators.
  • Less is better, where higher measured values are assigned a lower score and are associated with poorer soil functioning. This is the case for Surface and Subsurface Hardness and the Root Health Bioassay Rating. Manganese and Iron are also scored as ‘less is better’ because these micronutrients are associated with a risk of toxicity from excess levels.
  • Optimum curve, where the scoring curve has an optimum range and the scores are lower when measured values fall either below or above this range. Extractable Phosphorous and pH are both scored using an optimum curve.

In general, scoring functions are texture group-dependent for physical and biological indicators, with higher scores associated with better soil health. For example, an Active Carbon measurement of 600 may be quite good for a sand, but low for a clay.

Database Analysis
In 2016, we examined samples analyzed using CASH from the continental US states. We identified three regions having suitable sample sizes (n=5,767 total) for further analysis, including the Mid-Atlantic, Midwest, and Northeast. These regions align with the United States Dept. of Agriculture Natural Resources (USDA) Conservation Service (NRCS) Major Land Resource Areas (MLRA) delineations. For each region, samples were identified by textural grouping to create a number of sub-datasets. Descriptive statistics and ANOVAs were performed to evaluate the mean and standard deviation of each region and texture. Based on these findings, we adjusted scoring functions for physical and biological indicators to account for observed statistically significant regional differences in mean indicator values. Chemical indicators are scored using experimentally-established thresholds, rather than the CND (see below), so they were left largely unchanged.

New Scoring Functions
Figures 2 and 3 show the updated scoring functions for each soil health indicator.  Most of these are universally applied to all soils analyzed with the CASH, but in some cases, special considerations are required.  For example, a separate scoring function for pH is now used for acid-loving crops (e.g., blueberries or potatoes; Fig. 3a), set one pH unit lower (5.2-to-6.3 are optimum, etc.).   Modified-Morgan-P also uses an optimum scoring function (Fig. 3b), where concentrations ranging from 3.5-21.5 ppm are scored at 100. Negative impacts are expected when P is deficient ([P] ≤ 0.45 ppm) or excessive ([P] ≥ 100 ppm).  Secondary (Mg) and trace (Fe, Mn, Zn) nutrients are scored using a sub-scoring system (Fig. 3d). Each nutrient is assigned a sub-score of either 0 (suboptimum) or 100 (optimum) depending on measured values. The average of the four nutrient sub-scores is used to determine the secondary nutrient score.

Figure 2. Comprehensive Assessment of Soil Health scoring functions for physical (a.-c.) and biological (d.-h.) soil health indicators. Functions are shown overlying a five color scheme (red-orange-yellow-light green-dark green), used to classify scores as very low (0-20), low (20-40), medium (40-60), high (60-80), and very high (80-100), respectively.


Figure 3. Comprehensive Assessment of Soil Health scoring functions for chemical indicators: pH (a) and Modified Morgan Extractable Phosphorus (b), Potassium (c), and secondary/trace nutrients (Mg, Fe, Mn, Zn) (d). Scores are coded using a five-color scheme (red-orange-yellow-light green-dark green), used to classify scores as very low (0-20), low (20-40), medium (40-60), high (60-80), and very high (80-100), respectively.
Figure 3. Comprehensive Assessment of Soil Health scoring functions for chemical indicators: pH (a) and Modified Morgan Extractable Phosphorus (b), Potassium (c), and secondary/trace nutrients (Mg, Fe, Mn, Zn) (d). Scores are coded with a five color scheme (red-orange-yellow-light green-dark green), which classifies scores as very low (0-20), low (20-40), medium (40-60), high (60-80), and very high (80-100), respectively.

The CASH Report Summary has traditionally used a three-color system (green-yellow-red; or low-medium-high) for interpreting measured indicator values. This system provided limited resolution for detecting changes in soil health over time, as scores ranging from 30-to-70 would be interpreted as ‘medium’ in the report. To address this, we adjusted to a five-color scale (red-orange-yellow-light green-dark green) to classify values as very low (0-20), low (20-40), medium (40-60), high (60-80), and very high (80-100), respectively.  This visual change more easily demonstrates subtle soil health improvements.

The lower the CASH score, the greater the constraint in the proper functioning of processes as represented by the indicator. Land management decisions should, therefore, place priority on correcting very low scores (red). Low and medium scores (orange and yellow) do not necessarily represent a major constraint to proper soil functions, but rather suggested improvements that can be made in management planning. High or very high scores (light green and dark green) indicate that the soil processes represented by these indicators are likely functioning well. As such, management goals should aim to maintain those conditions.

Conclusion
The initial CASH soil health scoring functions were developed using data collected from Northeastern soil samples analyzed in the early 2000s.  Ten years of soil health testing allowed us to build on a robust database including measured data for multiple soil health indicators. In 2016, we revisited the scoring functions used to score physical and biological indicators to increase the scope of the CASH to soils outside of the Northeast US. These changes have been incorporated into the CASH, most of which effectively increase the score associated with a given measured indicator value. These adjustments, in addition to the expanded five-color scheme, have helped address some of the concerns expressed by clients who found the CASH interpretations to be slightly off in some cases.

A full manuscript of this article titled “Statistics, Scoring Functions, and Regional Analysis of a Comprehensive Soil Health Database” is currently under review by the Soil Science Society of America Journal.  For more details about the CASH framework, visit bit.ly/SoilHealthTrainingManual for a free download of the third edition of the training manual.

Save

Save

Save

Save

Save

Save

Save

Organic Corn Only Yields 7% Lower than Conventional Corn during the Second Transition Year

By Bill Cox1, Eric Sandsted1, Phil Atkins2, and Brian Caldwell1
1Soil and Crop Sciences Section – School of Integrated Plant Science, Cornell University; 2New York State Seed Improvement Program

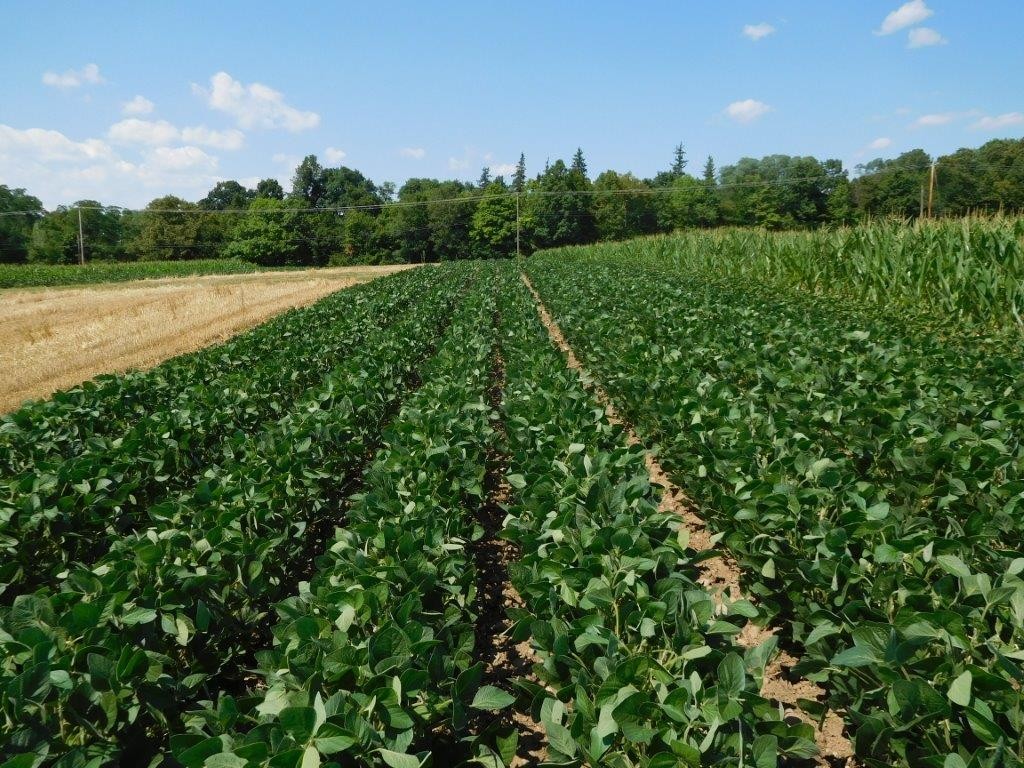
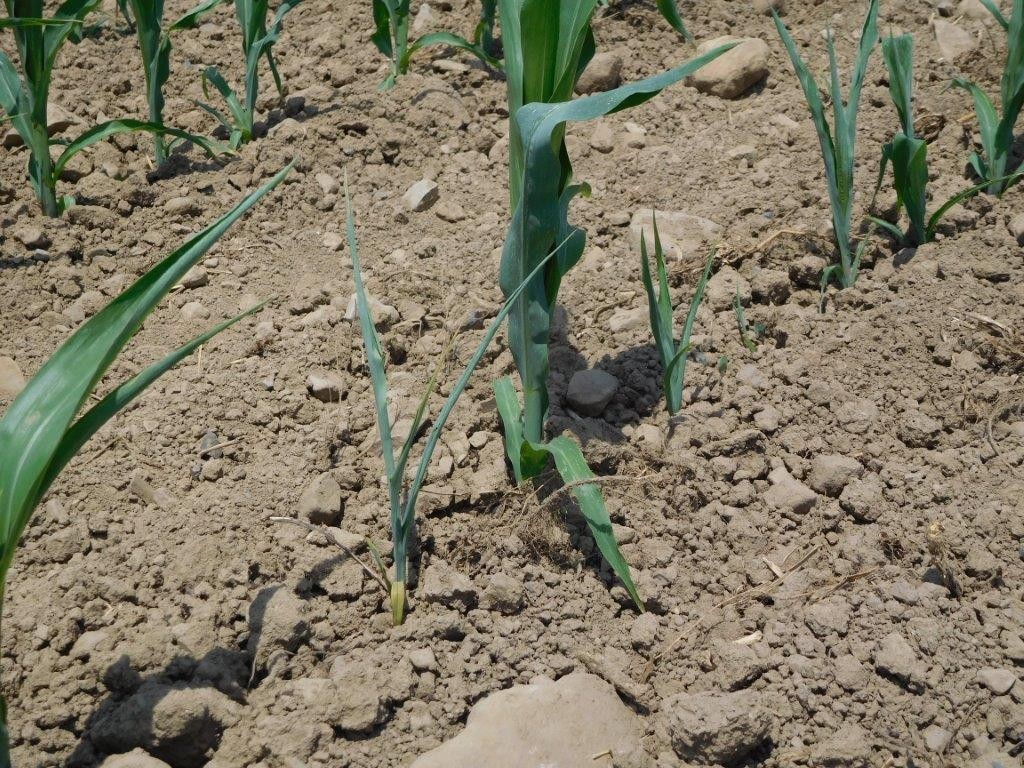
Extremely dry soil conditions in June (0.74 inches of precipitation), exacerbated by a robust red clover green manure crop, resulted in natural crop mortality in late-emerging corn, as well as crop mortality from cultivation in organic corn (photo taken on June 26).

We initiated a 3-year study at the Aurora Research Farm in 2015 to compare different sequences of a corn, soybean, and wheat/red clover rotation in conventional and organic cropping systems with recommended and high input management during the 3-year transition period (2015-2017) from conventional to an organic cropping system. We provided detailed discussions of the experiment (https://blogs.cornell.edu/whatscroppingup/2015/11/09/corn-yield-under-conventional-and-organic-cropping-systems-with-recommended-and-high-inputs-during-the-transition-year-to-organic/) and the timing of management practices in 2016 and weather conditions through July of 2016 in previous soybean articles (https://blogs.cornell.edu/whatscroppingup/2016/07/27/emergence-plant-densities-v3-stage-and-weed-densities-v14-stage-of-corn-in-conventional-and-organic-cropping-systems-in-2016/).

Briefly, a preceding red clover green manure crop (~3.75 dry matter tons/acre) was mowed down on May 18. Dry weather conditions (1.9 inches in March, 1.87 in April, and 1.35 inches from May 1-19), exacerbated by the robust red clover crop, made soil conditions exceedingly dry so plow penetration was difficult in some regions of the fields on May 19. We planted a treated (insecticide/fungicide seed treatment) GMO corn hybrid, P96AMXT, in the conventional system; and its isoline, the untreated non-GMO, P9675, in the organic cropping system at two seeding rates, ~29,600 kernels/acre (recommended input treatment) and 35,500 kernels/acre (high input) on May 20. The high input organic treatment also received the organic seed treatment (in-hopper), Sabrex. We applied Roundup at 32 oz. /acre for weed control in conventional corn at the 4th-5th leaf stage (V4-V5 stage) on June 22 under both recommended and high input management. We also side-dressed the high input treatment with 60 lbs. N/acre. We used the rotary hoe to control weeds in the row in recommended and high input organic corn at the V1-2 stage (June 9). We then cultivated close to the corn row in both recommended and high input organic treatments at the V3 stage (June 15) with repeated cultivations between the rows at the V4-V5 stage (June 22) and again at the V7-V8 stage (July 1). We harvested the crop on November 3 when conventional corn averaged 20.3% and organic corn averaged significantly lower at 19.6% moisture.

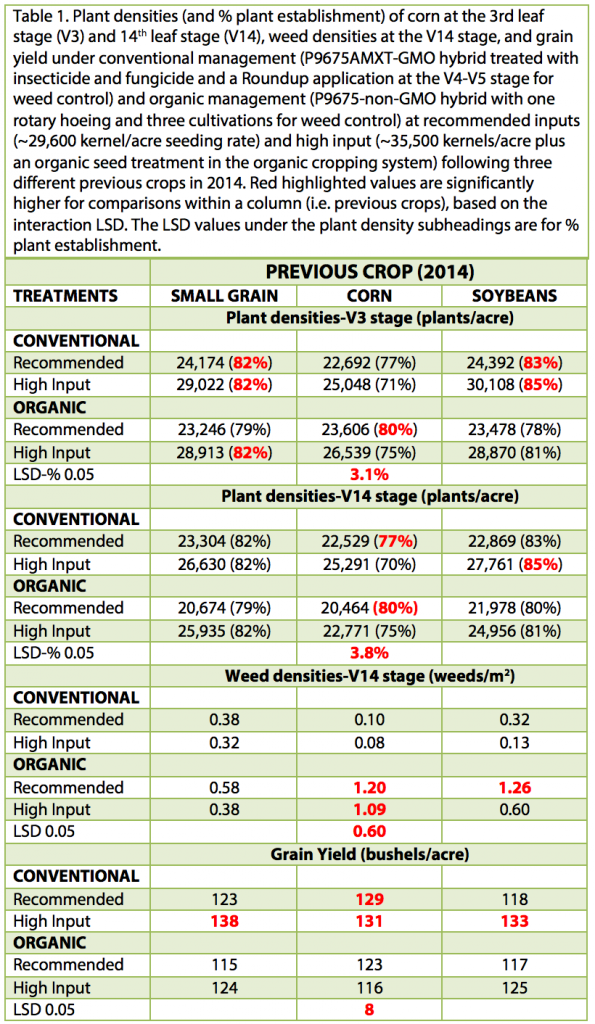
Corn plant densities at the V3 stage (June 14), just prior to the close cultivation to the corn row on June 15 but after the rotary hoeing, were relatively low in 2016 (Table 1), undoubtedly because limited rainfall coupled with the robust green manure crop resulted in dry planting conditions. Conventional (70 to 85% plant establishment) and organic corn (75 to 82% plant establishment) had similar plant densities at the V3 stage, unlike 2015 when conventional corn had greater plant establishment. Conventional and organic corn in the high input treatment averaged ~28,000 plants/acre (Table 1), which usually results in close to optimum yield (http://scs.cals.cornell.edu/sites/scs.cals.cornell.edu/files/shared/documents/wcu/WCUvol23no1.pdf). Conventional and organic corn in the recommended input treatment averaged only ~23,500 plants/acre (Table 1), which typically results in yield reductions in most growing seasons. Unfortunately, dry conditions persisted (0.74 inches in June and 1.89 inches in July) so plant densities decreased further by the V14 stage probably because of crop mortality in conventional and a combination of crop mortality and crop damage by cultivation in organic corn. Consequently, conventional corn at the V14 stage (1300 fewer plants/acre or a ~5% decrease from V3 to V14) compared with organic corn (3150 fewer plants/acre or a ~12% decrease) now had greater plant densities (Table 1). Such low plant densities in the recommended input treatment in conventional (~23,000 plants/acre) and organic corn (~21,000 plants/acre) should reduce yields, even in a dry growing season, because of the limited capacity of corn to compensate at low plant densities.

cox-corn-table-1

Weed densities at the V14 stage were also quite low in 2016 (Table 1) because of the lack of significant rainfall events required to initiate weed emergence after cultivations in organic corn or herbicide application in conventional corn. Although weed densities were mostly higher in the organic cropping system, weed densities ranged from only 0.38 to 1.26 weeds/m2 (compared with 1.61 to 3.10 weeds/m2 in 2015), which probably had limited impact on yield. Weed densities in the conventional cropping system ranged from 0.08 to 0.38 weeds/m2, which indicates excellent efficacy of a Roundup application on drought-stressed weeds that emerged after the May 20 planting date and before the June 22 Roundup application.

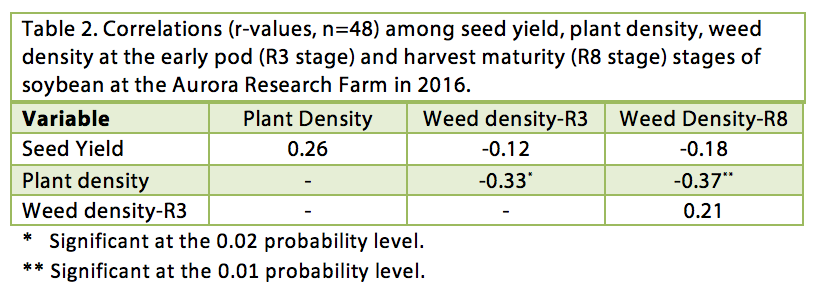
Conventional compared with organic corn yielded ~7% higher in 2016 (Table 1). Yields, however, were low because of exceedingly dry conditions, including during the critical 2 week period before and after silking (~July 25). Grain yield did not correlate with plant densities at the V3 stage, but had a highly significant correlation with plant densities at the V14 stage (r=0.46, Table 2). Grain yield, however, had virtually no relationship with weed densities in 2016 (Table 2). In 2015, the 20 to 40% lower yield in organic compared with conventional corn in the first transition year (no red clover green manure crop was in place) was associated with lack of soil N availability in organic corn (https://blogs.cornell.edu/whatscroppingup/2015/11/09/corn-yield-under-conventional-and-organic-cropping-systems-with-recommended-and-high-inputs-during-the-transition-year-to-organic/).The 3.5 ton/acre red clover green manure crop probably provided adequate soil N to both organic and conventional corn in 2016 (although the release of N was slow because of the dry conditions). On the other hand, the robust red clover crop probably also contributed in part to the low establishment rates and subsequent low corn yields.

screen-shot-2016-11-28-at-10-24-24-am

Likewise, high compared with the recommended input treatment in corn yielded significantly higher (Table 1). Although not a significant 2-way interaction (p=0.08), high compared with recommended input had a 9.2% yield advantage in conventional corn compared with a 3.2% yield advantage in organic corn. Again, the higher yield in high compared with recommended input, especially in conventional corn, was associated with the higher plant densities at the V14 stage. Despite yielding ~11 bushels/acre higher, the high input compared with the recommended input treatment in conventional corn would not provide greater partial returns at a ~ $4.00/bushel corn selling price because greater seed (6000 more seeds/acre) and N costs (60 lbs./acre of side-dressed N in the high input) offset the greater partial returns.

In conclusion, organic compared with conventional corn yielded ~7% lower in 2016, the second year of the transition from conventional to an organic cropping system. In contrast, organic compared with conventional corn yielded 20-40% lower during the first transition year in 2015 when a green manure crop was not in place. Based on the results of this study, planting a green manure crop to build-up the soil N supply during the first transition year, followed by corn in the second year, is probably a viable strategy instead of planting corn in the first year of the transition period. Corn will follow a wheat/red clover crop as well as soybean (unable to plant wheat after soybean harvest this year because of green stem in soybean and a record wet October) in 2017 so we will be comparing corn in a corn-soybean-corn rotation and in a soybean-wheat/red clover-corn rotation next year. Corn will be eligible for the organic premium in 2017 because 36 months would have elapsed from harvesting conventional spring barley (August), soybean (October) and corn (early November) in 2014, provided we delay corn harvest until the second week of November. Consequently, the inability to plant wheat after soybean harvest this year may be a blessing in disguise because of low current wheat prices and the eligibility of corn for the organic price premium in 2017.

Organic Soybean Once Again Yields Similarly to Conventional Soybean during the Second Transition Year

By Bill Cox1, Eric Sandsted1, Phil Atkins2, and Brian Caldwell1
1Soil and Crop Sciences Section – School of Integrated Plant Science, Cornell University; 2New York State Seed Improvement Program

Organic compared with conventional soybean yielded similarly, despite not filling in between the rows until the first week of August, which contributed to in part to greater weed densities at harvest (photo taken on July 27).

We initiated a 3-year study at the Aurora Research Farm in 2015 to compare different sequences of a corn, soybean, and wheat/red clover rotation in conventional and organic cropping systems under recommended and high input management during the 3-year transition period (2015-2017) from conventional to an organic cropping system. We provided detailed discussions of the experiment (https://blogs.cornell.edu/whatscroppingup/2015/11/09/corn-yield-under-conventional-and-organic-cropping-systems-with-recommended-and-high-inputs-during-the-transition-year-to-organic/) and the timing of 2016 management practices and weather conditions through July of 2016 (https://blogs.cornell.edu/whatscroppingup/2016/07/28/emergence-plant-densities-v2-stage-and-weed-densities-r3-stage-of-soybean-in-conventional-and-organic-cropping-systems-in-2016/).

Briefly, corn was the preceding crop in 2015 and we moldboard plowed (May 19) and culti-mulched the experimental sites. We planted (May 20) the treated (insecticide/fungicide) GMO variety, P22T41R2 with the RR2Y and SCN traits, in 15-inch row spacing and the non-treated, non-GMO variety, 92Y21, in 30-inch row spacing at two seeding rates, ~150,000 (recommended input) and ~200,000 seeds/acre (high input). We treated the non-GMO, 92Y21, in the seed hopper with the organic seed treatment, Sabrex, in the high input treatment. We applied Roundup at 32 oz. /acre for weed control in conventional soybean at the V4 stage (June 22) in both recommended and high input treatments. We used the tine weeder to control weeds in the row in both recommended and high input organic treatments at the V1-V2 stage (June 9). We then cultivated close to the soybean row in both recommended and high input organic treatments at the V3 stage (June 15), followed by repeated cultivations between the entire row at the V4 (June 22), beginning flowering (R1) (July 1), and full flowering (R2) stages (July 14). The high input soybean treatment in the conventional cropping system also received a fungicide application on July 27, the R3 stage. We harvested all treatments on November 9 when conventional and organic soybean averaged ~12.0% moisture.

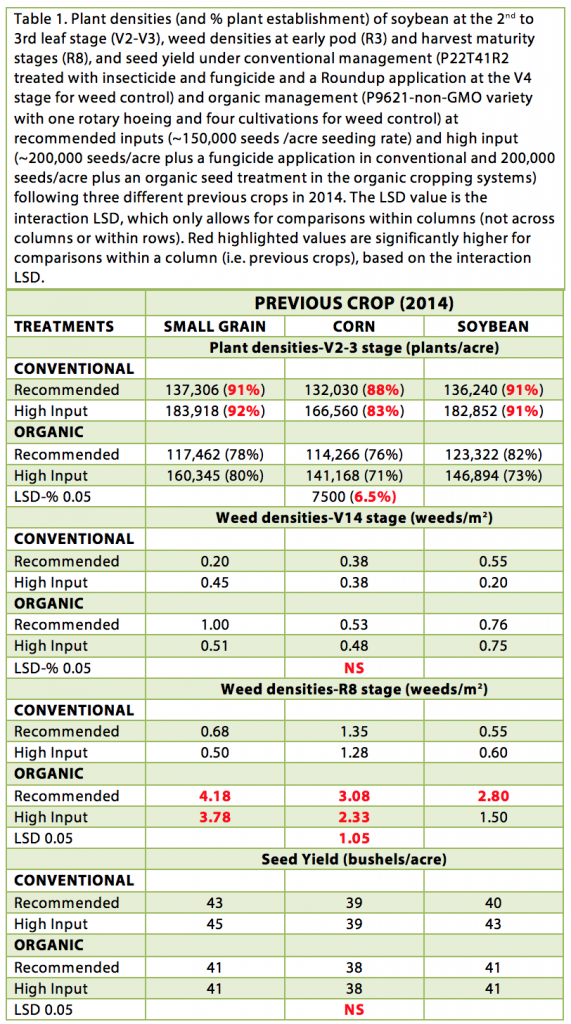
We estimated soybean plant densities at the V2-V3 stage (June 13), prior to the close cultivation to the soybean row on June 15, but unfortunately after tine weeding the organic soybeans. Conventional soybean consistently had higher plant establishment rates (83 to 92%) compared with organic soybean (71 to 82%, Table 1). The lower plant establishment rates in organic soybean were probably associated in part with some crop damage during tine weeding. Nevertheless, plant densities exceeded 114,000 plants/acre in all organic treatments, the threshold density below which soybean yields decrease in NY under typical growing conditions (http://scs.cals.cornell.edu/sites/scs.cals.cornell.edu/files/shared/documents/wcu/WCU21-2.pdf). We are in the process of estimating soybean densities (and yield components) at harvest to determine the extent of crop damage during the subsequent four cultivations in the organic cropping system.

cox-soybean-table-1

Weed densities were exceedingly low in soybean through July or the R3 stage in 2016 (Table 1) probably because of the lack of significant precipitation events in June (0.74 inches) and July (1.89 inches). Weed densities were not significantly different between organic (~0.50 to 1.00 weeds/m2) and conventional cropping systems (~0.20 to 0.55 weeds/m2). In August, however, the experimental site received 4.56 inches of precipitation, which contributed to a significant increase in weed densities in both cropping systems, especially the organic cropping system. The exceedingly dry conditions (3.28 inches from the May 20 planting date through July 31) limited soybean vegetative growth, especially in organic soybean in 30-inch row spacing, which did not canopy in until early August. In contrast, the 15-inch conventional soybean canopied in by mid-July to provide some shade and perhaps reduce weed emergence after the Roundup application on June 22. Consequently, the later shading in between the rows in organic soybean probably contributed in part to greater weed emergence after the last cultivation on July 14 and subsequent greater weed densities at the R8 stage (~3.0 weeds/m2) compared with conventional soybean (~0.80 weeds/m2, Table 1). In addition, the preceding organic corn in 2015 averaged about 2.25 weeds/m2 compared with ~0.55 weeds/m2 in conventional corn at the V10 stage in 2015 (https://blogs.cornell.edu/whatscroppingup/2015/11/09/corn-yield-under-conventional-and-organic-cropping-systems-with-recommended-and-high-inputs-during-the-transition-year-to-organic/), which may have contributed to a greater weed seed bank in the organic soybean plots.

Despite lower plant densities and greater weed emergence from the R3 to R8 stage, organic soybean yielded similarly compared to conventional soybean (Table 1). Obviously, lower plant densities and greater weed emergence after the R3 stage did not affect organic soybean yields in a growing season when the least amount of rainfall was ever recorded at the experimental site from May 20-July 31 (3.28 inches), but adequate precipitation occurred from the R3 to R7 stage (physiological maturity). Likewise, in 2015, when the 2nd wettest June (8.00 inches of precipitation; only 1972 was wetter when Hurricane Agnes flooded NY and June totaled 11.57 inches), but the driest 8/1-9/9 period (R3 to R7 stage when only 1.36 inches was received) ever were observed at the experimental site, organic and conventional soybean also yielded similarly (https://blogs.cornell.edu/whatscroppingup/2015/11/09/soybean-yield-under-conventional-and-organic-cropping-systems-with-recommended-and-high-inputs-during-the-transition-year-to-organic/). It will be interesting to see if organic and conventional soybean will yield similarly in a growing season with normal precipitation patterns, if indeed a normal precipitation pattern ever does occur again!

Organic soybean did not respond to high inputs (organic seed treatment and high plant populations), similar to results in 2015. The organic seed treatment did not improve soybean emergence, and plant densities were not significantly correlated with yield in 2016 (Table 2). Soybean has tremendous compensation ability, via development of numerous side branches with numerous pods, which allows yields to be maintained despite plant establishment rates of only ~70%. Consequently, conventional soybean usually does not respond to high plant populations (>150,000 seeds/acre) in NY as long as early plant establishment rates are ~114,000 plants/acre. Weed control, however is usually not an issue in conventional soybean (narrow rows and residual and/or post-emergence herbicides for weed control) when plant densities are low. In contrast, organic soybean relies in part on shading for weed control in the row so organic soybean has responded to high plant densities in some locations, especially in more southern latitudes than NY, because of improved weed control. Plant densities did have a negative correlation with weed densities at the R3 and R8 stages (r=-0.33 and -0.37, respectively, Table 2), indicating significant negative associations between weed and plant densities. Seed yield, however, was not correlated with weed densities at the R3 nor at the R8 stages (Table 2), which is noteworthy in a dry growing season, when weeds compete with the crop for scarce soil water. As the weed seed bank increases in the organic cropping system, it will be interesting to observe if weed densities (and plant densities) continue to have no association with soybean yield. Unlike 2015, conventional soybean did not respond to high inputs in 2016, probably because dry conditions limited disease development, resulting in no response to the fungicide application at high plant densities.

screen-shot-2016-11-28-at-10-00-43-am

In conclusion, organic compared with conventional soybean yielded essentially the same during the second year of the transition from conventional to an organic cropping system, similar to yield data in 2015. As in 2015, organic soybean yielded the same under recommended input management, despite early plant establishment rates of only ~115,000-120,000 plants/acre. Based on the results of this study, soybean under recommended management practices appears to be an excellent crop for either the first or second year of the transition. Green stem, however, in the non-GMO organic variety prevented the harvest of soybean in late September when the seeds and pods of both varieties were ready for harvest. The ensuing wettest October on record at the experimental site (7.92 inches of precipitation), followed by another 1.10 inches of rain during the first week of November, further delayed harvest until November 9. Because of the wet soil conditions, we would not have been able to plant wheat after soybean until mid-November, which we deemed as too late in New York. The downside of an organic corn-soybean-wheat rotation is that delayed soybean harvest associated with late planting and/or a cool year or green stem (no registered organic desiccant for soybean) may prevent winter wheat planting and subsequent frost seeding of red clover (N source for organic corn in this rotation) in some years.