Uber Ride-Sharing: A Matching Market?
https://marketplace.uber.com/matching
Matching riders and drivers is a core component of what makes Uber so successful. One way of matching riders and drivers is to match the closest driver with the closest rider. In other words, matching drivers with riders within close physical proximity of each other. However, Uber explains that this is not always the best case. Riders and drivers value short pick-up times, but this doesn’t mean that the closest match will meet this need. For example, whenever there is heavy traffic, one-way streets, or road detours due to construction, drivers can spend a longer time reaching the closest rider because they have to find an alternative path that takes them a longer time to reach said rider. Thus, the closest doesn’t mean the quickest.
For example, in Scenario A, Uber riders A and B are matched with drivers A and B respectively, which are closest distance-wise to the riders. However, Rider B experiences a longer waiting time of 9 minutes than Rider A who experiences a shorter waiting time of 2 minutes. With this matching algorithm, the system is not optimal because Rider B is worse off than Rider A.

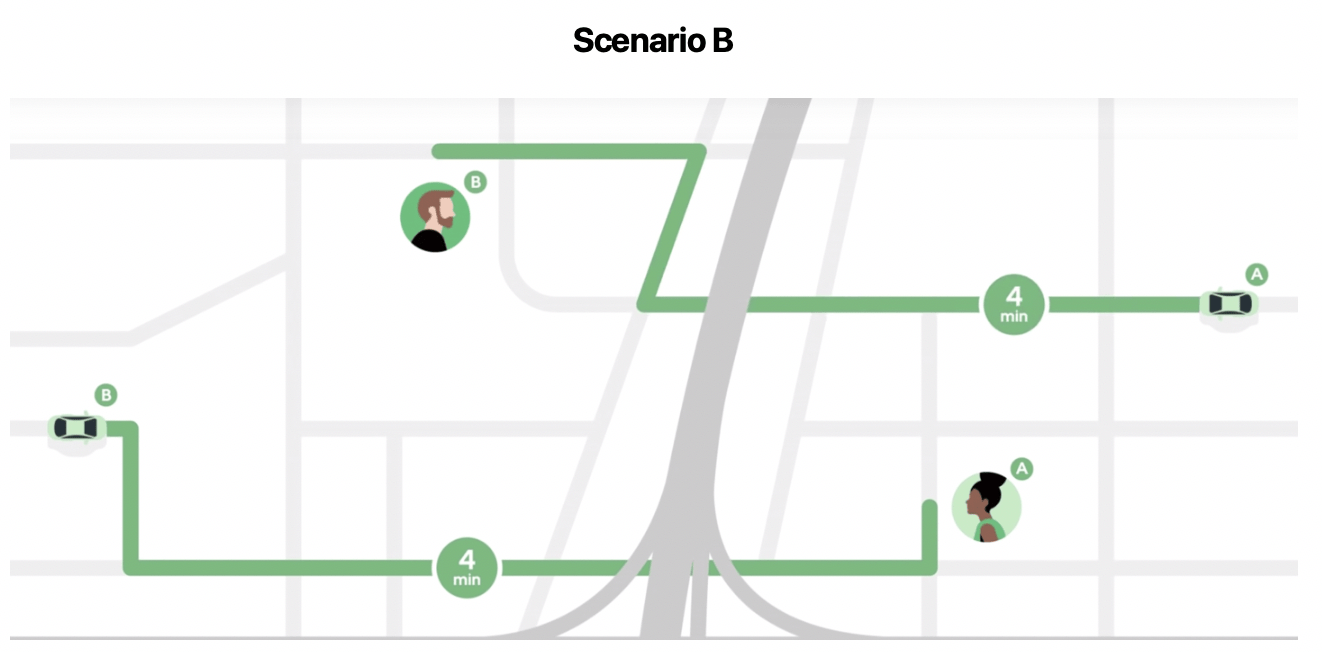
Looking for the closest driver based on the expected time to get to the rider – taking into account real-time traffic and all other time-related factors, inspired Uber to optimize its matching system throughout the entire ride-sharing network – where all riders and drivers experience, on average, a similar pick-up time based on the driving route the app calculates for drivers to get to the rider’s pick-up location. Uber calls this system “batch matching”, where riders and drivers are matched in a way that lowers waiting times for everyone in the area – distributing a similar or equal payoff for riders. This is visualized in Scenario B, where rider A is matched with driver B and rider B is matched with driver A because this lowers the average waiting time for everyone in the ‘batch’ or area. Now, Riders A and B experience the same waiting time of 4 minutes each.
However, matching drivers and riders becomes even more complex when there are millions of users requesting rides to different destinations at the same time, and sometimes even from the same pick-up location. When there are multiple riders and drivers who are in close proximity to each other but are actually ‘far’ from each other because it takes drivers a long time to actually reach a rider’s pick-up location, the batch matching system becomes useful.
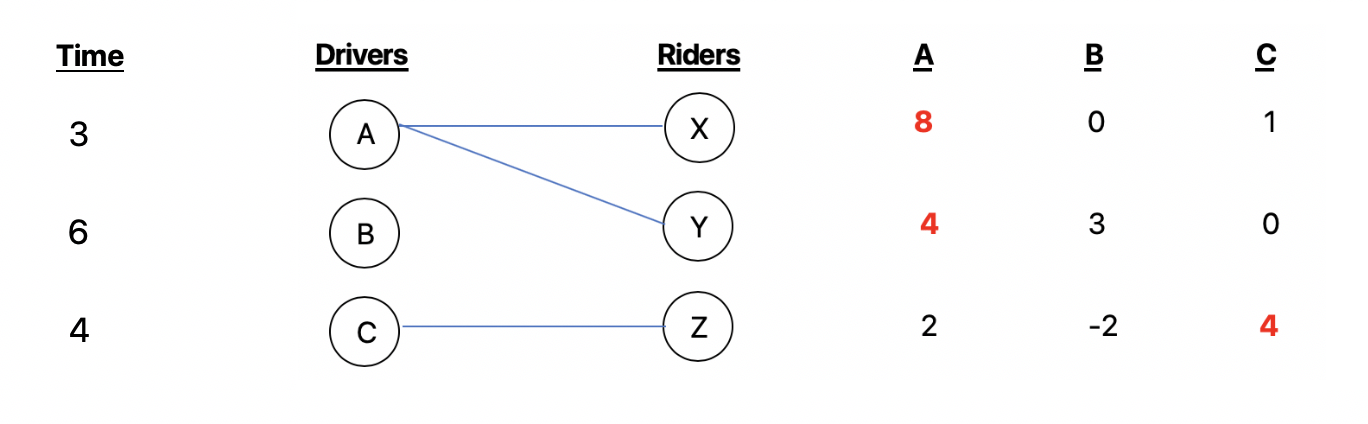
In relation to the course concept of ‘matching markets’, this ride-sharing problem can be presented through a bipartite matching graph. Say we have riders X, Y, and Z who are waiting to be matched with drivers A, B, and C. Before applying Uber’s ‘batch matching’ algorithm, Uber first calculates valuations of each driver to a specific rider based on how physically close a rider is to a driver (i.e. their original system before batch matching). Valuations in this scenario reflect how much a rider would like to be paired with a driver based on how physically close they are to a driver. In other words, the higher the rider’s value for the driver, the closer the driver is from the rider, and vice versa. In this case, we use valuations to ensure optimal assignments of riders with drivers, which Uber calculates first based on physical proximity. In the illustration below, all three riders are matched perfectly with driver assignments that maximize their social welfare.

However, Uber recognizes that distance to the driver is not the only factor that is important. Waiting times are also important to consider because even though a driver is in close distance to a rider, it might take them a long time to actually reach a rider’s pick-up location due to traffic, road construction, and other factors. Nonetheless, unlike the matching market concept learned in class, Uber’s matching system places value on time rather than price. Hence, the illustration below takes into account a set of waiting times, which affect the value of each driver for each rider. The illustration below shows that even though rider X was initially matched with driver A, rider Y with driver B, and rider Z with driver C, taking into account the time it takes for each driver to reach each rider does not result in a perfect match, since the waiting times for each rider are now vastly different from one another’s – resulting in a lower payoff for some riders over others. . In this case, driver A takes three minutes to reach riders X, Y, or Z, which consequently decreases A’s valuation for all riders, but causing both riders X and Y to demand driver A. When waiting times are considered, riders X and Y both want driver A because choosing driver A gives them the highest payoff and maximizes their social welfare.
In order to account for these time-related factors, Uber’s batch-matching algorithm ensures that everyone in the ‘batch’ or area experiences a similar, if not the same, waiting time. Because riders X and Y want driver A in the above example, Uber’s batch matching system attempts to equalize waiting times for all the riders in the area. If we apply the same pick-up times to all the drivers below, we can see that the market clears because each node or each rider is perfectly matched to a driver that maximizes their social welfare.

Batch matching thus ensures that the system is optimized for all Uber users because taking into account waiting times can lead to allocations of drivers to riders that are socially optimal for ALL riders and drivers. While Uber recognizes that there are many ways to match riders and drivers, the batch matching system is a perfect ‘matching market’ example that allows ride-sharing technology companies like Uber to create a seamless pickup experience for both riders and drivers – reducing waiting times for riders and maximizing earning time for drivers.